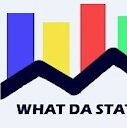
Unemployment Rates by Country and World 1991-2021
This bar chart races shows the unemployment rates by country/territory and world, annually from 1991 to 2021.
The unemployment rate is the percentage of the labour force without work, but available for and seeking employment.
Numbers are modeled ILO estimates.
Sources:
World Development Indicators, International Labour Organization (ILO)
Music:
TeknoAXE - Lost In The Distance
https://www.youtube.com/c/teknoaxe
Special intro background effect by:
AA VFX: https://www.youtube.com/c/dvdangor2011/
Data visualization created with flourish.studio
5
views
Ukraine War Day 1-100 | Military Losses Vehicles and Equipment
This bar chart race shows visually confirmed military vehicle and equipment losses during the invasion of Ukraine 2022, day 1 to 100.
Only vehicles and equipments with photo or videographic evidence are included. The real numbers are higher.
Numbers are shown as day confirmed.
Credits: Stijn Mitzer, Joost Oliemans Kemal, Dan and Jakub Janovsky at Oryx (oryxspioenkop.com)
DANIELE - Two Sides
Soundcloud: https://soundcloud.com/d4ni3l3
Youtube: https://www.youtube.com/channel/UC8XFrOYJnO6hk92WBLcxMKw
Facebook page: https://www.facebook.com/DanieleCinematicEpicMusic
Special intro background effect by:
AA VFX: https://www.youtube.com/c/dvdangor2011/
Data visualization created with flourish.studio
17
views
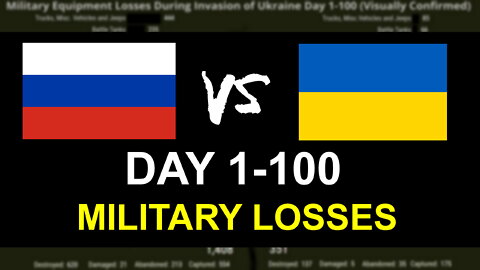
Monkeypox Cases by Country | May 2022
This bar chart race shows the confirmed monkeypox cases by country and world, outside endemic countries in Africa, in May 2022.
The cases are shown when confirmed, and timeline only shows dates when there are confirmed cases.
Three confirmed cases in USA have unknown date. These are added to the last day.
There are no known deaths as of today.
Source: Global.health Monkeypox (accessed on 2022-06-01)
Music:
D. J. Pinto - Tension
Link: https://youtu.be/AF17oTTak_I
Music provided by: MFY - No Copyright
Special intro background effect by:
AA VFX: https://www.youtube.com/c/dvdangor2011/
Data visualization created with flourish.studio
9
views
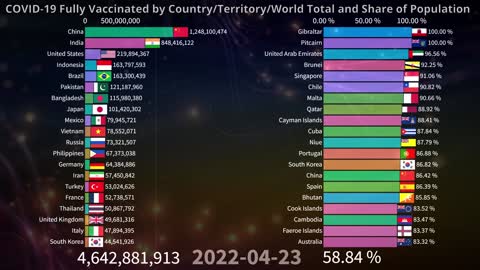
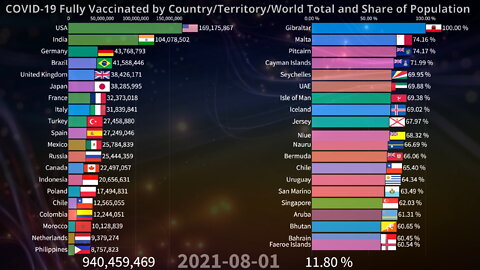
💉 COVID-19 Fully Vaccinated by Country and World 05.26.2022
This bar chart race shows the number of people and the share of population that are fully vaccinated by country/territory until the 26th of May 2022.
Numbers are shown as dates reported and interpolated.
"Fully vaccinated" represents here the total and share of population that have received all doses prescribed by the vaccination protocol.
Music:
Whitesand - Imperfections
https://www.youtube.com/watch?v=pRfTMeJbg4M
https://whitesand.bandcamp.com/
https://open.spotify.com/artist/3GXunV3wsCpSdKp0L5tcNH
Special background effect by:
AA VFX: https://www.youtube.com/c/dvdangor2011/
Data visualization created with flourish.studio
11
views
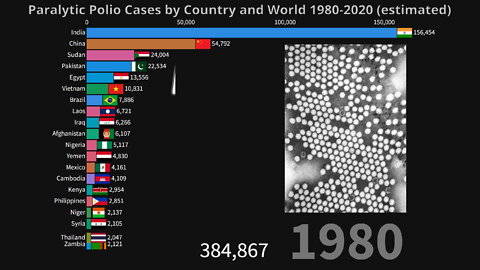
Paralytic Polio Cases by Country and World 1980-2020
This bar chart race shows the estimated paralytic polio cases by country and world and vaccination coverage of one year olds since 1980.
USSR is not included. Former USSR republic are included as countries from 1991.
Sources:
Duintjer Tebbens et al. (2010), WHO.
Music:
Whitesand - I am Worthy
https://www.youtube.com/watch?v=Lh7E6pGPa-0
https://whitesand.bandcamp.com/
https://open.spotify.com/artist/3GXunV3wsCpSdKp0L5tcNH
Special intro background effect by:
AA VFX: https://www.youtube.com/c/dvdangor2011/
Data visualization created with flourish.studio
2
views
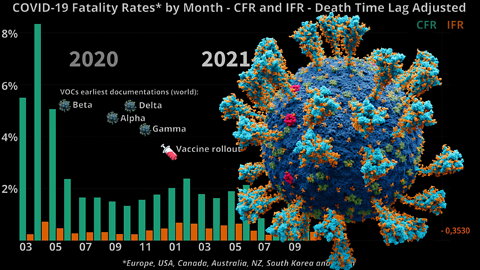
COVID-19 Fatality Rates by Month | CFR and IFR Time Lag Adjusted
This video shows the COVID-19 fatality rates, Case Fatality Rate (CFR) and Infection Fatality Rate (IFR) by month from March 2020 to April 2022.
Countries included: Europe, USA, Canada, Australia, New Zealand, South Korea and Japan.
CFR is calculated as the number of Covid-19 deaths in percentage of number of CONFIRMED Covid-19 cases.
IFR is calculated as the number of Covid-19 deaths in percentage of number of ESTIMATED Covid-19 cases.
CFR and IFR are adjusted for the time lag between first day of infection and time of death, to better reflect the real rate for each month. The average time between infection and death is about 14 days, but at the same time reporting of infections are delayed and there are usually incubation time before testing. The time lag used here is therefor 7 days (i.e. deaths from January 8th to February 7th divided by infections in January).
Variants of concern (VOC) are shown as first documented in the world, and should not to be confused with sequencing in the countries included. For instance Delta variant was first documented early on in India, but did become the dominant variant in other countries much later.
Sources:
IHME, CSSE.
Music:
Omega by Scott Buckley – www.scottbuckley.com.au
Special intro background effect by:
AA VFX: https://www.youtube.com/c/dvdangor2011/
Data visualization created with flourish.studio
21
views
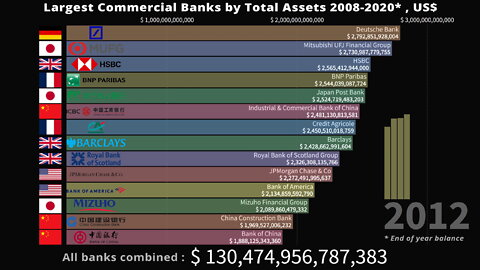
🏦 Largest Banks in the World by Total Assets 2008-2020
This bar chart race shows the largest commercial banks in the world by total assets and all worldwide banks combined, in US dollars from 2008 to 2020.
Most numbers are based on the balance at the end of the year (2020 = 31st December 2020), and retrieved march/april the next year.
Notes:
Japan Post Bank was privatized after a bill in 2005, but the process was halted and therefor numbers are not shown before 2012.
Sources:
International Monetary Fund (IMF), S&P Global, Relbank.
Music:
Infraction - The Victorious
https://infractionroyaltyfreemusic.bandcamp.com/music
Special intro background effect by:
AA VFX: https://www.youtube.com/c/dvdangor2011/
Data visualization created with flourish.studio
4
views
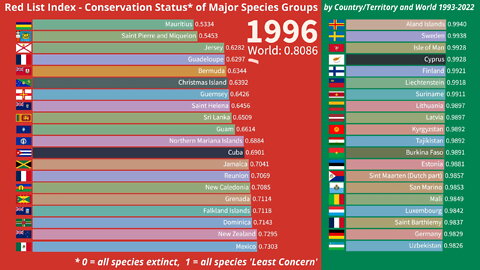
Red List Index by Country and World 1993-2022 | Species Conservation
This bar chart race shows the Red List Index by country/territory and world 1993 to 2022.
The Red List Index (RLI) defines the conservation status of major species groups (all mammals, birds, amphibians, corals and cycads), and measures trends in the proportion of species expected to remain extant in the
near future without additional conservation action.
An RLI value of 1.0 equates to all species being categorised as 'Least Concern', and hence that none are expected to
go extinct in the near future. A value of 0 indicates that all species have gone extinct.
Sources: IUCN (2022), BirdLife International, UN Statistics Division
Music:
Falling — Zephyr [Audio Library Release]
Music provided by Audio Library Plus
Watch: https://youtu.be/qPRZKKrSF_s
Free Download / Stream: https://alplus.io/falling
Special background effect by:
AA VFX: https://www.youtube.com/c/dvdangor2011/
2
views
💉 COVID-19 Vaccine BOOSTER Doses by Country and World | Total and Share of Population 04.25.2022
This bar chart race shows the number of vaccination booster doses administered by country and world, total and per 100 capita, until April 24th of 2022.
Booster doses are doses administered beyond those prescribed by the original vaccination protocol. Third and fourth dose of Pfizer/BioNTech vaccine, second dose of Johnson & Johnson vaccine etc.
Numbers are shown as their dates reported and interpolated. Timeline before July 2021 is shown as monthly.
Music:
Titan by Scott Buckley – www.scottbuckley.com.au
Special background effect by:
AA VFX: https://www.youtube.com/c/dvdangor2011/
7
views
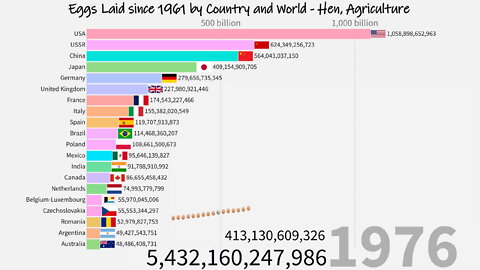
🥚🥚 Eggs Laid since 1961 by Country and World
This bar chart race shows the number of hen eggs laid by country (aggregated) and world (yearly and aggregated) in agriculture, from 1961 to 2020.
Numbers are based on total production in tonnes, and for each country adjusted for average weight due to different production standards.
Source:
FAO
Music:
TeknoAXE - Nineteen Eighty Seven
https://www.youtube.com/c/teknoaxe
Special Effect by:
AA VFX: https://www.youtube.com/c/dvdangor2011/
1
view
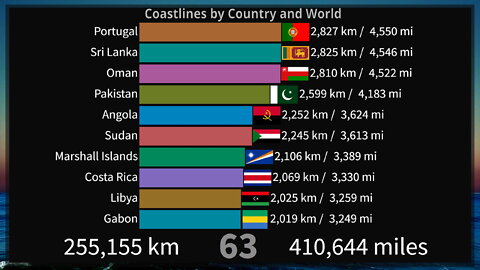
Length of Coastlines by Country and World
This bar chart show the approximated length of coastlines by country (top 100) and the world, in kilometers and miles, derived from World Vector Shoreline database at 1:250,000 scale.
The methodology used to estimate length is based on the following: 1) A country's coastline is made up of individual lines, and an individual line has two or more vertices and/or nodes. 2) The length between two vertices is calculated on the surface of a sphere. 3) The sum of the lengths of the pairs of vertices is aggregated for each individual line, and 4) the sum of the lengths of individual lines was aggregated for a country. In general, the coastline length of islands that are part of a country, but are not overseas territories, are included in the coastline estimate for that country (i.e., Canary Islands are included in Spain). Disputed areas are not included in country or regional totals.
Caspian Sea is included as part of coastlines, thus countries like Uzbekistan and Kazakhstan are not considered landlocked.
Macau and Hong Kong are included in China, but not Taiwan.
The world counter includes all coastlines.
Sources:
World Vector Shoreline, United States Defense Mapping Agency, Figures were calculated by L. Pruett and J. Cimino, unpublished data, Global Maritime Boundaries Database (GMBD), Veridian - MRJ Technology Solutions, (Fairfax, Virginia, January, 2000).
Music:
Rainswept - T.I.D.E.
https://soundcloud.com/rainsweptmusic/tide
T.I.D.E. By Rainswept is licensed under a Creative Commons License. https://creativecommons.org/licenses/by-sa/3.0/
Special Effect by:
AA VFX: https://www.youtube.com/c/dvdangor2011/
7
views
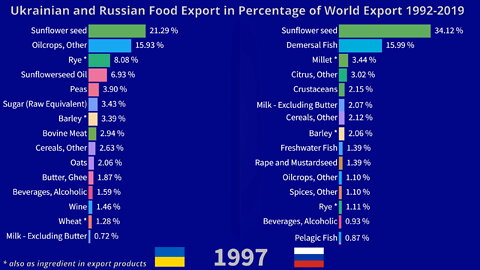
Ukrainian and Russian Food Export in Percentage of World Export since 1992
This bar chart race shows the ukrainian and russian food export in percentage of world export from 1992 to 2019. By main product categories.
Categories marked with * means including as ingredient in other products exported.
Source: FAO
Track: Daydream — Land of Fire [Audio Library Release]
Music provided by Audio Library Plus
Watch: https://youtu.be/mjmolfvZscQ
Free Download / Stream: https://alplus.io/daydream
Special Effect by:
AA VFX: https://www.youtube.com/c/dvdangor2011/
3
views
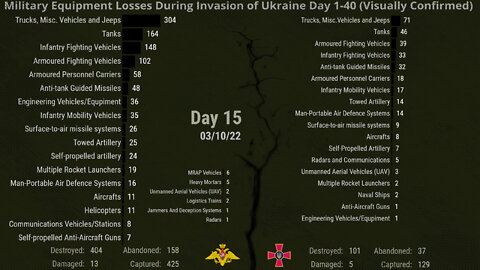
Russian and Ukrainian Losses Day 1-40 Military Vehicles and Equipment
This bar chart race shows visually confirmed military vehicle and equipment losses during the invasion of Ukraine 2022, day 1 to 40.
Only vehicles and equipments with photo or videographic evidence are included. The real numbers are higher.
Numbers are shown as day confirmed.
Credits: Stijn Mitzer, Joost Oliemans Kemal, Dan and Jakub Janovsky at Oryx (oryxspioenkop.com)
Music:
Miguel Johnson - Fight to the Death
is under a Creative Commons license (CC BY 3.0) https://creativecommons.org/licenses/by-nc/3.0/
https://soundcloud.com/migueljohnsonmjmusic/not-going-down-without-a-fight
Special Effect by:
AA VFX: https://www.youtube.com/c/dvdangor2011/
5
views
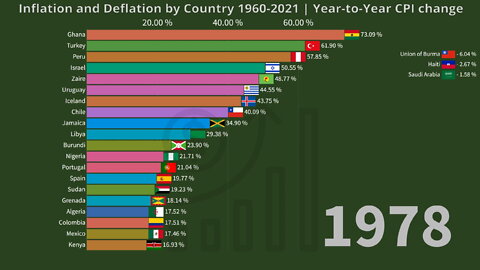
Inflation and Deflation by Country 1960-2021
This bar chart race shows the year-to-year inflation and deflation rates by country/territory from 1960 to 2021.
CPI: Consumer Price Index
Notes:
Numbers are shown when reported.
USSR, German Democratic Republic (East Germany) and Cuba are not included.
Argentina: From 1980, up to and including December 2016, annual inflation was calculated on the basis of the CPI for Greater Buenos Aires; and from January 2017 onwards, calculations are based on the National CPI.
Sources:
IMF, World Bank, Yugoslavia: Ashok Kumar Lahiri and J. van Houten, Yugoslav Inflation and Money (1991)
Music:
Whitesand - The Beast
https://whitesandcomposer.com
https://whitesand.bandcamp.com/
https://www.youtube.com/watch?v=_X7swRFHsgU
Special Effect by:
AA VFX: https://www.youtube.com/c/dvdangor2011/
19
views
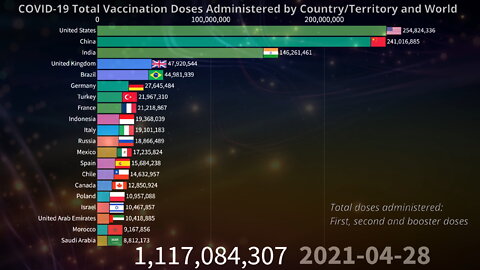
💉 COVID-19 Total Vaccine Doses Administered by Country and World 03.16.2022
This bar chart race shows the total number of vaccination doses administered until March 16th 2022.
Total doses administered: The sum of first, second and booster doses.
Numbers are interpolated.
Music:
Whitesand - Little Things
https://www.youtube.com/watch?v=uwLzq0tfpNc
https://whitesand.bandcamp.com/
https://open.spotify.com/artist/3GXunV3wsCpSdKp0L5tcNH
Special Effect by:
AA VFX: https://www.youtube.com/c/dvdangor2011/
22
views
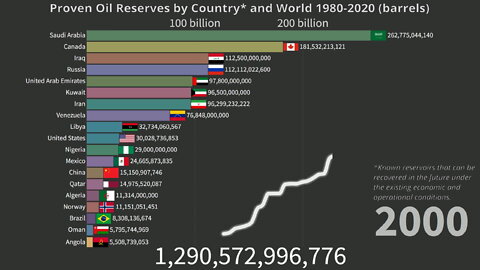
Oil Reserves by Country and World since 1980
This bar chart race shows the proven oil reserves by country and world from 1980 to 2020, measured in barrels.
Proven oil reserves are the quantities in known reservoirs that can be recovered in the future under the economic and operational conditions at the the time.
Source:
BP, Statistical Review of World Energy 2021
Music:
Jonathan Rich - Hope On The Horizon
is under a Creative Commons license (CC BY 3.0) https://creativecommons.org/licenses/by-nc/3.0/
https://soundcloud.com/jonathan-rich/hope-on-the-horizon-orchestral-theme
Special Effect by:
AA VFX: https://www.youtube.com/c/dvdangor2011/
8
views
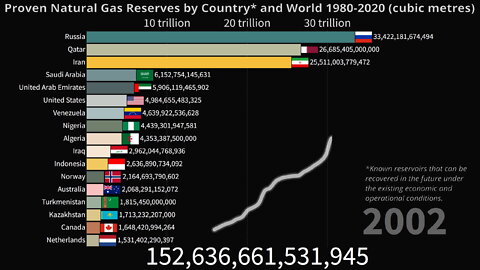
Gas Reserves by Country and World since 1980
This bar chart race shows the proven natural gas reserves by country and world from 1980 to 2020, measured in cubic metres.
Proven natural gas reserves are the quantities in known reservoirs that can be recovered in the future under the economic and operational conditions at the the time.
Source:
BP, Statistical Review of World Energy 2021
Music:
Afterlife by GalaxyTones
https://soundcloud.com/galaxytones
Creative Commons — Attribution 3.0 Unported — CC BY 3.0
Free Download / Stream: https://bit.ly/3HMZn6y
Music promoted by Audio Library https://youtu.be/91-VHpCpBH0
Special Effect by:
AA VFX: https://www.youtube.com/c/dvdangor2011/
9
views
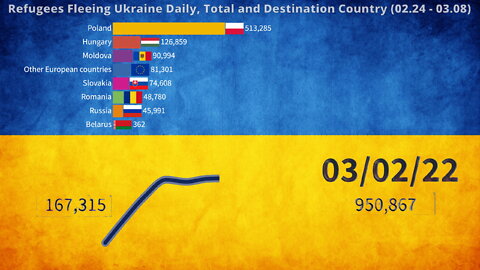
Refugees Fleeing Ukraine by Day and Destination Country
This bar chart race shows the number of refugees fleeing Ukraine by day, total and destination country, since 24th February 2022.
Numbers are shown as dates reported and interpolated.
Statistics reflect further movements of refugees, if refugees move from one into another country another day.
Internally displaced people are not included.
Source:
UNHCR, The UN Refugee Agency
Music:
DANIELE - Farewell
Soundcloud: https://soundcloud.com/d4ni3l3
Youtube: https://www.youtube.com/channel/UC8XFrOYJnO6hk92WBLcxMKw
Facebook page: https://www.facebook.com/DanieleCinematicEpicMusic
Special Effect by:
AA VFX: https://www.youtube.com/c/dvdangor2011/
6
views
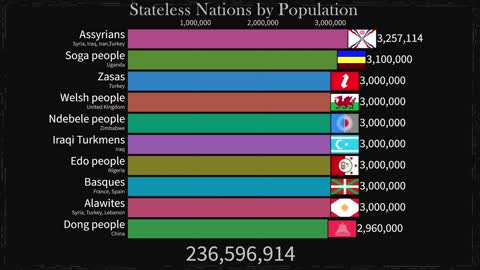
Stateless Nations by Population
This bar chart shows stateless nations by estimated populations.
A stateless nation is an ethnic group or nation that does not possess its own state and is not the majority population in any nation state.
"Stateless" does not mean the group are not citizens of any other nation state, but implies that the group itself "should have" such a state (country).
Numbers and claims can be disputed, and the numbers does not mean all people within a group want or claim such a state. Numbers are based on the size of ethnic groups, ethnical speakers or the number of people living within the geographical area (which can also be multi-ethnic and/or within several existing countries).
Music:
1. Miguel Johnson - Jump Scan Scoop Jump
is under a Creative Commons (CC BY-NC 3.0) license
https://soundcloud.com/migueljohnsonmjmusic/jump-scan-scoop-jump
2. Miguel Johnson - No Turning Back
is under a Creative Commons license (CC BY 3.0) https://creativecommons.org/licenses/by-nc/3.0/
https://soundcloud.com/migueljohnsonmjmusic/no-turning-back
Special Effect by:
AA VFX: https://www.youtube.com/c/dvdangor2011/
13
views
💉 COVID-19 Fully Vaccinated by Country and World 02.19.2022
This bar chart race shows the number of people and the share of population that are fully vaccinated by country/territory until the 19th of February 2022.
Numbers are shown as dates reported and interpolated.
"Fully vaccinated" represents here the total and share of population that have received all doses prescribed by the vaccination protocol.
Music:
Whitesand - Imperfections
https://www.youtube.com/watch?v=pRfTMeJbg4M
https://whitesand.bandcamp.com/
https://open.spotify.com/artist/3GXunV3wsCpSdKp0L5tcNH
Special Effect by:
AA VFX: https://www.youtube.com/c/dvdangor2011/
7
views
1
comment
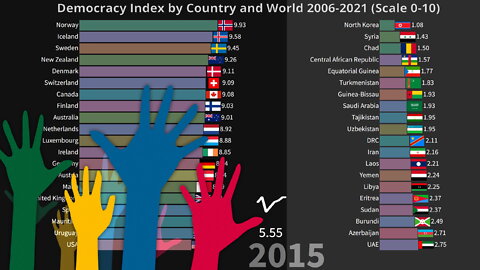
Democracy Index 2006-2021 by Country and World
This bar chart race shows the Democracy Index 2006 to 2021 by country and world (country average), best and worst scores.
The is scale is 0-10, where
8.01–10 = Full democracies
6.01–8 = Flawed democracies
4.01–6 = Hybrid regimes
0–4 = Authoritarian regimes
Source:
Economist Intelligence Unit (EIU)
Music:
Punch Deck - Longing
https://www.youtube.com/c/PunchDeck
https://open.spotify.com/artist/7kdduxAVaFnbHJyNxl7FWV
https://punchdeck.bandcamp.com/
https://soundcloud.com/punch-deck
https://www.instagram.com/punchdeckofficial/
https://twitter.com/punch_deck/
Special background effect by:
AA VFX: https://www.youtube.com/c/dvdangor2011/
4
views
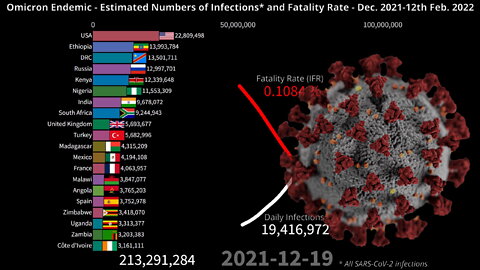
Omicron Endemic True Number of Infections and Fatality Rate
This bar chart race shows the estimated accumulated number of SARS-CoV-2 infections by country, world daily number of infections and infection fatality rate (IFR), during the omicron surge from 1st December 2021 to 12th February.
All SARS-CoV-2 variants are included in the numbers to illustrate how the number of infections and fatality rate changes over the time period when omicron become the dominant variant.
Estimates of infections recent week are extrapolated projections.
Please note that;
Cases are not the same as infections. Cases are confirmed numbers, while infections are estimated numbers. Case Fatality Rate (CFR) is calculated as deaths in percentage of confirmed cases, while Infection Fatality Rate (IFR) is calculated as deaths in percentage of estimated cases.
A person infected with previous variants (like Delta) could be reinfected with omicron. Number of infections are not the same persons who have been infected.
Sources:
Institute for Health Metrics and Evaluation (IHME), European Centre for Disease Prevention and Control (ECDC) and John Hopkins University (CSSE)
Music:
Omega by Scott Buckley – www.scottbuckley.com.au
Special background effect by:
AA VFX: https://www.youtube.com/c/dvdangor2011/
18
views
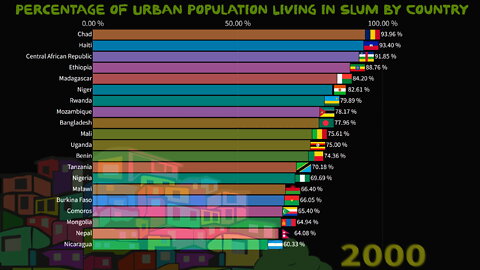
Urban Population Living in Slum by Country
This bar chart race shows the percentage of urban population living in slum, by country 1990 to 2018.
Population living in slums is the proportion of the urban population living in slum households.
A slum household is defined as a group of individuals living under the same roof lacking one or more of the following conditions: access to improved water, access to improved sanitation, sufficient living area, housing durability, and security of tenure.
Source:
United Nations Human Settlements Programme (UN-HABITAT)
Music:
Punch Deck - Under the Stars
https://www.youtube.com/c/PunchDeck
https://open.spotify.com/artist/7kdduxAVaFnbHJyNxl7FWV
https://punchdeck.bandcamp.com/
https://soundcloud.com/punch-deck
https://www.instagram.com/punchdeckofficial/
https://twitter.com/punch_deck/
Special background effect by:
AA VFX: https://www.youtube.com/c/dvdangor2011/
8
views
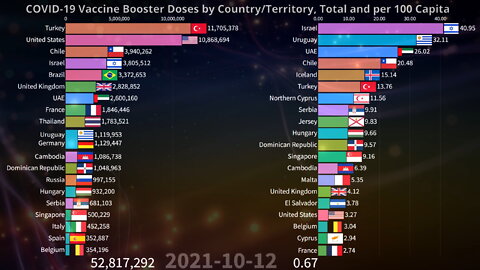
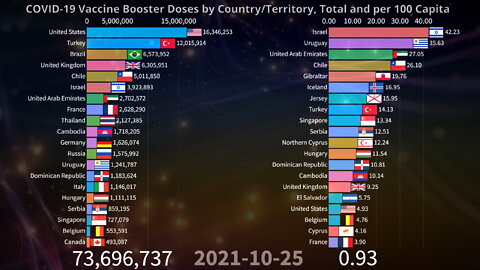
💉 COVID-19 Vaccine BOOSTER Doses by Country and World | Total and Share of Population 02.09.2021
This bar chart race shows the number of vaccination booster doses administered by country and world, per 100 capita, until February 9th of 2022.
Booster doses are doses administered beyond those prescribed by the original vaccination protocol. Third dose of Pfizer/BioNTech vaccine, second dose of Johnson & Johnson vaccine etc.
Numbers are shown as their dates reported and interpolated. Timeline before July 2021 is shown as monthly.
Music:
Titan by Scott Buckley – www.scottbuckley.com.au
Special background effect by:
AA VFX: https://www.youtube.com/c/dvdangor2011/
20
views
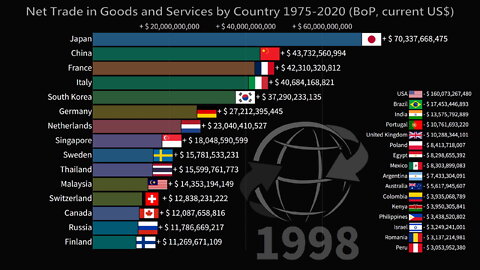
💲 Net Trade in Goods and Services by Country 1975-2020 | Balance of Payments
This bar chart race shows the annual net trade in goods and services by country from 1975 to 2020, balance of payments (BoP), current US dollars.
Net trade in goods and services is derived by offsetting imports of goods and services against exports of goods and services.
Exports and imports of goods and services comprise all transactions involving a change of ownership of goods and services between residents of one country and the rest of the world.
Source:
International Monetary Fund (IMF)
Music:
Track: Bliss Of Heaven — SOMM [Audio Library Release]
Music provided by Audio Library Plus
Watch: https://youtu.be/JQ6mKeQLZak
Free Download / Stream: https://alplus.io/blisss-heaven
Special Effect by:
AA VFX: https://www.youtube.com/c/dvdangor2011/
7
views