EasyLanguage quick-tip 82 | 'selecting' bars using a drawing tool
1 year ago
19
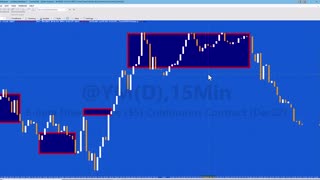
TradeStation EasyLanguage Quick-tip 82 uses a paint bar study to detect when the user has drawn a rectangle on the chart to 'select' bars. It plots the consecutive bars indicated by the rectangle and calculates the high and low values of the range. These values are added to the chart as text objects.
The quick-tip uses the same technique used in tutorial 188 to select bars. This quick-tip does not do the volume analysis.
Loading comments...
-
 12:30
12:30
Markplex
1 year agoEasyLanguage Tutorial 185 | Changing the TradeStation DataTip when hovering over drawing objects
11 -
 7:04
7:04
Markplex
2 years agoQuick-tip 58 | Drawing object tactics
25 -
 1:55
1:55
Mark's Excel Tips
7 months ago10 Tips For Excel Charts Tip # 1 Press ALT+F1 to quickly make a chart
14 -
 0:14
0:14
artdrawings
1 year agoQuick easy drawing tutorial
7 -
 1:22
1:22
Mark's Excel Tips
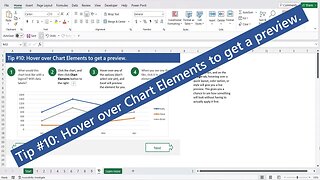
7 months ago10 Tips For Excel Charts Tip # 10 Hover over Chart Elements to get a preview
6 -
 1:44
1:44
Mark's Excel Tips
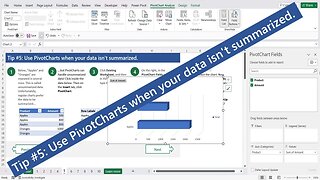
7 months ago10 Tips For Excel Charts Tip # 5 Use PivotCharts when your data isn't summarized
7 -
 1:17
1:17
Mark's Excel Tips
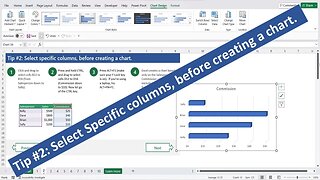
7 months ago10 Tips For Excel Charts Tip # 2 Select specific columns, before creating a chart
5 -
 1:40
1:40
Mark's Excel Tips
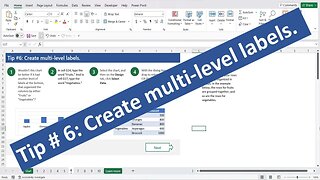
7 months ago10 Tips For Excel Charts Tip # 6 Create multi level labels
3 -
 1:06
1:06
Mark's Excel Tips
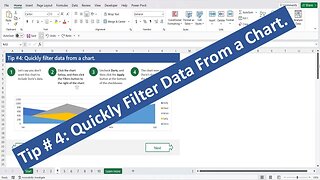
7 months ago10 Tips For Excel Charts Tip # 4 Quickly filter data from a chart
7 -
 2:06
2:06
churchill
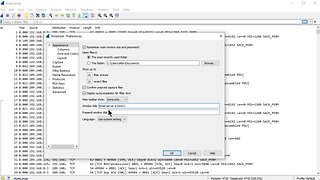
1 year agoClass - Wireshark Title Bar Tip
9