Golden Cross Indicator Strategy (+Backtest)
Welcome to our video on the Golden Cross indicator strategy. In this video, we will explain what a Golden Cross is and how to use it to trade in the stock market.
A Golden Cross is a chart pattern that occurs when a short-term moving average crosses above a long-term moving average. Typically, traders use the 50-day moving average as the short-term moving average and the 200-day moving average as the long-term moving average. However, you can use any type of moving average, and a backtest will determine its effectiveness.
The Golden Cross strategy aims to take advantage of the long-term upward trend in the stock market while minimizing drawdowns during bear markets. It is prone to whipsaw signals, but the few big winners compensate for any losses.
To follow the Golden Cross strategy, you buy when the 50-day moving average crosses above the 200-day moving average, indicating a bullish breakout. Conversely, you sell your position when the 50-day moving average crosses below the 200-day moving average, signaling a bearish breakout.
In this video, we will show you an example of a Golden Cross in a chart, where the 50-day moving average breaks above the 200-day moving average. You can see that you would have bought the S&P 500 in July 2020 at 2867 and sold in March 2022 at 4173, yielding a 32.4% gain.
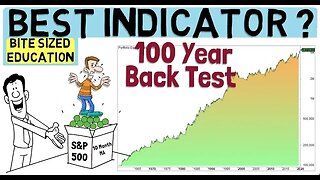
We will also backtest the strategy on the S&P 500 since 1960, where we see that there were only 32 trades. The backtest results show that 78% of the trades were winners, with an average trade gain of 15.4% and an annual return of 6.6%. Although the annual return is slightly lower than the buy and hold return of 6.9%, we must remember that the Golden Cross strategy was invested only 69% of the time. Additionally, the strategy had lower drawdowns, with 33% compared to buy and hold's 56%, giving a risk-adjusted return of 9.5%.
We hope this video helps you understand and use the Golden Cross indicator strategy to make profitable trades in the stock market.
Chapters
0:00 Intro
0:37 What is the Golden Cross?
0:57 Why you should use it
1:18 Trading Rules
1:36 Trade Example
2:00 Performance and Trades
2:16 Backtest Results
2:54 Equity Curve
3:00 Code
3:15 Complementary System
#GoldenCross #StockMarket #TradingStrategy #MovingAverages #BullishBreakout #BearishBreakout #Backtesting #RiskAdjustedReturn #StockInvesting #InvestingTips #InvestingEducation #InvestmentStrategy #StockMarketEducation #TechnicalAnalysis #FinancialEducation #Stocks #Investment #StockMarketAnalysis #StockMarketTips #StockMarketInsights
You can find 200+ trading strategies here:
https://www.quantifiedstrategies.com
TWITTER
https://bit.ly/Twitter_QS
INSTAGRAM
https://bit.ly/Instagram_QS
NEWSLETTER - QUANTIFIED STRATEGIES
30 000+ Traders read our free newsletter about trading strategies.
Sign up: https://bit.ly/substack_QS
-
 0:32
0:32
quantifiedstrategies
3 months agoSupertrend Indicator Strategy (Backtest And Performance)
13 -
 1:41
1:41
quantifiedstrategies
1 year ago $0.02 earnedStairs Strategy (A Trend & Pullback Combo) | +Backtest
2 -
 10:26
10:26
FWisdom
1 year agoBest Trading Indicator To Build A Strategy Upon (100 Year Back Test!)
12 -
 27:13
27:13
victoria2k
1 year agoHow To Back-Test A Proven Forex Strategy - USDCAD
1 -
 11:52
11:52
RazorBaker
1 year agoThe Only ADX Indicator Strategy You Will Ever Need
3 -
 15:42
15:42
DaviddTech Trading Strategies
6 months ago $0.01 earnedWIN with SuperTrend Strategy: Proven Buy-Sell indicator on TradingView
48 -
 6:19
6:19
Trader's Landing
2 years agoReview: “The Most Accurate Buy Sell Signal Indicator - 100% Profitable Trading Strategy"
122 -
 0:59
0:59
Bhfior
1 year agoBack Test Your Trading Strategy
18 -
 4:58
4:58
DayTradeToWin
2 years agoVictory Trading Day - Compare Your Setups and Signals
8 -
 0:58
0:58
TradeWithUFOs Channel
2 years agoBacktesting Your Trading Strategy (For beginners & Advanced Traders)
32