Generating Scatterplots to Study the Relationship Between Development and Consumption
1 year ago
17
Socioeconomics is the driving force behind resource consumption. Is it always a zero-sum game? This open-ended activity involves gathering raw data from the CIA Factbook and other sources to generate a wide variety of scatter plots that elucidate this relationship. Whether you are a policy maker or a voter, a deep understanding of these issues will help you discern good strategies for sustainable development from the numerous boondoggles that only serve special interests.
Loading comments...
-
 39:19
39:19
Exploring the future of technology
11 months agoUnveiling the Intricate Relationship Between Economics and Psychology
7 -
 6:39
6:39
Prof. Al Bartlett video collection
1 year agoAl Bartlett on energy consumption versus population
17 -
 19:06
19:06
CarbonPsyops
3 months agoLimits to Growth - Depopulation
1.2K6 -
 10:35
10:35
Retrospectator
10 months agoValue in Economics and Relationships
841 -
 11:54
11:54
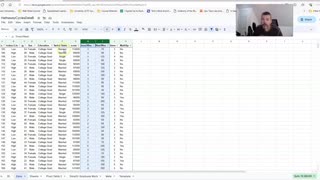
Data Analysis with Google Sheets
6 months agoGoogle Sheet Data Analysis 3: Scatterplots, Regression, and Charts
44 -
 5:43
5:43
freethinkerfreelover
1 year agoClarifying Common Data Analysis Misconceptions Using Global Warming Examples
5 -
 5:06
5:06
Just Facts
6 months agoAnalyzing Studies
9.1K -
 1:59
1:59
The Last Capitalist in Chicago
1 year agoAnalysis of India’s Population Boom
6 -
 0:57
0:57
The Last Capitalist in Chicago
11 months ago $0.01 earnedOntario has the same per capita GDP as Alabama
301 -
 31:00
31:00
FGP
1 year agoGreen Energy: Analyzing The Data With Andrew Morris Of Texas A&M University
35