Global Sea Surface Currents and Temperature
This visualization shows sea surface current flows. The flows are colored by corresponding sea surface temperature data. This visualization is rendered for display on very high resolution devices like hyperwalls or for print media.
This visualization was produced using model output from the joint MIT/JPL project entitled Estimating the Circulation and Climate of the Ocean, Phase II (ECCO2). ECCO2 uses the MIT general circulation model (MITgcm) to synthesize satellite and in-situ data of the global ocean and sea-ice at resolutions that begin to resolve ocean eddies and other narrow current systems, which transport heat and carbon in the oceans. The ECCO2 model simulates ocean flows at all depths, but only surface flows are used in this visualization.
Global sea surface currents colored by temperature. These are the assembled (contiguous) versions of the animation. There are several resolutions to choose from, some are cropped for various purposes. The 6840x3420 version is the complete, full resolution visualization at the appropriate 2x1 aspect ratio and has not been cropped or resized. The time range for these visualizations is from 2007-03-25T12:00Z to 2008-03-03T12:00Z.
-
 1:28
1:28
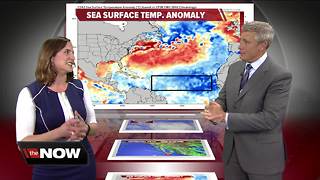
WTMJMilwaukee
5 years agoGeeking Out: Sea surface temperatures
-
 23:11
23:11
The Official Corbett Report Rumble Channel
1 year agoWhat Is The Average Global Temperature?
67 -
 3:27
3:27
Mark D Sanchez
3 years agoSalt and Ocean temp.
15 -
 3:13
3:13
SmokeyHardwick
1 year agoScientists Horrified as Sea Surface Temperatures Spike Off the Charts
4 -
 0:37
0:37
Safabob
2 years agoSummer Sea Ocean water
48 -
 0:39
0:39
Rmarxfacs
4 months agoThe Current Rate of Global Warming
3 -
 2:04
2:04
KGTV
3 years agoRecord ocean temperatures bring humans, sea-life to coast
15 -
 0:44
0:44
MicroSight
6 months ago12/06/23 - Oceanic Weather Modification
1241 -
 2:08
2:08
Azuritian Music
5 months agoSwaying in the Current | 4 | Ocean Bits
8 -
 16:52
16:52
Geodiode - Exploring Our World Through Video
5 years agoThe Oceanic Climate - Secrets of World Climate #7
32