TI SCAN [ IMPLANTS • TEMPERATURE • FREQUENCIES ]
Source Link:
https://www.tiktok.com/@lisa_ranel
• Excerpt from the Scan Report:
Graph 1
After intense review of all signals captured on the full spectrum analyzer during Lisa scan we found the following signals. They are shown in detail on the following graph.
The following graph shows the signal at 680 MHz. That we captured during the scan of Lisa on August 18 2023.
All signals shown are baseline and normal for the area except the signal shown in red. The red signal at 680 MHz with a magnitude 18 dBm is only present during the P/N junction scan of Lisa. This UHF (Ultra High Frequency) band is designated as a EU, NATO, and US L-band used for military telemetry and GPS.
Graph 2
After intense review of all signals captured on the full spectrum analyzer during Lisa scan we found the following signals. They are shown in detail on the following graph.
The following graph shows the signal at 682 MHz. That we captured during the scan of Lisa on August 18 2023.
All signals shown are baseline and normal for the area except the signal shown in red. The red signal at 682 MHz with a magnitude 18 dBm is only present during the P/N junction scan of Lisa. This UHF (Ultra High Frequency) band is designated as a EU, NATO, and US L-band used for military telemetry and GPS.
Song: ANGELPLAYA - PULL UP [NCS Release]
Music provided by NoCopyrightSounds
Free Download/Stream: http://ncs.io/PULLUP Watch: http://youtu.be/
-
 18:45
18:45
Finding implants
3 months ago35. using a bug detector to scan for wireless frequencies from biomedical implants
27 -
 7:57
7:57
KMXDEFENDERS
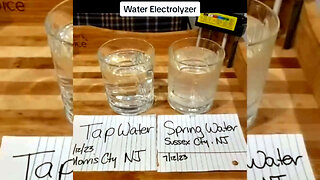
3 months agoELECTROLYZER TEST • TAP WATER
39 -
 1:07:12
Chloe Hudson
4 months ago $0.02 earnedHow To Outsmart a Stalker/Gangstalker.
581 -
 2:31
2:31
Prife iTeraCare Devices For In Home Therapy
2 months agoiTeraCare 2 Year Testimony Using Prife TeraHertz Devices to Reduce Inflammation Pain
99 -
 8:48
8:48
ETHEREAL Frequency
3 months agoETHEREAL Frequency - Divine Indifference
15 -
 1:00:00
DreamySoundwaves: Wellness & Inner Harmony
3 months ago417 Hz Pure Tone | Transform Your Life with the Power of Solfeggio Frequencies
161 -
 7:45
7:45
ETHEREAL Frequency
3 months agoETHEREAL Frequency - The Gift Given
14 -
 15:47
15:47
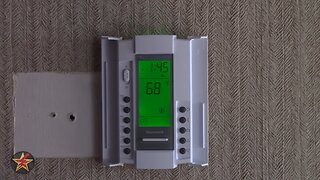
Wanderer001 Reviews
8 months agoHONEYWELL TL8230A1003 Electric Heat Digital Termostat Review
28 -
 1:21:14
Climate Realism
1 month agoU.S. Surface Temperature Measurements Redux: Still Not Fit for Purpose
1.08K4 -
 1:00:00
Elevated Nature Sounds
7 months agoPure Schumann Resonance 7.83 Hz Earth's Heartbeat
2.75K2