The Signal Returns
🟢 TRADE IDEAS & DISCORD: https://www.patreon.com/figuringoutmoney
🟢 TRADE WITH IBKR: http://bit.ly/3mIUUfC
__________________________________________________________________________________________
In this video, Michael Silva delves into the current state of the stock market, highlighting key signals and patterns that have emerged. He begins by referencing a recurring signal that has shown up during significant market moments, such as the October bottom and March 15th. The main focus of the video is on the stock market brief, with an emphasis on the S&P 500 and its confluence points.
Michael provides a snapshot of various market products, discussing the 10-year yield, the dollar, and Bitcoin. He points out that when these elements move in tandem, it often indicates problems in the overall market. The video also touches on the IWN's negative territory, the S&P 500's equal weight, and the influence of mega cap stocks.
The discussion then shifts to the 10-year yield, which has hit a new high for 2023. Michael draws attention to the parabolic trend of the yield and its potential implications. He also examines the 10-year two-year curve and the 10-year three-month curve, noting their impact on the market.
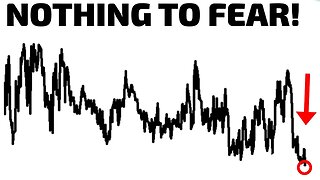
The video further explores the fear and greed index, which has been at extreme levels, and its historical significance in the market. Michael emphasizes the importance of understanding the confluence of various market indicators, such as the weekly expected move, the 200-day moving average, and the gamma exposure level.
Towards the end, Michael provides insights into potential market movements, suggesting that the current downward trend could be a bear trap. He advises viewers to be patient and tactical, keeping an eye on key market levels.
In summary, this video offers a comprehensive analysis of the stock market's current state, highlighting potential risks and opportunities. Michael Silva provides viewers with valuable insights and strategies to navigate the market effectively.
🔔 Subscribe now and never miss an update: https://www.youtube.com/c/figuringoutmoney?sub_confirmation=1
📧 For business inquiries or collaboration opportunities, please contact us at FiguringOutMoney@gmail.com
📈 Follow us on social media for more insights and updates:
🟢 Instagram: https://www.instagram.com/figuringoutmoney
🟢 Twitter: https://twitter.com/mikepsilva
______________________________________________________________________________________________
How To Predict How Far Stocks Can Go (EXPECTED MOVES):
○ https://youtu.be/JT32L89ZpEk
Saylor To Schiff Bitcoin Indicator:
○ https://youtu.be/zuG9Tjnud9k
Show Me The Money Scan:
○ https://youtu.be/dzRjEuUUb5g
Party Starter Scan:
○ https://youtu.be/zzaN91gcJOI
Bouncy Ball Scan:
○ https://youtu.be/7xKOo6vNaq8
Dark Money Scan:
○ https://youtu.be/ZUMuHaSg1ro
Sleepy Monster Scan:
○ https://youtu.be/C9EQkA7uVU8
High Volatility Scan:
○ https://youtu.be/VC327ko8DfE
______________________________________________________________________________________________
DISCLAIMER: I am not a professional investment advisor, nor do I claim to be. All my videos are for entertainment and educational purposes only. This is not trading advice. I am wrong all the time. Everything you watch on my channel is my opinion. Links included in this description might be affiliate links. If you purchase a product or service with the links that I provide I may receive a small commission. There is no additional charge to you! Thank you for supporting my channel :)
#Stockmarket #StockMarketAnalysis #DayTrading
-
 23:55
23:55
Figuring Out Money
5 months agoWeird Things Are Happening Right Now
19 -
![[D2] Onslaught Grind w/ Some PvP before Final Shape](https://hugh.cdn.rumble.cloud/s/fw/s8/1/5/g/l/6/5gl6r.0kob-small-D2-Onslaught-Grind-w-Some-P.jpg) 6:28:15
6:28:15
CHiLi XDD
9 hours ago[D2] Onslaught Grind w/ Some PvP before Final Shape
28.5K9 -
 2:45
2:45
Chicks in the Office
7 hours agoHolly Madison Talks Reconciliation with Kendra Wilkinson
40.7K30 -
 LIVE
LIVE
Di bear
9 hours agoFinal Season Mission, Pantheon | Destiny 2
485 watching -
 6:54:43
SquallRush
11 hours agoAthenian Rhapsody!
41.8K7 -
 1:47:01
Real Coffee With Scott Adams
9 hours agoEpisode 2492 CWSA 06/01/24
54.8K51 -
 2:08:10
LFA TV
10 hours agoEP 47: Miles Guo Trial Special with Special Guests - Truth, Betrayal, and Fox Hunt | WHISTLE BLOWERS 6.01.24 12pm EST
48.3K14 -
 1:13:59
Tactical Advisor
8 hours agoVault Room Tour/Unboxing- Vault Room Live Stream
49.1K3 -
 1:11:28
The Squad
14 hours agoArsenal's Huge Summer🚨Olise to Man Utd DEAL✅ Osimhen to Arsenal or Chelsea☑️ UCL Final Preview
60.4K10 -
 56:23
56:23
Trumpet Daily
1 day ago $1.10 earnedCohen Is Free to Lie and Steal, but Trump Is Guilty of Something - Trumpet Daily | May 31, 2024
45.5K58