Distance Time Graph - Linear Relations - IntoMath
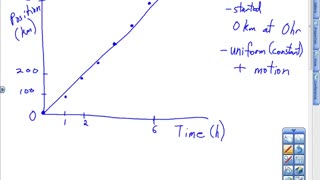
In this lesson you will learn about linear relations and what they mean. One of the most common examples of a linear relation is the relationship between distance and time when a distance changes over time at a constant rate.
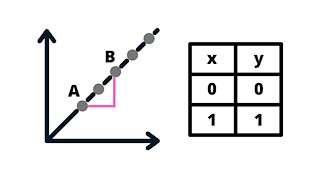
A linear relation is represented by a straight-line – a relationship between a variable and a constant. Linear relations can be expressed in 4 different ways: a graph, a table of values, a word description and an equation.
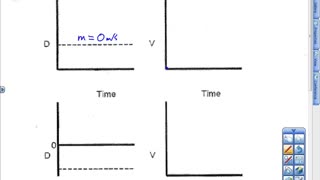
In this lesson we will compare two objects moving and discuss the relationship between distance, time and speed while comparing the graphs representing the motion patterns of the two objects.
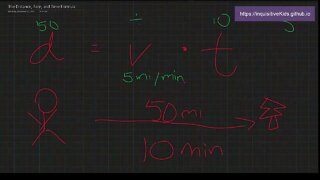
You will learn why the equation D = vt (or D = st) is a direct proportion and how knowing the time and speed one can determine the distance traveled.
Watch the video lesson, complete the note and additional practice in order to improve your understanding of the concept.
More free math games and activities: intomath.org
-
 7:54
7:54
IntoMath Grade 9 Lessons
3 years ago $0.16 earnedLinear Function - Slope of a line - IntoMath
6271 -
 10:32
10:32
16mm Educational Films
3 months ago $0.01 earnedGraphing Linear Equations - Algebra 1
22 -
 3:35
3:35
PhysicsExplainedWell
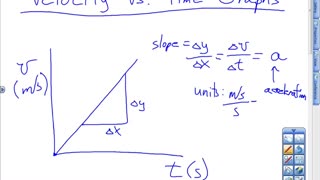
3 years agoVelocity vs Time Graphs Lesson
56 -
 16:10
16:10
Mr. Antonucci Math
3 years agoWhat's the Difference Between Position, Displacement, and Total Distance Traveled??? Explained!!!
211 -
 5:49
5:49
Three Inquisitive Kids
2 years agoPre-Algebra - The Distance, Speed, and Time Formula
1 -
 5:39
5:39
PhysicsExplainedWell
3 years agoGraphs Comparison Lesson
86 -
 11:32
11:32
PhysicsExplainedWell
3 years agoPosition vs Time Graphs Lesson
131 -
 6:59
6:59
Minute Math
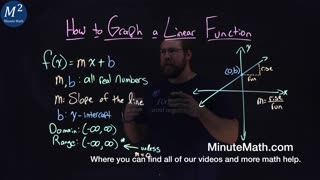
2 years agoHow to Graph a Linear Function | y=mx+b | Minute Math
21 -
 10:22
10:22
Leveling Up Math Skills with Basic | Caveman Chang
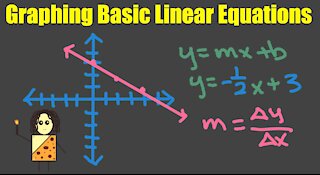
2 years agoGraphing Basic Linear Equations
134 -
 14:50
14:50
Math Easy Solutions
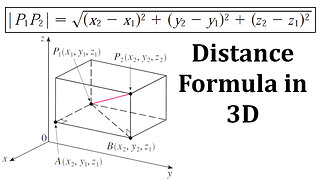
1 year agoDistance Formula in 2D and 3D and Their Proofs
651