Candlestick Charts and Technical Studies Using Python and mplfinance
3 years ago
28
We use Matplotlib and Mplfinance to make some candlestick charts and add some technical studies, in this case, moving averages. We also show how to calculate moving averages in Pandas.
This is a simple, quick video. Hopefully if you're into charting and technical analysis (I’m not) this will point you in a potential direction for coding up your own stuff.
mplfinance: https://github.com/matplotlib/mplfinance
Github: https://github.com/kpmooney/numerical_methods_youtube/tree/master/market_analysis
Tip Jar: https://paypal.me/kpmooney
Loading comments...
-
 18:49
18:49
Ascencore
5 months agoExplaining Candlestick Charting Patterns With A Practice Case Study With MDLZ Stock Chart
14 -
 2:51
2:51
Ascencore
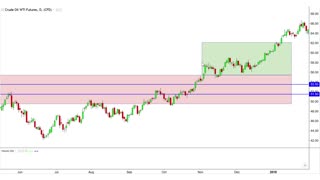
5 months agoCandlestick Charting Pattern (Practice Case Study) Crude Oil Futures Chart
15 -
 5:27
5:27
Ascencore
6 months agoThe Basics Of How To Read Candlestick Patterns On Charts
14 -
 10:28
10:28
Ascencore
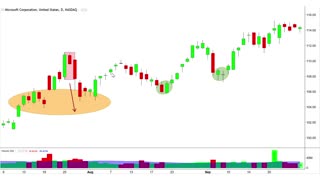
6 months agoHarami (Candlestick Charting Pattern) Example Case Study With MSFT Stock Chart
12 -
 6:17
6:17
Ascencore
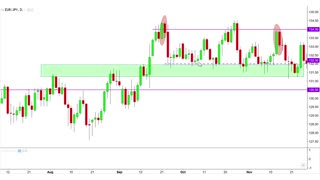
6 months agoEasy Candlestick Charting Pattern Analysis: (Harami) Example Case Study With EURJPY Chart
5 -
 1:06
1:06
Ascencore
5 months agoCandlestick Charting Patterns: Tips And Practice Project
25 -
 3:51
3:51
Ascencore
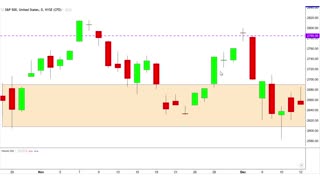
5 months agoPractice Candlestick Charting With A Case Study Of The SPX Chart
20 -
 2:56
2:56
Ascencore
5 months agoLearn To Analyze Candlestick Charts By Combining Multiple Candles: Example Case Study QQQ Nasdaq ETF
10 -
 0:35
0:35
Ascencore
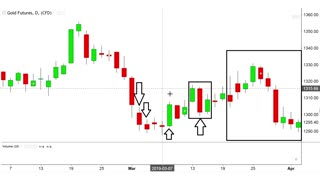
6 months agoCandlestick Charting Patterns Analysis With The Spinning Top Candles Example Case Study Gold Futures
15 -
 9:40
9:40
Ascencore
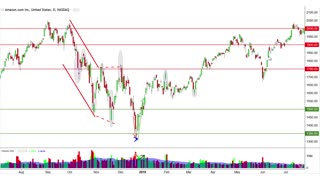
5 months agoAn Example Of Candlestick Charting Analysis With AMZN Stock Chart
17