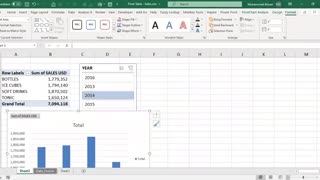
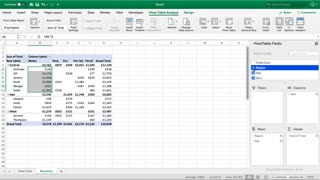
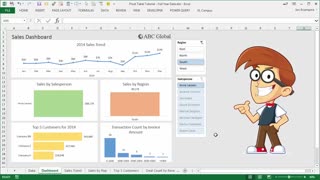
Microsoft Excel Tutorial - Pivot Charts
Loading comments...
-
 17:34
17:34
TECHNOLOGY, TIPS AND TRICK VIDEOS
9 months agoPivot Tables in Excel Tutorials for Beginners
5 -
 47:44
47:44
RahimZulfiqarAli
1 year agoAdvanced Pivot Table Tips and Tricks in Microsoft Excel
7 -
 5:02
5:02
user329
3 years agoPIVOT FUNCTION
18 -
 8:01
8:01
howtosimonexplains
1 year agoPivot Table Excel | Beginner Tutorial
-
 8:13
8:13
Subjectmoney.com
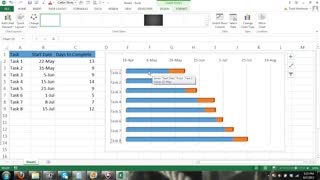
3 years agoMicrosoft Excel Gantt Chart Tutorial - How to Create a Gantt Chart w/Excel 2013 Bar Chart
78 -
 11:27
11:27
ayubmkhan
3 years agoLearn Pivot Tables in under 10 Minutes
25 -
 14:47
14:47
humulica
1 year agoIntroduction to Pivot Tables, Charts, and Dashboards
4 -
 6:21
6:21
PoohLeak
2 years ago $0.01 earnedMicrosoft Excel Pivot Table in Under 5 Minutes
39 -
 1:44
1:44
Mark's Excel Tips
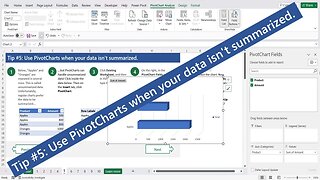
7 months ago10 Tips For Excel Charts Tip # 5 Use PivotCharts when your data isn't summarized
7 -
 6:27
6:27
Mahogany Lore
5 months agoVisualizing Data for Libraries: Part 5 - Line Chart
2