S&P 500 P/E Ratio Valuation Update August 1, 2021
My Exclusive Free Workshop The Four P's of Building a Successful Investing Program → https://spxinvesting.mailchimpsites.com
Blog: https://spxinvestingblog.com
https://www.facebook.com/groups/433843641082343
Is the Stock Market Getting Ready to Crash? Video: https://youtu.be/F4VUuOBy4mc
Yardeni Website: https://www.yardeni.com/
What are The S&P 500 Sectors? Video: https://youtu.be/K0PEW4q-vLM
What are Industry Groups? Video: https://youtu.be/9bBOX9qTbow
Three Building Blocks for Developing a Successful Investment Program Video: https://youtu.be/2kLnCqkwang
Robert Shiller PE Ratio: https://www.multpl.com/shiller-pe
P/E Ratio Valuation Update
August 1, 2021
Bulls, Bears, and the Clueless
People who have an opinion about the Stock Market usually fall in to one of 3 categories:
1. Bulls (up)
2. Bears (down)
3. Clueless
Bulls
For the most part, the stock market usually goes up.
People who are positive about the future are bullish.
Bears
There are times when the stock market can have extended declines.
Those who are negative about the future of the stock market are called Bears.
How Earnings are Reported
Earnings are the fundamental core of what makes a companies more valuable or less valuable.
Publicly traded companies use GAAP to report earnings.
Generally Accepted Accounting Principles (GAAP).
GAAP requires the accrual accounting method, which recognizes costs and expenses when they occur rather than when actual cash is received or paid out.
The matching principle of accrual accounting requires that companies match expenses with revenue recognition, recording both at the same time.
Earnings Impact
Many investors buy or sell stocks as earnings go up and down in a company.
However, sometimes there can be a large and extended disconnect between earnings and stock prices.
It can take months, or even years for earnings to come inline with stock prices.
When these measurements are far apart, something will need to change. But this can take time.
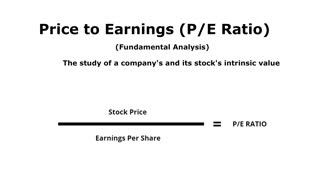
Price/Earnings Ratio
One thing investors watch is whether stocks are considered expensive or cheap.
Typically, investors will want to buy stocks that are considered cheap and sell stocks that are considered expensive.
A stock with a high P/E Ratio is considered expensive.
A stock with a low P/E Ratio is considered inexpensive or cheap.
Other investors use the P/E Ratio as a measurement of supply and demand.
When investors are buying a stock and the price goes up, this often shows an increase in demand.
When investors are selling a stock and the price goes down, this often shows an decrease in demand, or an increase in supply.
Price/Earnings Ratio Calculation
The P/E Ratio changes everyday and is marked to the market by using the closing price for calculation.
The current price is divided by the annual earnings that have already been report.
The Trailing Twelve Months (TTM) based on GAAP earnings reports is what is used.
The Multiples Approach
Examples:
If a stock or index has a current P/E Ratio of 10, that means an investor is willing to pay $10 per share for $1 per share of earnings.
If the current P/E Ratio is 20, that means an investor is willing to pay $20 for $1 of earnings.
Earnings
Earnings can be:
TTM = Trailing Twelve Months. This is history, but it is real.
Forward Earnings Estimates = What is expected in the future, but it is a forecast or guess.
Some prefer to use TTM while the markets focus on forward estimates.
For this discussion, TTM will be used.
For a chart of forward estimates, please go to Yardeni.com
Comparisons
The P/E Ratio is compared to other stocks and indexes.
Comparisons can be made:
Between similar companies
Within an Industry Group
Within a Sector
Within an index such as the S&P 500.
For this discussion, only the S&P 500 (SPX) will be analyzed.
The Multiple
The P/E Ratio may often be referred to as “The Multiple”.
Stock prices will usually be priced at a multiple of the P/E Ratio.
Stocks are usually measured according to 3 multiples:
10 times earnings = cheap
15 times earnings = fair
20 times earnings = expensive
Adjustments to Reach Historical Norms
Forward P/E Ratio
The forward P/E Ratio reported in the Wall Street Journal on July 30, 2021 is 33.75.
Conclusion
The S&P 500 is overvalued and has been since 2019.
Extreme overvaluation has persisted and grown since the beginning of the COVID-19 pandemic outbreak.
Stocks and indexes can remain valued at current levels for lengthy time periods.
Other indicators should be consulted to observe signs of weakness and a possible change in trend. In this case, the trend change from up to down.
Regardless of conditions, price must be respected and followed.
The massive amounts of liquidity and stimulus that has been pumped into the economy has helped keep prices moving higher.
-
 18:27
18:27
The SPX Investing Program
2 years ago $0.20 earnedMarket Valuation Series Part 2: Shiller PE Ratio
247 -
 46:57
46:57
The SPX Investing Program
11 months agoS&P 500 Market Update For the Week of June 12-16, 2023
35 -
 4:40
4:40
LumleyTrading
1 year ago$PLTR Stock Analysis - Palantir Price Targets & Technical Analysis
35 -
 11:24
11:24
AV
8 months ago#192 Price-Earnings Ratio
25 -
 8:18
8:18
LumleyTrading
1 year ago$PLTR Stock Analysis - Palantir WILL FALL FROM HERE
18 -
 17:17
17:17
We Profit with Stock Curry
1 year agoStock Market Prediction 2023 - FOMC Meeting & Earnings
193 -
 6:28
6:28
SniperTrader
1 month agoMarket Awaits CPI Inflation Data
24 -
 0:20
0:20
The Success Academy
2 years agoHow to Trade the Price to Earnings P/E Ratio
8 -
 7:06
7:06
Bullish Bounce
4 months agoAre Alibaba & Paypal Stock Value Traps?
26 -
 6:59
6:59
Ticker Time News
1 year agoApplied Materials Q4 Earnings Surprise Explained | AMAT Stock Analysis
3