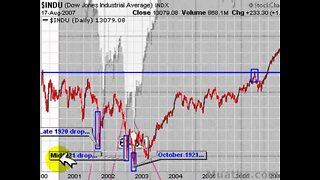
DOW 25,000 By 2011 - Part 8 of 10
Elliott Wave analysts (or "Elliotticians") may not need to look at a price chart to judge where a market is in its wave pattern. Each wave has its own "signature" which often reflects the psychology of the moment. Understanding how and why the waves develop is the key to applying the Wave Principle; that understanding includes recognizing the characteristics described below.[2]
These wave characteristics assume a bull market in equities. The characteristics apply in reverse in bear markets.
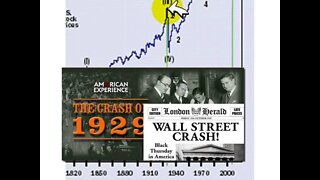
Grand supercycle: multi-decade to multi-century
Supercycle: a few years to a few decades
Cycle: one year to a few years
Primary: a few months to a couple of years
Intermediate: weeks to months
Minor: weeks
Minute: days
Minuette: hours
Subminuette: minutes
ABIX, ACCL, APLX, ATSI, BIOF, CHNR, CPWM, CRDC, DATA, FSTR, GCBC, GENR, INSW, INXIW, JRJC, PINN, REFR, SLXP, SPIR, TPTX, TSCC, UBCP, VIRC, WBPRN, WINN, ANV, AXK, BKR, BYW-WT, BZI, DCU, DDD, EAD, ETC, HDS-WT, HWK, IMM, IRN, IVA, PLG, PLX, PNS, SRS, SVA, THK, TKO, TTG, UPI, WSB, YMI, APU, CAE, CFI, CHP, COA, CXO, DEP, DRL, DVR, EJ, ENT, EXM, FLO, FRX, GNK, JQC, MDG, MZ, NCV, OII, PIR, TPX, VC, WPL, WTI
-
 8:46
8:46
Muathe.com
2 years agoDOW 25,000 By 2011 - Part 3 of 10
89 -
 7:43
7:43
Muathe.com
2 years agoDOW 25,000 By 2011 - Part 2 of X
1 -
 3:07
3:07
decentralisednews
2 years agoThe Dow Theory (Explained Simply)
3 -
 0:32
0:32
FinancialFitnessTV
11 months agoDow Jones
9 -
 7:26
7:26
FWisdom
1 year agoDOW THEORY - What is it & how can it be applied to the stock market?
121 -
 0:53
0:53
ChartAction
3 years agoDogecoin Target Almost HIT DOGE #shorts
231 -
 25:30
25:30
DailyCryptoElisList
9 months agoBTC Wedge Bull Break
17 -
 10:48
10:48
Figuring Out Money
3 years agoSP500 WOLF IN SHEEP'S CLOTHING APPEARS AT END OF TRADING DAY | S&P 500 Technical Analysis
1 -
 16:04
16:04
TradeWithUFOs Channel
2 years agoAutoUFOs SHARPENING (Becky Hayman) 2021 Aug-7 (Part 2)
2 -
 10:50
10:50
Stewdamus' Technical Analysis
2 years agoDOW Drops almost 1000 points! How did BTC fair?
3