

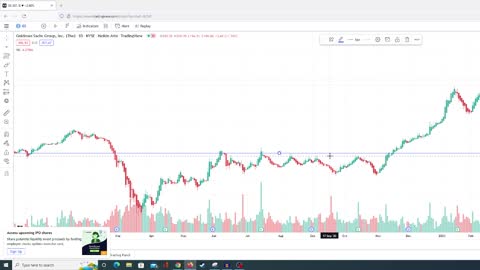
Stage Analysis Strategy (How to Choose WINNERS!)
Find Your WINNING STRATEGY for Trading With These Technical Analysis SECRETS
https://successacademycourses.com/sp/landing-page-2/
Stan Weinstein's Book: https://amzn.to/3MKdBbE
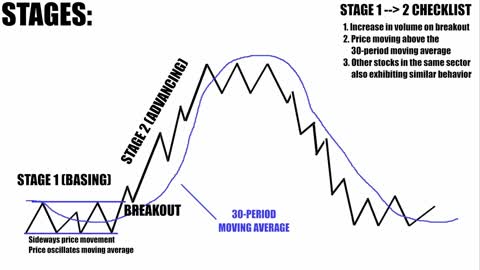
So, Stage Analysis and Stan Weinstein became famous after he predicted the Black Monday crash on October 19th, 1987. Traders who use the Stage Analysis strategy can identify significant phases of a stock’s lifecycle. It is a long-term investing strategy and is often used on a weekly chart.
There are four stages of Stage Analysis. Stage Analysis also has the concept of support and resistance, breakouts, and other technical analysis techniques.
As an Amazon Associate I earn from qualifying purchases.
22
views
STRAT Method Consolidation Strategy (INSIDE BAR EXPLOSIONS)
The Ultimate Technical Analysis Course
https://successacademycourses.com/sp/landing-page/
USE CODE: "LVLUP" FOR 30% OFF!
The STRAT Method - EXACTLY How to Trade
https://rumble.com/v1kum7v-the-strat-method-exactly-how-to-trade.html
theSTRAT Method Gap Trading Introduction
https://rumble.com/v1nezu4-thestrat-method-gap-trading-introduction.html
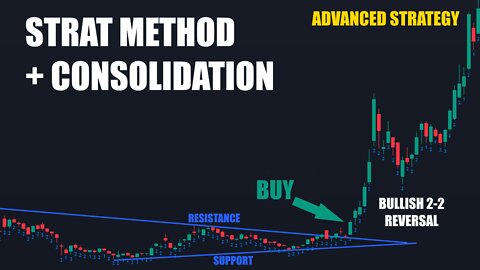
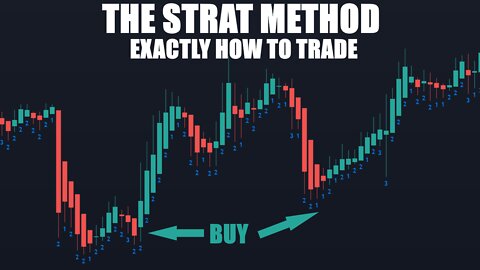
The STRAT method is possibly one of the most interesting stock market strategies there is. The STRAT method, developed by Rob Smith, is a price action-based charting strategy that analyzes individual candles and how they relate to each other, how they conform to levels of support and resistance, and how they can be traded with other time frames.
This method aims to remove emotion as much as possible by being objective, which means eliminating market noise and using facts to trade.
Consolidation is when price is getting tighter and tighter, often between lines of support and resistance.
This strategy may be used by day traders.
#thestrat ! !
Some STRAT Method Examples:
https://rumble.com/v1kbwqr-some-strat-method-examples.html
33
views
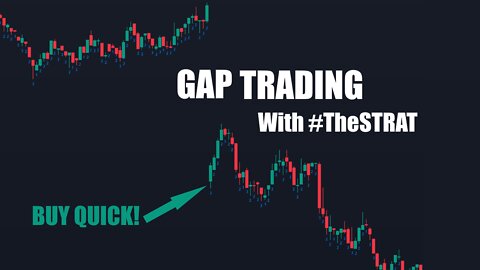
theSTRAT Method Gap Trading Introduction
STRAT Combos Free Cheat Sheet: https://successacademycourses.com/strat-cheat-sheet-sign-up/
Learn More Here: https://successacademycourses.com/what-is-the-strat-method/
USE CODE "SUCCESS"
The Ultimate Technical Analysis Stock Market Course: https://www.udemy.com/course/tsaultimatechartanalysis/?referralCode=B3A9AFA5A79307F392B0
The STRAT Method - EXACTLY How to Trade
https://www.youtube.com/watch?v=qKJVfHJOdXQ&t=1s
The STRAT method is possibly one of the most interesting stock market strategies there is. The STRAT method, developed by Rob Smith, is a price action-based charting strategy that analyzes individual candles and how they relate to each other, how they conform to levels of support and resistance, and how they can be traded with other time frames.
This method aims to remove emotion as much as possible by being objective, which means eliminating market noise and using facts to trade.
This strategy may be used by day traders.
#thestrat ! !
Some STRAT Method Examples: https://www.youtube.com/watch?v=ZIbIoyWK_2U&t=0s
22
views
How to ACTUALLY Use Moving Averages for Stock Trading
https://successacademycourses.com/
Scalping Day Trading – Highly Effective Strategies
https://successacademycourses.com/scalping/
The Ultimate Technical Analysis Stock Market Course:
USE CODE: "SUCCESS" For 75% off!
https://www.udemy.com/course/tsaultimatechartanalysis/learn/?couponCode=SUCCESS
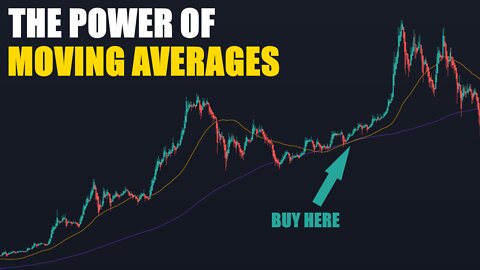
Moving averages are one of the most well-known yet misunderstood technical indicators. Moving averages are generally used to smooth out price data and show the average price, but there are several ways that they can be used for trading.
Moving averages allow traders to employ many strategies, some of which are well-known and some of which are specific.
12
views
How to Read Candlesticks for Beginners (Patterns Included!)
How to Read and Understand Candlesticks
https://successacademycourses.com/how-to-read-and-understand-candlesticks/
The Ultimate Technical Analysis Stock Market Course:
USE CODE: "SUCCESS" For 75% off!
https://www.udemy.com/course/tsaultimatechartanalysis/learn/?couponCode=SUCCESS
Introduction: 0:00-0:09
Disclaimer: 0:09-0:12
What Are Candlesticks? 0:12-0:30
Parts of a Candlestick: 0:30-1:37
Timeframes: 1:37-2:08
Types of Candlesticks: 2:08-2:30
Support and Resistance: 2:30-2:59
Head and Shoulders Pattern: 2:59-3:22
Pipe Tops and Bottoms: 3:22-4:11
Types of Individual Candlesticks: 4:11-4:15
Shooter Candlesticks: 4:15-4:27
Hammer Candlestick 4:27-4:39
Doji Candlestick: 4:39-4:51
Inside Bar Candlestick: 4:51-4:59
Consolidation: 4:59
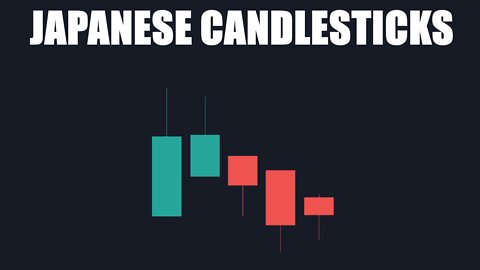
Candlesticks are a Japanese invention thought to be developed by Munehisa Homma. Candles are used in technical analysis to identify trends and patterns in a company’s stock in more detail than just a regular line chart. They represent the emotions of traders and a more detailed look at a stock’s price.
For most charts, the green candlestick is considered bullish and the red candlestick is considered bearish. These candles can sometimes also be shown as white and black.
Quick Notes:
Parts of the candlestick include the body, the wicks, the high, the low, the open, and the close.
There are bullish and bearish candlesticks.
A bullish candle becomes bullish when the close price is higher than the open price, representing an increasing price.
A bearish candle becomes bearish when the close price is lower than the open price, representing a decreasing price.
89
views
The Secret to Trading Breakouts - BECOME THE BEST!
How to Trade Breakouts: Definitions, Strategies, Examples
https://successacademycourses.com/how-to-trade-breakouts-definitions-strategies-examples/
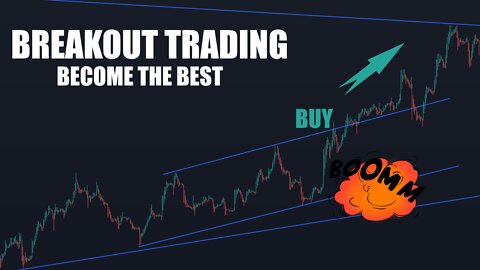
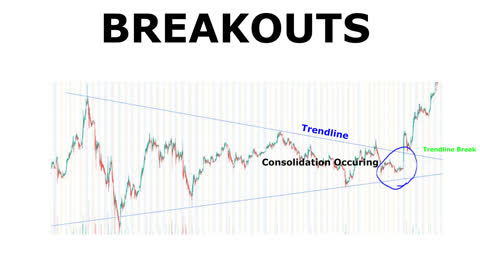
A breakout in trading is when price moves above or below an area of support or resistance. They can be bullish or bearish and can indicate a possible trend in the breakout direction. Breakouts are sometimes referred to as trendline breaks, which will most likely be categorized as either ascending or descending.
Technical analysts often use chart patterns, indicators, and other strategies to try and predict a breakout. Trading breakouts is no easy task, but when done correctly may lead to major trading opportunities.
2
views
The STRAT Method - EXACTLY How to Trade
STRAT Combos Free Cheat Sheet: https://successacademycourses.com/str...
Learn More Here: https://successacademycourses.com/wha...
-----------------------------------------------
USE CODE "SUCCESS"
The Ultimate Technical Analysis Stock Market Course: https://www.udemy.com/course/tsaultim...
-----------------------------------------------
IF you need to understand what the STRAT Method is:
https://www.youtube.com/watch?v=LBXlx...
Some STRAT Method Examples: https://www.youtube.com/watch?v=ZIbIo...
The STRAT method is possibly one of the most interesting stock market strategies there is. The STRAT method, developed by Rob Smith, is a price action-based charting strategy that analyzes individual candles and how they relate to each other, how they conform to levels of support and resistance, and how they can be traded with other time frames.
This method aims to remove emotion as much as possible by being objective, which means eliminating market noise and using facts to trade.
This strategy may be used by day traders.
#thestrat ! !
13
views
Some STRAT Method Examples
Learn More Here: https://successacademycourses.com/what-is-the-strat-method/
Get 75% OFF!
The Ultimate Technical Analysis Stock Market Course: https://www.udemy.com/course/tsaultimatechartanalysis/learn/?couponCode=SUCCESS
Use code "SUCCESS"
The STRAT method is possibly one of the most interesting stock market strategies there is. The STRAT method, developed by Rob Smith, is a price action-based charting strategy that analyzes individual candles and how they relate to each other, how they conform to levels of support and resistance, and how they can be traded with other time frames.
This method aims to remove emotion as much as possible by being objective, which means eliminating market noise and using facts to trade.
This strategy may be used by day traders.
20
views
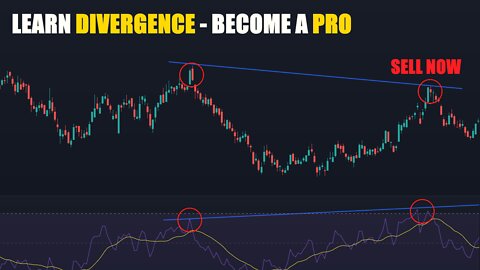
Become a PRO at Trading Divergence - Stock Market Strategy
Divergence Article and CHEAT SHEET: https://successacademycourses.com/how-to-trade-divergence-definitions-strategies-examples/
Divergence is a widely discussed topic in the technical analysis world. It can signal potential momentum or potential reversals which is why technical analysts examine this indication extensively.
Divergence is simply when price moves in the opposite direction of an indicator. Popular indicators that traders use when identifying and trading divergence include the RSI, MACD, and the CCI.
Divergence can serve as a warning or an indication of potential price movement.
27
views
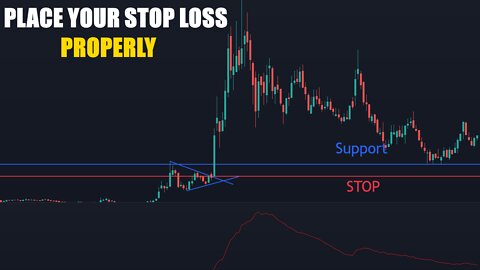
Where to Place Your Stop Loss - (Stop Missing HUGE Reversals!)
Learn More Here: https://successacademycourses.com/what-is-a-stop-loss-definitions-and-examples/
The Ultimate Technical Analysis Stock Market Course: https://www.udemy.com/course/tsaultimatechartanalysis/learn/?referralCode=B3A9AFA5A79307F392B0
A stop-loss is a certain action that can be performed at a certain price to limit loss. It usually takes form as a selling action once an asset reaches a specific price.
It not only helps traders stay disciplined, it ensures that traders follow part of a certain ruleset which may significantly prevent loss. Having a ruleset and following it is essential to managing risk.
12
views
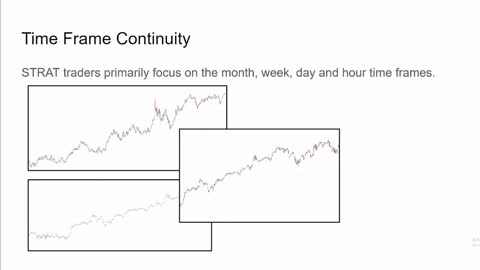
Time Frame Continuity and STRAT Trading - (Trading Secret!)
Learn More Here: https://successacademycourses.com/what-is-time-frame-continuity/
The Ultimate Technical Analysis Stock Market Course: https://www.udemy.com/course/tsaultimatechartanalysis/learn/?referralCode=B3A9AFA5A79307F392B0
When looking at the time frames of a chart, time frame continuity basically means that the more time frames that are moving in the same direction that you are trading in, the higher chance of the trade working out.
Time frame continuity is one of the universal truths of the STRAT method, along with actionable signals and broadening formations. This makes time frame continuity a particular part of technical analysis, especially when trading STRAT combos.
28
views
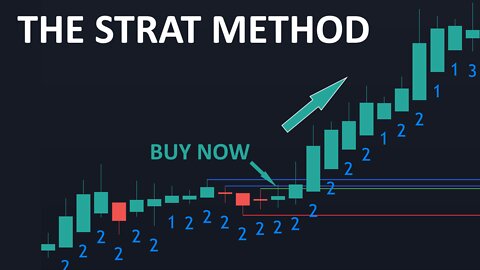
The STRAT - Win With This Charting Method
Learn More Here: https://successacademycourses.com/what-is-the-strat-method/
The Ultimate Technical Analysis Stock Market Course: https://www.udemy.com/course/tsaultimatechartanalysis/learn/?referralCode=B3A9AFA5A79307F392B0
Introduction: 0:00-0:06
Disclaimer: 0:06-0:13
What Is the STRAT Method? 0:13-1:05
Types of Candlesticks: 1:05-2:06
Candlestick/Bar Numbers: 2:06-2:36
2-1-2 Continuation: 2:36-4:04
2-2 Continuation: 4:04-5:42
Reversals: 5:42-5:58
2-2 Reversal: 5:58-6:57
2-1-2 Reversal: 6:57-7:41
3-1-2 Reversal: 7:41-8:19
3-2-2 Reversal: 8:19-8:57
1-2-2 Rev Strat: 8:57-9:58
Time Frame Continuity: 9:58-10:37
Broadening Formations: 10:37-10:51
Stop Losses: 10:51-12:02
Examples on a chart: 12:02
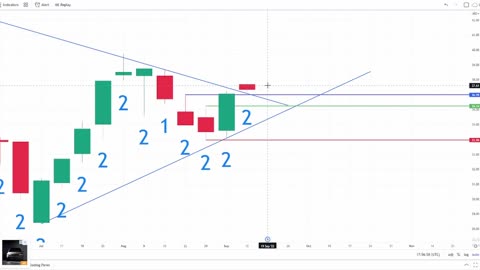
The STRAT method is possibly one of the most interesting stock market strategies there is. The STRAT method, developed by Rob Smith, is a price action-based charting strategy that analyzes individual candles and how they relate to each other, how they conform to levels of support and resistance, and how they can be traded with other time frames.
This method aims to remove emotion as much as possible by being objective, which means eliminating market noise and using facts to trade.
This strategy may be used by day traders.
30
views
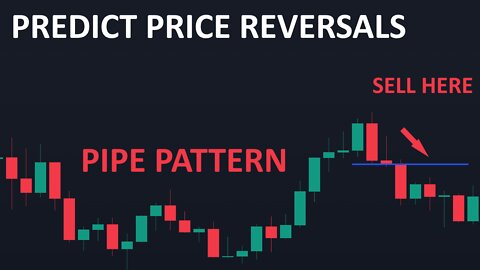
The POWERFUL REVERSAL Pattern You DON’T Know - Pipe Tops and Bottoms
Learn More Here: https://successacademycourses.com/pipe-tops-and-bottoms-chart-pattern/
The Ultimate Technical Analysis Stock Market Course: https://www.udemy.com/course/tsaultimatechartanalysis/learn/?referralCode=B3A9AFA5A79307F392B0
Introduction: 0:00-0:18
Disclaimer: 0:18-0:22
The Pipe Pattern: 0:22-0:50
Pipe Top: 0:50-1:45
Pipe Bottom: 1:45-2:40
Chart Example: 2:40
The Pipe Tops and Bottoms pattern uses individual candlesticks to determine possible trading opportunities, which can occur on both daily and weekly charts. Yet, Pipe patterns on a weekly chart generally perform better than those on a daily chart.
It may seem similar to a Horn pattern as traders may execute trades based on levels of support or resistance.
20
views
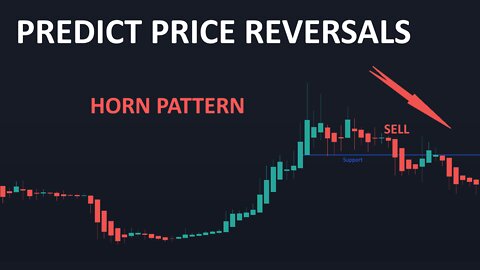
PREDICT REVERSALS with ONE Chart Pattern - Horn Tops and Bottoms
Learn More Here: https://successacademycourses.com/how-to-trade-the-horn-tops-and-bottoms-chart-pattern/
The Ultimate Technical Analysis Stock Market Course: https://www.udemy.com/course/tsaultimatechartanalysis/learn/?referralCode=B3A9AFA5A79307F392B0
Introduction: 0:00-0:16
Disclaimer: 0:16-0:21
Horn Pattern: 0:21-0:58
Confirmation: 0:58-1:30
Horn Tops: 1:30-3:16
Horn Bottoms: 3:16
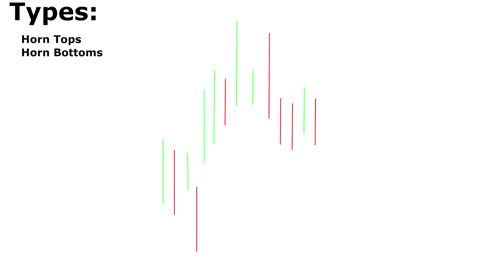
The Horn Tops and Bottoms pattern is particularly interesting because while utilizing the same concept of support and resistance, it goes in-depth into the individual candlesticks of the pattern. The Horn pattern also utilizes the concept of a breakout to catch a reversal.
The Horn pattern is a reversal pattern that has two types: The Horn Tops, and the Horn Bottoms. It is best seen on a weekly chart.
This pattern is not to be confused with the Double Top and Bottoms pattern, as this pattern uses focuses more on individual candlesticks and a different trading strategy.
68
views
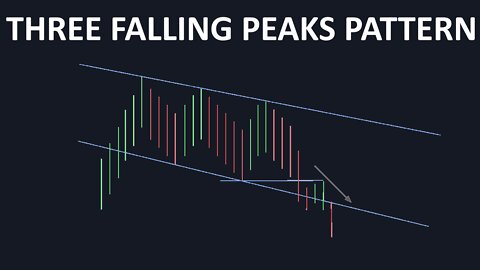
Predicting Bearish Breakouts Was Hard, Until I Discovered This - Three Falling Peaks Pattern
Learn More Here: https://successacademycourses.com/three-falling-peaks/
The Ultimate Technical Analysis Stock Market Course: https://www.udemy.com/course/tsaultimatechartanalysis/learn/?referralCode=B3A9AFA5A79307F392B0
Introduction: 0:00-0:14
Disclaimer: 0:14-0:19
Three Falling Peaks: 0:19-0:55
Support Level: 0:55-1:25
Trading Opportunity: 1:25
The Three Falling Peaks pattern is a particularly interesting pattern. It is studied by professional traders like Thomas Bulkowski. The pattern is a breakout pattern where the breakout is bearish.
The pattern begins with an uptrend, which is followed by three peaks in price and then returns to the downside after the breakout. It also includes the concept of support and resistance.
8
views
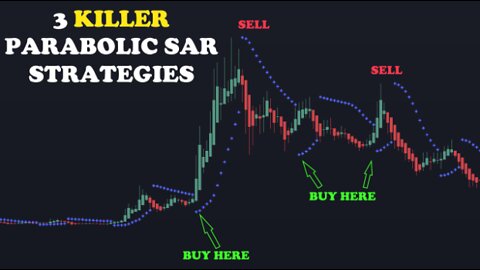
Parabolic SAR Indicator Secrets (3 Strategies to Profit in Bull and Bear Markets)
FULL ARTICLE: https://successacademycourses.com/how-to-use-the-parabolic-sar-3-killer-strategies/
The Parabolic SAR indicator helps the trader determine the direction in which the security is moving, and helps determine possible reversals in the trend. It usually is shown with circles or stars, below the price in an uptrend, and above the price in a downtrend. The Parabolic SAR, developed by J. Welles Wilder Jr., stands for Parabolic “stop and reverse” because of its ability to identify potential reversals in price movement. This indicator is a popular choice for those who partake in scalping.
Learn Technical Analysis: https://www.udemy.com/course/tsaultimatechartanalysis/learn/?referralCode=B3A9AFA5A79307F392B0
25
views
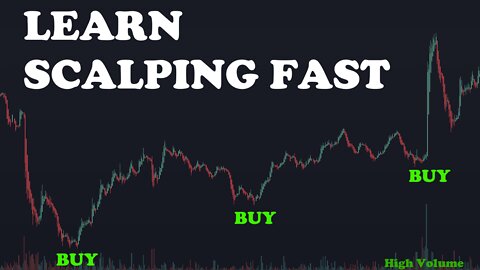
How to Use Scalping to Level Up Your Day Trading (3 Profitable Strategies)
Scalping is a certain trading style where traders specialize in making quick trades off small price changes.
https://successacademycourses.com/scalping/
Introduction: 0:00-0:12
Disclaimer: 0:12-0:20
What Is Scalping?: 0:20-2:53
MACD Strategy: 2:53-5:05
Parabolic SAR Strategy: 5:05-6:07
RSI Strategy: 6:07-6:49
How Do Traders Know When to Trade?: 6:49-7:57
Why May a Trader Not Enter a Trade?: 7:57
It uses the concept of support and resistance heavily and can incorporate indicators and chart patterns.
Day traders often use scalping. Scalpers often make multiple trades in a day and are bound by their own set of rules. Having a ruleset and following it is essential to managing risk while day trading.
Learn Technical Analysis: https://www.udemy.com/course/tsaultimatechartanalysis/learn/?referralCode=B3A9AFA5A79307F392B0
11
views
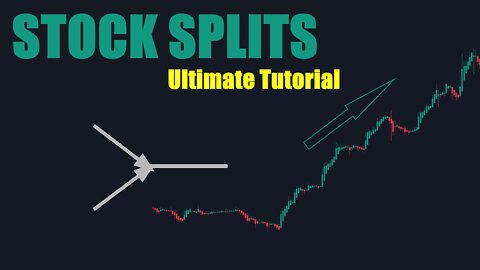
The Only Stock Splits Video You Will Ever Need
How to Use Stock Splits to Your Advantage
https://successacademycourses.com/how-to-use-stock-splits-to-your-advantage/
Introduction: 0:00-0:20
Disclaimer: 0:20-0:23
What Is a Stock Split: 0:23-0:37
Conventional Stock Split: 0:37-1:50
Reverse Stock Split: 1:50-2:55
Why A Conventional Stock Split: 2:55-3:50
How Traders Profit and Tesla Analysis: 3:50-5:04
Stock splits are greatly talked about in the stock market community as they can be a powerful catalyst for traders looking to profit. Before understanding how to trade stock splits, let’s first understand the different types of stock splits:
Conventional (Forward/Traditional)
Reverse
Free Beginners Stock Market Course: https://successacademycourses.com/free-course-sign-up/
79
views
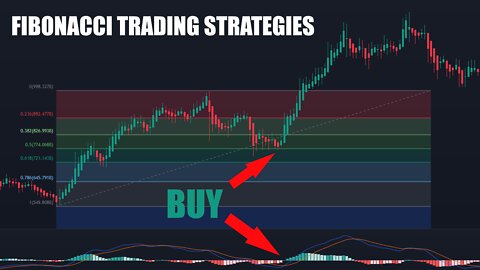
3 Powerful Fibonacci Trading Strategies (Technical Analysis Secrets)
What is Fibonacci Trading? 4 Powerful Fibonacci Tools & Strategies
https://successacademycourses.com/what-is-fibonacci-trading-4-powerful-fibonacci-tools-strategies/
Introduction: 0:00-0:16
Disclaimer: 0:16-0:20
What is Fibonacci?: 0:20-0:52
Placing the Retracement Tool: 0:52-1:41
Percentages and Meanings: 1:41-3:35
MACD Trading Strategy: 3:35-5:14
Golden Ratio Retreat Strategy: 5:14-6:08
Moving Averages Strategy: 6:08
The sequence goes as follows: 0, 1, 1, 2, 3, 5, 8, 13, 21, 34, 55, and so on, with every number after the first 2 being the sum of the 2 preceding numbers.
In trading, a retracement calculator creates Fibonacci Lines which are used as support and resistance price levels on the chart. The most focused on levels are the .5 and the .618 levels because they are often strong areas of support and resistance. So, if a stock were to cross one of those, it would probably change the trader’s outlook on the stock. This begs the question, how do traders use the Fibonacci sequence on a chart?
Get a FREE Beginners Stock Market Course: https://successacademycourses.com/free-course-sign-up/
175
views

Predict HUGE Trades With ONE Chart Pattern! (Stop Missing Opportunities)
Free Course Sign-Up: https://successacademycourses.com/free-course-sign-up/
This video covers a wedge breakout chart pattern. By utilizing the concept of support and resistance, the wedge pattern may form consolidation which creates huge potential.
The Ultimate Technical Analysis Stock Market Course
https://www.udemy.com/course/tsaultimatechartanalysis/learn/?referralCode=B3A9AFA5A79307F392B0
8
views
How to Find Support and Resistance Levels - The Success Academy
FREE COURSE -- https://successacademycourses.com/free-course-sign-up/
Support and resistance lines are price levels at which the stock tests, often multiple times. They are points of supply or demand of the stock. The concept of support and resistance is one of the most discussed topics in technical analysis and the stock market because it leads to so many other topics like chart patterns, indicators, Elliott waves, and more.
https://successacademycourses.com/what-is-support-and-resistance-a-complete-guide/
6
views
3 Chart Patterns Every Trader Should Know Article Video
GET YOUR FREE COURSE -- https://successacademycourses.com/free-course-sign-up/
Those who trade with technical analysis have identified chart patterns in the stock, usually with a candlestick chart. Technical analysts, those who study technical analysis, are able to use these chart patterns in an attempt to predict price movement.
Chart Patterns:
Head and Shoulders Pattern (And Inverted Head and Shoulders Pattern)
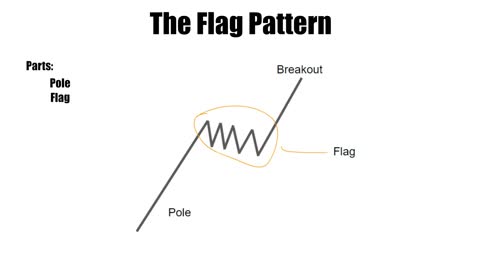
The Flag Pattern
The Double Pattern (Double Tops and Double Bottoms)
Also support and resistance.
Watch more on support and resistance here: https://www.youtube.com/watch?v=alSRh2SB6fA&t=4s
Read the article: https://successacademycourses.com/3-chart-patterns-every-trader-should-know/
Read more on support and resistance: https://successacademycourses.com/what-is-support-and-resistance-a-complete-guide/
5
views
How to Trade the Horn Tops and Bottoms Chart Pattern Article Video
https://successacademycourses.com/how-to-trade-the-horn-tops-and-bottoms-chart-pattern/
The Horn Tops and Bottoms pattern is particularly interesting because while utilizing the same concept of support and resistance, it goes in-depth into the individual candlesticks of the pattern. The Horn pattern also utilizes the concept of a breakout to catch a reversal.
https://www.udemy.com/course/tsaultimatechartanalysis/learn/?referralCode=B3A9AFA5A79307F392B0
8
views
How to Trade the Head and Shoulders Pattern
https://successacademycourses.com/how-to-trade-the-head-and-shoulders-pattern/
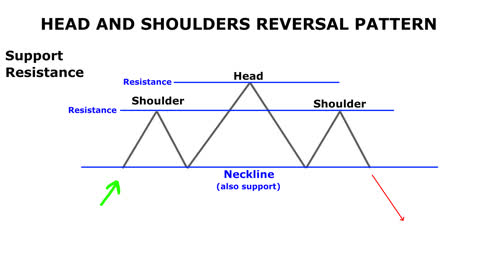
The Head and Shoulders pattern is one of the most well-known patterns in the technical analysis world. It consists of multiple parts with multiple trading opportunities.
The pattern utilizes the concept of support and resistance to identify points of reversal and breakout. This pattern is sometimes called the Head and Shoulders Reversal pattern because it generally results in a reversal of the trend.
https://www.udemy.com/course/tsaultimatechartanalysis/learn/?referralCode=B3A9AFA5A79307F392B0
5
views
How to Trade Breakouts: Definitions, Strategies, Examples
https://successacademycourses.com/how-to-trade-breakouts-definitions-strategies-examples/
A breakout in trading is when price moves above or below an area of support or resistance. They can be bullish or bearish and can indicate a possible trend in the breakout direction. Breakouts are sometimes referred to as trendline breaks, which will most likely be categorized as either ascending or descending.
https://www.udemy.com/course/tsaultimatechartanalysis/learn/?referralCode=B3A9AFA5A79307F392B0
8
views
1
comment