

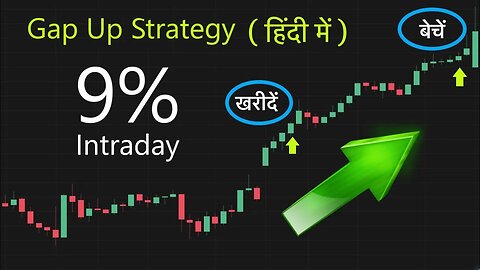
Gap Up and Gap Down Strategy Hindi | सबसे आसान Intraday Strategy
The Gap up and gap down strategy in Hindi (हिंदी में)
This is a wonderful strategy in which you can earn big profits easily! It is the best intraday trading strategy and as well a really easy intraday trading strategy !
Here I explain about the gap up and gap down strategy in India
The Indian stock market produces excellent opportunity for the gap up trading strategy
The high volatile market makes gap up strategy the best intraday trading strategy !!
Hope you enjoyed this video of Gap up trading strategy ( gap up and gap down trading strategy )
Do give us a like, it would motivate me to create many more beautiful trading strategy videos
Also do hit the Subscribe button to stay tuned!
1
view
What It Takes To Be A Profitable Trader?
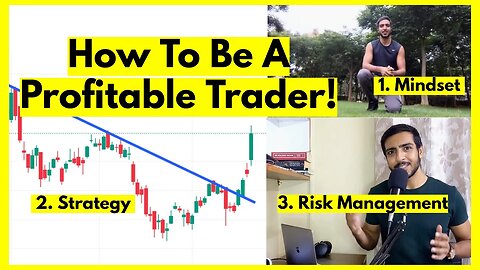
This is what it takes to be a Profitable trader!
A very simple yet sure method on avoiding losses,
Here I show you how you can easily become a Profitable Trader!
This video showcases how I prepare for a trading day and what it takes to remain consistently profitable!
Reversal Candlestick Patterns - https://youtu.be/YdzU9o7xEog
Join Telegram group - https://t.me/+s0cZxpSNB_syNTRl
Instagram - https://www.instagram.com/wealthztrader/
You can also write to me at wealthztrader@gmail.com
Hope you found this video useful. Many more trading & Investing videos here at Wealth Z Trader, Hit the Subscribe button to stay tuned!
This video focuses on how to be a profitable trading, How one can make profit in trading using simple risk management and positive mindset!
Following Risk Management and simple Risk to Reward can take you far ahead in being a profitable trader !!!
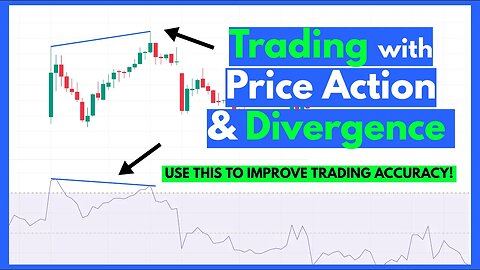
Learn to Trade using RSI Divergence & Price Action (Improve Trading accuracy with Divergence)
Trading with RSI Divergence helps you improve your trading accuracy,
You can use divergence with any trading strategy!
Here I show you How to Trade using RSI Divergence & Price Action!
This video focuses on Trading using RSI Divergence and price action,
There are 2 main ways to use RSI Divergence - Reversal trades and breakout trades!
rsi divergence trading strategy is very easy and can be used along with any other strategy as well!
Join Telegram group - https://t.me/+s0cZxpSNB_syNTRl
Instagram - https://www.instagram.com/wealthztrader/
You can also write to me at wealthztrader@gmail.com
Hope you found this video useful. Many more trading & Investing videos here at Wealth Z Trader, Hit the Subscribe button to stay tuned!
Transcript -
Ladies and gentlemen today we are gonna talk about a really important indicator in trading and that's RSI, you'll be learning about RSI divergence and I'll show you in a minute why it's such an important tool for your trades.
But before that let me establish how I'll be using price action for taking trades.
Now there are mainly 2 kinds of price action trades, reversal and breakout trades .. I'm slightly more inclined to taking reversal trades as it's more reliable .. However this works with both.
Here for example we have a channel pattern and when we have a closer look, we can see here around the point where we are expecting a reversal we see the price going up but the RSI is going down. The RSI is diverging from the price which is why we call it divergence.
So what's the significance of divergence?
The RSI indicates the buying power of the price, and what happens when the buying power reduces? The price falls down.
Here during the previous reversal point as well, if you can see the price is going up but the RSI is coming slightly down.
Which basically indicates the price is loosing it's power and it has a clean reversal
And again if we go back, we see here the price is going up but the RSI is coming down, A clean divergence and again we have a good reversal.
So the RSI is just an indicator, all it does is give a slight indication. So you should take your trades based on price action and use the help of RSI and other such indicators to indicate what might happen, Not the other way round.
Now just like reversal candles, Divergence is to be used only around reversal points.
However we can use divergence for finding out breakouts as well.
Now before I get to breakouts ... I would like to welcome you to the Telegram group we launched where traders & Investors gets market updates and can discuss anything related to trading & Investing!
Alright .. Breakouts!
Here we have a pattern with a breakout and RSI as well is going along with the price, everything looks normal right.
Except the breakout in the RSI happened around here, way before the actual breakout.
Basically a breakout in RSI indicates heavy buying power.
Now this indicates 2 things.
1. As a reversal trader, seeing the increased buying power, I would be very cautious if I were looking for reversal opportunities.
and
2. As a breakout trader, I would be prepared and on the lookout for a possible breakout.
Now you don't always need a breakout in the RSI to tell you there might be a breakout.
Another way to spot signs of oncoming breakout is by pure divergence,
Here the price is going down but the RSI is diverging up.
Now as a reversal trader I would be very cautious to not take a short trade in this scenario.
Whereas a breakout trader could view this as a sign of a possible breakout.
But again there was a gap up opening, and for intraday traders the opportunity is limited due to time constrain.
However divergence is not just limited to intraday trades, It works with any timeframe.
The only thing being is if you're a swing trader, you don't take a trade based on a divergence you spotted in 15 mins, you stick to the timeframe for a swing trade likewise for an intraday trader stick with your own timeframe.
and with that being said,
Hope you found this video useful. Many more trading & Investing videos here at Wealth Z Trader, Hit the Subscribe button to stay tuned!
58
views
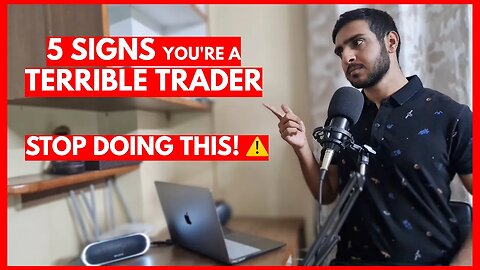
5 Signs You're A Terrible Trader | STOP DOING THIS!!!
DOING THIS is keeping you from being a successful trader.
5 Things you need to stop doing as a Trader in order to be profitable,
This video covers the 5 most common mistakes a Trader makes!
Telegram channel link - https://t.me/+s0cZxpSNB_syNTRl
Instagram - https://www.instagram.com/wealthztrader/
This is a video on 5 things you need to stop doing as a trader in stock market, work on these points and you'll definitely become a better trader,
This video indirectly shows you how to be a profitable trader!
Time Stamp -
0:00 Intro
0:28 1st Point
1:56 Telegram
2:13 2nd Point
3:13 3rd Point
3:58 4th Point
4:59 5th Point
Hope you found this video on Trailing stop loss useful,
Do Subscribe for many more Trading and Investing videos!
For any questions you can write to me at
wealthztrader@gmail.com
Transcript -
5 signs you're messing up
1. You always keep changing your strategy - Have you heard of the story where a person digging for treasure quits just before find the diamonds.
That happened to me. In my early days of trading, I kept swapping between trading strategies and every time I did that I kept loosing money.
And finally once I tried a strategy for 2 weeks and everyday in those 2 weeks I had continuous losses, It's a well known strategy, I had also backtested it for years and it had a win rate of 50%, Then why was a loosing .. Is it cause the market condition was bad, Or was it just my luck? Who could say.. But it doesn't matter. I had quit using that strategy.
Now what blew my mind was when I went back to observe what was happing with that strategy. The next week every single day had beautiful opportunities with continuous winning trades which if I would have continued would have not only covered my 2 weeks of losses. But it would have given me double of what I had lost earlier.
That's when I realised 90% of people quit just before reaching success and why do they do that is cause if they see someone else's strategy is doing amazing on one particular day, they switch their strategy and quit their winning strategy just when they were about to make a big win.
2. Not following risk management - It's as simple as this, If you use a simple 3:1 Risk to reward ratio and you get a win rate of just 30% You would still. be profitable. That means out of 10 times if you lose 7 times you would still be profitable. Actually you don't even need 30%, even if you get 26% win-rate you are still profitable, Anything lesser than 26% you would be losing money.
Not that we have defined how important A risk to reward is, We need add just one more tiny rule.
Never agree to loose more than 1% of your capital per trade.
If you have 1 lakh rupees to trade, That means your stop loss cannot exceed 1000. This doesn't mean you should put an extremely tight stop loss, What it means is you should reduce the size of your trades.
3. always trying to predict the market - Nobody knows where the market is going, Trust me what I say this, Not even warren Buffet, Not even Bill Gates and Definitely not Elon Musk.
Now as a trader we follow the rule of Buy low and sell high ... But how do you know where the low is cause you can't predict the market... Again how do you know where the high, Cause you can't predict the market.
Which is why Don't predict ... Don't listen to someone saying I'm an economist or the biggest hedge fund manager in the world, I can tell you where the low might be .. Bullshit, No one can predict that.
You enter as per your strategy and exit as per your strategy.
4. Trading based on news or tips - Let me tell you something about people who give tips or any news channel that gives tips.
The only reason they give Tips is cause they have purchased the stock way earlier and is now trying to hype up the price by giving tips just so that just can exit as soon it rise and leave you stranded and trapped as soon as they exit.
Now let me tell you about those who blindly follow Rakesh Jhunjhunwala,
You get to see his trades only quarter yearly when SEBI declares it to the public which is mandatory to be shown to the public for any big trades exceeding 1% of the company's market capital.
And Mr. Jhunjhunwala is aware that public can see his trades, every quarter yearly, so he carefully times his trade so that he gets the most benefit out of it and those who follow blindly eventually gets trapped.
5. Keeping a mental stop loss - Many, many many trader do not keep an actual stop loss, What they do is they keep a mental stop loss and when the price strikes the point that was supposed to be the stop loss, they try and exit but they mostly fail.
I'm telling you, The day you start placing actual stop losses for all your trades, no exception ... That's the day you mature as a trader!
13
views
5 Ways To Trail Your Stop Loss | Intraday & Swing Trade
Here are the Best ways to trail your stop loss, These methods allow you to let your trade run while preserving the profits you made!
Here are 5 Ways on How To trail Stop Loss for Intraday as well as trailing stop loss for Swing Trades!
Use these 5 methods for trailing stop loss / trailing profits, as these will let your profits run and help maximise your trading returns
Easy Intraday Trading Strategies - https://youtube.com/playlist?list=PLDfv6vSVfhe-mx0v-Onuz3_jPtmNbS3bc
Hope you found this video on Trailing stop loss useful,
Do Subscribe for many more Trading and Investing videos!
For any questions you can write to me at
wealthztrader@gmail.com
Time stamp -
0:00 Intro
0:46 5 ways to trail stop loss
1:03 1. Market structure
3:21 2. Previous 2 candles low
4:49 3. Average True Range
5:46 4. Moving average
6:35 5. Fixed target
Transcript -
There are 5 ways of trailing your stop loss that I have found to be very effective.
Out of these 5 ways .. There are some that are meant only for intraday, and some meant only for swing trade, and some both, which I'll let you know as I explain them.
Alright, let's get to it.
1. Market structure - Now the best Trades are those where you ride with the trend, and once the trend changes... You exit the trade.
Now for detecting the trend, we would be using a very well known market structure pattern among traders called as higher high and higher lows or if you're short selling lower highs and lower lows
2. Previous 2 candle low - As the name suggests we keep a trailing gap of 2 candles low. This is good enough to not get eaten up the volatility while keeping you in the trade as far it goes.
3. ATR (Average True Range) - This is an indicator that gives you a stop loss level based on the volatility of the stock or index.
4. Moving average - This is by far the most well known method for detecting trend among traders.
5. Fixed target - Fixed target is quite similar to previous 2 candles low ... Where we maintain a fixed trailing gap based on the volatility of the stock or index.
8
views

One Secret To Improve Any Trading Strategy Dramatically!
This here is my golden rule when it comes to trading. One simple rule to make you a better trader!
This video speaks about the One secret that would help you dramatically improve your trading strategy.
Watch my complete beginner series -
https://youtube.com/playlist?list=PLDfv6vSVfhe9iIbWiw4AJL454wVc_Yu6I
In this video I speak about importance of candlestick and candlestick patterns.
I cannot stress enough how important it is to take a trade only if the candlestick patterns are formed.
In this video I speak about different candlestick patterns and how to use them.
You can use this on any strategy and any time frame - although during the video I have used examples for intraday trading using price action.
Hope you found this video useful.
Do hit the subscribe button as many more trading and investing videos here at wealth z trader.
2
views
Moving Average Intraday Trading Strategy (With Backtesting)
The Easiest ever Intraday Trading Strategy with a very impressive win rate!
I have been using this strategy in the past for 6 months and it's results are amazing!
Moving average intraday strategy is best suited wanting an easy trading strategy with good and consistent results.
In this video I show you how to use moving average intraday trading strategy , followed by backtesting moving average strategy
For any questions you can write to me at
wealthztrader@gmail.com
Moving average intraday trading strategy (With Backtesting)
Here is the easiest intraday trading strategy there is .. and inspite of being so simple and easy the results are quite impressive which you'll see when I show you the backtesting .. and just so you know I have personally used this strategy for 6 months in the past and I had good consistent results.
Alright let me show you the strategy
you will need to select Simple moving average indicator ... and the time length of the indicator needs to be set at 14
We will be trading in 15 mins time frame and what you need to to do is whenever the candle crosses the moving average line and closes with a strong candle, you take the trade ... If it closes above the line, you buy and take a trade and when it closes below the line, you take a short trade.
For all the trades, it's best to keep a fixed target as the exit and then after it reaches the target, we can trail the profits ... and stop loss should always be set at 1/3rd of your profit
So for nifty, I always used to use 60 points as my target .. and from there I keep trailing the profits and exactly 20 points as my stop loss.
and now to show you how brilliantly this strategy works ... Let's get to backtesting
We will be backtesting for the past 10 continuous days, so it's 10 continuous days and not just the days when the strategy works.
alright so 10th day, 9, 8 ...
We will be starting here
Here we have a strong close when it crosses the moving average line, We'll short here and as you can see it hits our target, but your profits can be much more depending on how efficently you are able to trail your stop loss (which will be a topic for another video)
Now let's head to day 2
here we have a buy opportunity after it crosses the line ... and we book a loss
and then it heads in the downward direction with a strong close so we will take a trade and again a loss
Just so you know 3 of these losses is equal to one of our profit so happily accept the losses and move on.
moving to day 3
You can see, here it closes below the moving average line, we take the trade and we book a profit
again on the same day, you can see here we have one more opportunity for a trade but we won't be taking it as it's very near market closing time ... I always have a rule to never take any intraday trades within 1 hour of closing
alright, moving to day 4
Here you can see this candle closes on the line, we need the candle to close strong below the line, not on the line
Here we find that oppertunity, we take the trade and book our profit
and again later on in the same day the candle closes above the line, we take our trade and book our second profit for the day
now, day 5
Here a candle has a nice strong close above the line, We take the trade and here you can see the wick did come very close to our stop loss but it did not touch so we are safe and we book a profit
heading to day 6
Here it closes above the line, we take a trade and we book a loss
This is why I live using small target with small stop loss ... even though our targets are small, we can keep trailing our profits .. but when it hits our stop loss, we loose very little
alright, day 7
Here we find another trade opportunity which hits our stop loss so we book our loss and close the trade
we move to day 8
We find a nice strong close here, we take the trade and book a profit
alright, we are almost to the end of our backtesting day 9
Here we find a nice strong close above the line, we take the trade and it gives us a nice quick profit ... again if you see here on the same day we find another opportunity, we take the trade and we book a profit ...
Now I think here we have yet another opportunity , our third trade for the day, we take it and we book the 3rd profit for the day as well
okay awesome,
Now heading to day 10
Here we have a shorting opportunity, we take the trade and we close with a profit.
22
views