

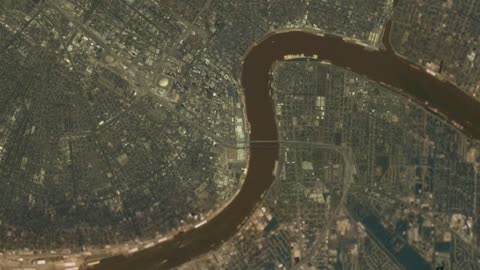
Great Zoom into Kodak Theater with spin (Los Angeles, CA)
Using data from different spacecraft and some powerful computer technology, visualizers at the Goddard Space Flight Center present you with a collection of American cities in a way you have never seen them before. Starting with our camera high above the Earth, we rush in towards the surface at what would be an impossible speed for any known vehicle. Passing though layers of atmosphere, the colors of our destinations shimmer with their own unique characteristics, and suddenly we find ourselves floating in virtual space just above the ground.
This visualization is the first time we have incorporated topographic relief into a great zoom. This particular visualization was created at the request of ABC to use in the opening of the 2003 Academy Awards; however, due to Iraqi war coverage with zooms that appeared similar, the visualization was pulled at the last minute. This version was re-rendered for the 2005 Academy Awards to change the name on the roof back to the original 'Kodak Theatre' signage.
This zoom was shown at the opening of the Academy Awards 'Red Carpet Show' at 8:00pm EST on February 27, 2005 on the ABC television network.
11
views
Godzilla Dust Strom। Nasa
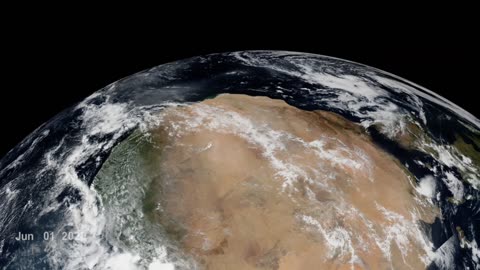
In June 2020, a "Godzilla" dust plume travelled from the Sahara, the planet’s largest, hottest desert, across the Atlantic ocean to North America. Saharan dust plumes are a natural phenomenon and occur especially during the summertime, due to dust uplift from low level jets and haboobs. This particular event was nicknamed "Godzilla" dust plume, because of its huge extent and massive amount of dust transport - the most intense episode over the past two decades.
The data visualizations included on this webpage track the "Godzilla" dust plume by featuring near real-time VIIRS Corrected Reflectance (True Color) daily imagery for the month of June 2020. The first visualization listed on this webpage showcases the trans-Atlantic transport of the dust plume, while the second visualization showcases the formation of the dust plume as seen from West Africa.
The Sahara Desert is 3,600,000 square miles (9,200,000 square kilometers) of arid land stretched across the northern half of Africa, coming in just slightly smaller in size than the continental United States. Upwards of 60 million tons of its nutrient-laden sand and soil are lifted into the atmosphere each year, creating a massive layer of hot, dusty air that winds carry across the Atlantic to deliver those nutrients to the ocean and vegetation in South America and the Caribbean.
On its journey across the Atlantic, Saharan dust sprinkles into the ocean, feeding the marine life, and similarly plant life once it makes landfall. Minerals like iron and phosphorus in the dust act as a fertilizer for the Amazon rainforest, Earth’s largest and most biodiverse tropical forest, whose rains otherwise wash many of these valuable nutrients into the Amazon river basin.
Tracking and understanding dust plumes and their effects is critical, since dust intrusion also affects air quality. The “Godzilla” dust plume degraded the air quality in the Carribean Basin to the hazardous level and the dust intrusion into the U.S. exceeded the EPA air quality in about 40% of the stations in Southern U.S. Breathing in dust is particularly hazardous for children, the elderly, and those with respiratory conditions like asthma. Because of this, the Moderate Resolution Imaging Spectroradiometers (MODIS) on NASA's Terra and Aqua satellites, the National Oceanic and Atmospheric Administration (NOAA) GOES-16 (EAST) satellite, and the Visible Infrared Imaging Radiometer Suite (VIIRS) on the joint NASA/NOAA Suomi NPP satellite are employed to help detect dust plumes, so that at-risk communities could prepare for the potentially adverse health effects.
58
views
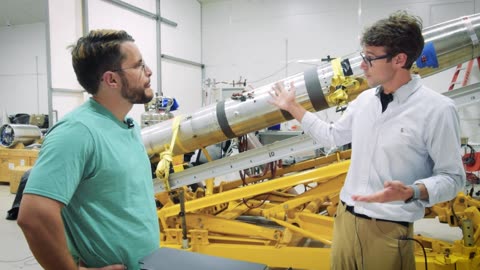
High Above Down Under, Episode 3 (sorry for being late)
n this episode, Miles digs into the science behind the mission. What is UV light good for anyways?
Music credits: “Neutral Thinking” by Nicolas Montazaud [SACEM]; “Epic Earth” by Andy Hopkins [PRS], Dean Mahoney [PRS], Jacob Nicholas Stonewall Jackson [PRS]; “Tightrope Walker” by Nicolas Montazaud [SACEM], “Natural Response” by Jonathan Elias [ASCAP], Sarah Trevino [ASCAP]; “Canny Koala” by Ian Paul Livingstone [PRS]; “The Final Piece” by Jonathan Elias [ASCAP], Sarah Trevino [ASCAP] from Universal Production Music.
Additional footage: Office of the Chief Minister of the Northern Territory government, Equatorial Launch Australia
11
views
Episode 2: Living With the Stars
Watch this video on the NASA Goddard YouTube channel.
Complete transcript available.
In this episode, hear from a local Yolngu leader and learn what it takes to make a rocket range from scratch.
Music credits: “The Wilderness” by Benjamin James Parsons [PRS]; “Epic Earth” by Andy Hopkins [PRS], Dean Mahoney [PRS], Jacob Nicholas Stonewall Jackson [PRS]; ”Outback Sunset” by Randall Aaron Foat [ASCAP]; “Everlasting Armenian Hope” by Mathieu Fiset [SOCAN]; “Migration” by Giovanni Antonio Parricelli [PRS]; “Coastal Highways” by Ian Paul Livingstone [PRS] from Universal Production Music
Additional footage: Office of the Chief Minister of the Northern Territory government, Equatorial Launch
11
views
High Above Down Under | Episode 4: The Final Test
High Above Down Under | Episode 4: The Final Test
Watch this video on the NASA Goddard YouTube channel.
Complete transcript available.
In this episode, we’ll answer that question and check in on the rockets as they make their final preparation to launch into space.
Music credits: “Mountain Forest” by Andy Hopkins [PRS], Dean Mahoney [PRS], Jacob Nicholas Stonewall Jackson [PRS]; “Epic Earth” by Andy Hopkins [PRS], Dean Mahoney [PRS], Jacob Nicholas Stonewall Jackson [PRS]; “Connectivity” by Ty Unwin [PRS]; “Driving” by Paul Hartnoll [PRS]; “Glide Shot” by Paul Hartnoll [PRS] from Universal Production Music.
Additional footage: Office of the Chief Minister of the Northern Territory government, Equatorial Launch Australia
26
views
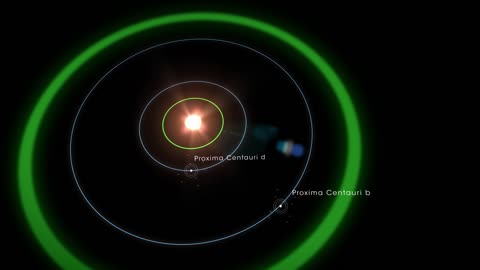
High Above Down Under, Episode 1: A Star Fit For Life
Episode 1: A Star Fit For Life
Watch this video on the NASA Goddard YouTube channel.
Complete transcript available.
Follow two NASA rocket teams as they launch from Australia to study our nearest stellar neighbors – Alpha Centauri A & B – on a quest to understand how stars make the planets around them suitable for life.
Music credits: “Epic Earth” by Andy Hopkins [PRS], Dean Mahoney [PRS], Jacob Nicholas Stonewall Jackson [PRS]; “Nature in Motion” and “Driving Motion” by Fred Dubois [SACEM]; “Social Issues” by Laurent Dury [SACEM]; “The Great Divide” by Ian Paul Livingstone [PRS] from Universal Production Music.
Additional footage: Office of the Chief Minister of the Northern Territory government, Equatorial Launch Australia
16
views

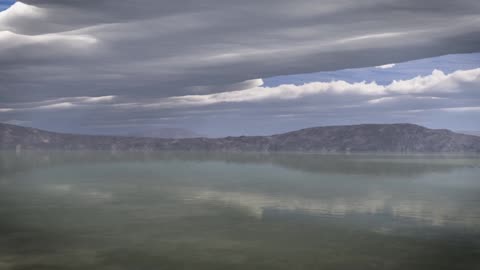
High Above Down Under Series trailer । NASA
Around a different star, Earth may never have developed life at all. So what makes a star friendly to life? We joined two rocket teams as they traveled to the remote Northern Territory of Australia to capture light from our closest stellar neighbors to help reveal the answer. Follow their journey in the 6-part video series High Above Down Under. Episodes released weekly starting June 27, 2023.
16
views
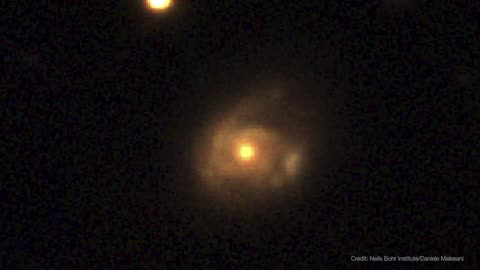
Swift Spots a Snacking Black Hole Using a New Trick। NASA
Using NASA’s Neil Gehrels Swift Observatory, which launched in 2004, scientists have discovered a black hole in a distant galaxy repeatedly nibbling on a Sun-like star. The object heralds a new era of Swift science made possible by a novel method for analyzing data from the satellite’s X-ray Telescope (XRT).
When a star strays too close to a monster black hole, gravitational forces create intense tides that break the star apart into a stream of gas. The leading edge swings around the black hole, and the trailing edge escapes the system. These destructive episodes are called tidal disruption events. Astronomers see them as flares of multiwavelength light created when the debris collides with a disk of material already orbiting the black hole.
Recently, astronomers have been investigating variations on this phenomena, which they call partial or repeating tidal disruptions.
During these events, every time an orbiting star passes close to a black hole, the star bulges outward and sheds material, but survives. The process repeats until the star loses too much gas and finally breaks apart. The characteristics of the individual star and black hole system determine what kind of emission scientists observe, creating a wide array of behaviors to categorize.
On June 22, 2022, the XRT captured Swift J0230 for the first time. It lit up in a galaxy around 500 million light-years away in the northern constellation Triangulum. Swift’s XRT has observed nine additional outbursts from the same location roughly every few weeks.
Scientists propose that Swift J0230 is a repeating tidal disruption of a Sun-like star orbiting a black hole with over 200,000 times the Sun’s mass. They estimate the star loses around three Earth masses of material on each pass. This system provides a bridge between other types of suspected repeating disruptions and allowed scientists to model how interactions between different star types and black hole sizes affect what we observe.
Swift J0230’s discovery was possible thanks to a new, automated search of XRT observations called the Swift X-ray Transient Detector.
After the instrument observes a portion of the sky, the data is transmitted to the ground, and the program compares it to previous XRT snapshots of the same spot. If that portion of the X-ray sky has changed, scientists get an alert. In the case of Swift J0230, astronomers were able to rapidly coordinate additional observations of the region.
60
views
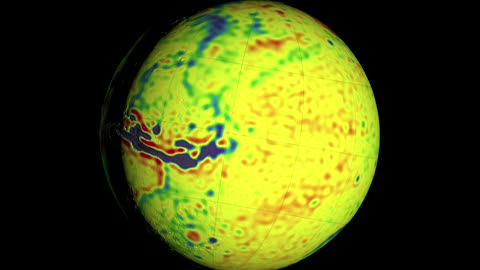
Mars Gravity Map, Full information। NASA
Goddard Mars Model (GMM) 3 is a global map of the gravity field of Mars. It was created by studying the flight paths of three Mars-orbiting spacecraft — Mars Global Surveyor (MGS), Mars Odyssey (ODY), and Mars Reconnaissance Orbiter (MRO).
The travel time and Doppler shift of radio signals sent between the spacecraft and the Earth-based dish antennas of the Deep Space Network are used to measure the position and velocity of each spacecraft. Over time, small variations in these orbital parameters allow scientists to build up an accurate and detailed gravity map of the red planet.
If Mars were a perfectly smooth sphere of uniform density, the gravity experienced by the spacecraft would be exactly the same everywhere. But like other rocky bodies in the solar system, including the Earth, Mars has both a bumpy surface and a lumpy interior. As the spacecraft fly in their orbits, they experience slight variations in gravity caused by both of these irregularities, variations which show up as small changes in the velocity and altitude of the three spacecraft.
The free-air gravity map shows these variations directly. The map is color-coded to display the departure from the mean gravity of Mars, in milligals, a unit of acceleration. Purple and blue mark areas where the acceleration due to gravity is lower than average, while red and white show where it's higher.
The Bouguer gravity map subtracts the effect of the bumpy surface to show the lumpiness underneath. The elevation maps from the laser altimeter on MGS were used to create a model of what the gravity would be if Mars were bumpy but not lumpy. This model was then subtracted from the free-air map to produce the Bouguer map.
The crustal thickness map is inferred from the Bouguer map: If the density of the crust is assumed to be uniform, then the gravity anomalies visible in the Bouguer gravity map can be explained by variations in the thickness of the crust. Highs in gravity indicate places where the denser mantle is closer to the surface, and hence where the crust is thinner.
The orbit analysis accounted for solar radiation pressure and for the mass and the drag of the thin Martian atmosphere. It also detected the seasonal variation in the amount of carbon dioxide locked up in the polar ice caps as they freeze and thaw.
While aiding navigation for future Mars missions, GMM-3 reveals information about the internal structure of Mars that provides important clues to the geological history of the red planet.
115
views
Earth: A System of Systems (updated)। NASA
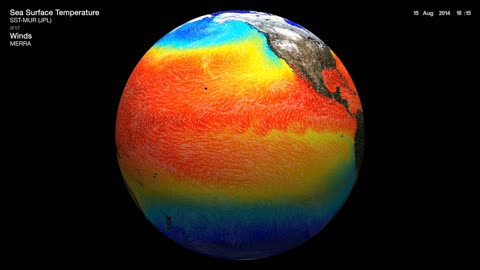
In order to study the Earth as a whole system and understand how it is changing, NASA develops and supports a large number of Earth-observing missions. These missions provide Earth science researchers the necessary data to address key questions about global climate change.
This visualization reveals that the Earth system, like the human body, comprises diverse components that interact in complex ways. Shown first, the Multi-Scale Ultra-High Resolution (MUR) sea surface temperature (SST) dataset combines data from the Advanced Very High-Resolution Radiometer (AVHRR), Moderate Imaging Spectroradiometer (MODIS) Terra and Aqua, and Advanced Microwave Spectroradiometer-EOS (AMSR-E) instruments. Constantly released into the Earth’s atmosphere, heat and moisture from the ocean and land influence Earth’s weather patterns—represented here as wind speeds from the Modern-Era Retrospective analysis for Research and Applications (MERRA) dataset. Moisture in the atmosphere—represented as water vapor (also from MERRA)—forms clouds (shown here using cloud layer data from the NOAA Climate Prediction Center) and precipitation. Precipitation (data from GPM IMERG) significantly impacts water availability, which influences soil moisture (data from NASA-USDA-FA) and ocean salinity.
While scientists learn a great deal from studying each of these components individually, improved observational and computational capabilities increasingly allow them to study the interactions between these interrelated geophysical and biological parameters, leading to unprecedented insight into how the Earth system works—and how it might change in the future.
13
views
Shortwave Radiation and Longwave Radiation the earth। NASA
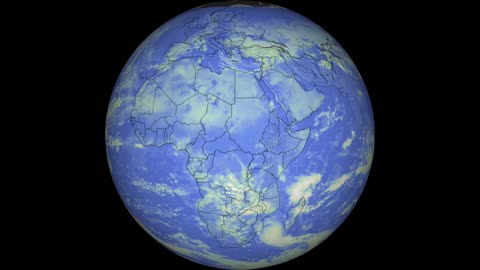
The CERES experiment is one of the highest priority scientific satellite instruments developed for NASA's Earth Observing System (EOS). The doors are open on NASA's Suomi NPP satellite and the newest version of the Clouds and the Earth's Radiant Energy System (CERES) instrument is scanning Earth for the first time, helping to assure continued availability of measurements of the energy leaving the Earth-atmosphere system.
CERES products include both solar-reflected and Earth-emitted radiation from the top of the atmosphere to the Earth's surface. Cloud properties are determined using simultaneous measurements by other EOS and NPP instruments such as the Moderate Resolution Imaging Spectroradiometer (MODIS) and the Visible and Infrared Sounder (VIRS). Analyses using CERES data, build upon the foundation laid by previous missions such as NASA Earth Radiation Budget Experiment (ERBE), leading to a better understanding of the role of clouds and the energy cycle in global climate change.
The sun's radiant energy is the fuel that drives Earth's climate engine. The Earth-atmosphere system constantly tries to maintain a balance between the energy that reaches the Earth from the sun and the energy that flows from Earth back out to space. Energy received from the sun is mostly in the visible (or shortwave) part of the electromagnetic spectrum. About 30% of the solar energy that comes to Earth is reflected back to space. The ratio of reflected-to-incoming energy is called "albedo" from the Latin word meaning whiteness. The solar radiation absorbed by the Earth causes the planet to heat up until it is radiating (or emitting) as much energy back into space as it absorbs from the sun. The Earth's thermal emitted radiation is mostly in the infrared (or longwave part of the spectrum. The balance between incoming and outgoing energy is called the Earth's radiation budget.
This global view shows CERES top-of-atmosphere (TOA) shortwave radiation from Jan 26 and 27, 2012. Thick cloud cover tends to reflect a large amount of incoming solar energy back to space
48
views
Sea Ice Maximum 2020, 2022, 2023। Nasa
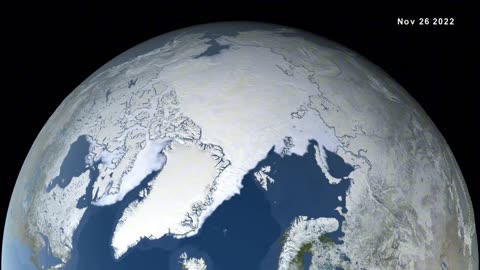
After growing through the fall and winter, sea ice in the Arctic appears to have reached its annual maximum extent. The image above shows the ice extent—defined as the total area in which the ice concentration is at least 15 percent—at its 2023 maximum, which occurred on March 6. On this day the extent of the Arctic sea ice cover peaked at 14.62 million square kilometers (5.64 million square miles), making it the fifth lowest yearly maximum extent on record. This year’s maximum is 1.03 million sq km below the 1981-2010 average Arctic maximum of 15.65 million sq km. The trend in the maximum is -41,200 sq km per year or -2.6 % per decade relative to the 1981-201 average.
24
views
GEDI Forest Height researched। Nasa
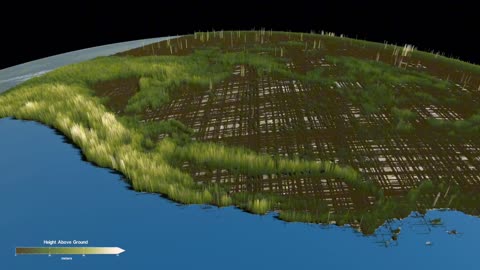
The Global Ecosystem Dynamics Investigation (GEDI) produces high resolution laser ranging observations of the 3D structure of the Earth. GEDI’s precise measurements of forest canopy height, canopy vertical structure, and surface elevation greatly advance our ability to characterize important carbon and water cycling processes, biodiversity, and habitat.
GEDI’s data on surface structure are also of immense value for weather forecasting, forest management, glacier and snowpack monitoring, and the generation of more accurate digital elevation models. GEDI provides the missing piece – 3D structure – in NASA’s observational assets which enables us to better understand how the Earth behaves as a system, and guides the actions we can take to sustain critical resources.
The GEDI instrument is a geodetic-class, light detection and ranging (lidar) laser system comprised of 3 lasers that produce 8 parallel tracks of observations. Each laser fires 242 times per second and illuminates a 25 m spot (a footprint) on the surface over which 3D structure is measured. Each footprint is separated by 60 m along track, with an across-track distance of about 600 m between each of the 8 tracks. GEDI expected to produce about 10 billion cloud-free observations during its nominal 24-month mission length.
50
views
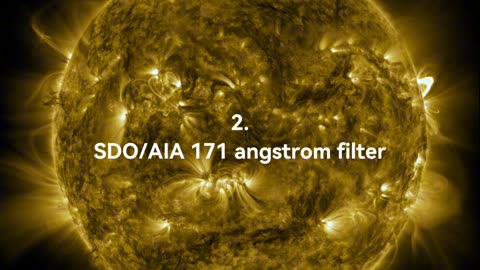
The Sun, M 6.0 flare at Active Region 13413 - September 3, 2023। Nasa
The M 6.0 flare erupts on the right limb of the Sun in this view. A nice coronal loop arcade forms afterwards. The point-spread function correction (PSF) has been applied to all this imagery.Solar Dynamics Observatory (SDO) operates in a geosynchronous orbit around Earth to obtain a continuous view of the Sun. The particular instrument in this visualization records imagery in the ultraviolet portion of the spectrum at wavelengths normally absorbed by Earth's atmosphere - so we need to observe them from space.
Active Region 13413 on the limb of the Sun erupts with mid-range flare exceeding M5 intensity. A nice loop arcade forms, apparently as part of the eruption. For details of this event, see the Space Weather database entry.
For more information on the classification of solar flares, see Solar Flares: What Does It Take to Be X-Class? or X-Class: A Guide to Solar Flares. The point-spread function correction (PSF) has been applied to all this imagery.What is the PSF (Point Spread-Function)?
Many telescopes, especially reflecting telescopes such as the ones used on SDO (Wikipedia), have internal structures that support various optical components. These components can result in incoming light being scattered to other parts of the image. This can appear in the image as a faint haze, brightening dark areas and dimming bright areas. The point-spread function (Wikipedia) is a measure of how light that would normally be received by a single camera pixel, gets scattered onto other pixels. This is often seen as the "spikes" seen in images of bright stars. For SDO, it manifests as a double-X shape centered over a bright flare (see Sun Emits Third Solar Flare in Two Days). The effect of this scattered light can be computed, and removed, by a process called deconvolution (Wikipedia). This is often a very compute-intensive process which can be sped up by using a computers graphics-processing unit (GPU) for the computation.
42
views
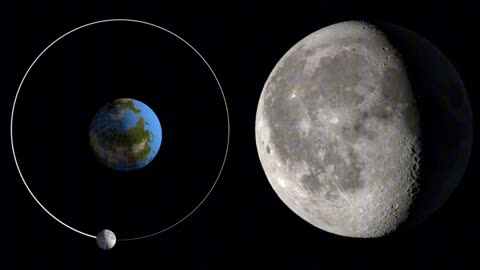
Earth and the Moon's rotation of the year। Nasa
The orbit of the Moon in 2023, viewed from the north pole of the ecliptic, with the vernal equinox to the right. The sizes of the Earth and Moon are exaggerated by a factor of 15, 20, or 25, depending on the frame size. The frames include an alpha channel.
From this birdseye view, it's somewhat easier to see that the phases of the Moon are an effect of the changing angles of the Sun, Moon and Earth. The Moon is full when its orbit places it in the middle of the night side of the Earth. First and Third Quarter Moon occur when the Moon is along the day-night line on the Earth.
The First Point of Aries is at the 3 o'clock position in the image. The Sun is in this direction at the March equinox. You can check this by freezing the animation at around the 1:03 mark, or by freezing the full animation with the time stamp near March 20. This direction serves as the zero point for both ecliptic longitude and right ascension.
The north pole of the Earth is tilted 23.5 degrees toward the 12 o'clock position at the top of the image. The tilt of the Earth is important for understanding why the north pole of the Moon seems to swing back and forth. In the full animation, watch both the orbit and the "gyroscope" Moon in the lower left. The widest swings happen when the Moon is at the 3 o'clock and 9 o'clock positions. When the Moon is at the 3 o'clock position, the ground we're standing on is tilted to the left when we look at the Moon. At the 9 o'clock position, it's tilted to the right. The tilt itself doesn't change. We're just turned around, looking in the opposite direction.
55
views
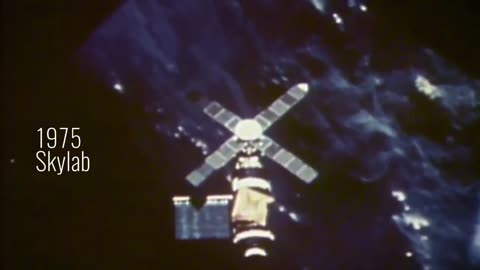
Nasa's 50 Years of earth day video.
It’s been five decades since Apollo 8 astronaut William Anders photographed Earth peaking over the Moon’s horizon. The iconic image, dubbed Earthrise, inspired a new appreciation of the fragility of our place in the universe. Two years later, Earth Day was born to honor our home planet. As the world prepares to commemorate the 50th anniversary of Earth Day, NASA reflects on how the continued growth of its fleet of Earth-observing satellites has sharpened our view of the planet’s climate, atmosphere, land, polar regions and oceans.
24
views
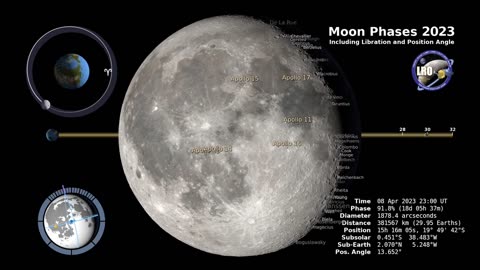
Moon hourly rotation live recorded। Nasa
The phase and libration of the Moon for 2023, at hourly intervals. Includes supplemental graphics that display the Moon's orbit, subsolar and sub-Earth points, and the Moon's distance from Earth at true scale. Craters near the terminator are labeled, as are Apollo landing sites and maria and other albedo features in sunlight.
20
views