


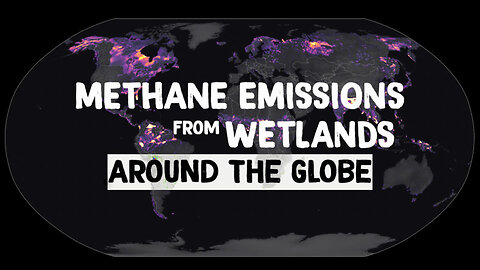
Methane Emissions from Wetlands
Methane is an important greenhouse gas that contributes substantially to global warming. On a molecule by molecule basis, methane is much more efficient at trapping heat than carbon dioxide, the main driver of warming. Though human activities, including agriculture, oil and natural gas production and use, and waste disposal, collectively contribute the majority of methane to the atmosphere, about a third of total methane emissions comes from wetlands. Wetland habitats are filled with things like waterlogged soils and permafrost, which makes them sizable carbon sinks. However, as the climate changes, these carbon-rich soils are vulnerable to flooding and to rising temperatures, which can release more carbon to the atmosphere in the form of methane. Understanding methane emissions from natural sources like wetlands is critically important to scientists and policymakers who are working to ensure that changes in natural systems don’t counteract progress in combatting climate change made by reducing emissions from human activities.
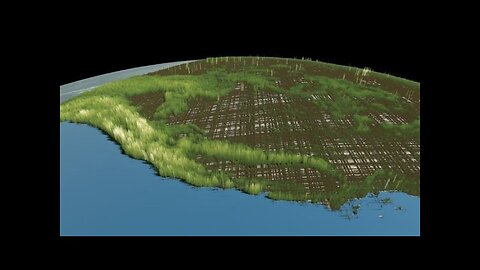
This animation shows estimates of wetland methane emissions produced by the Lund–Potsdam–Jena Dynamic Global Vegetation Model (LPJ-DGVM) Wald Schnee und Landscaft version (LPJ-wsl). LPJ-wsl is a prognostic model, meaning that it can be used to simulate future changes in wetland emissions and independently verified with remote sensing data products. The model includes a complex, topography dependent model of near surface hydrology, and a permafrost and dynamic snow model, allowing it to produce realistic distributions of inundated areas. Highlighted areas show concentrated methane sources from tropical and high latitude ecosystems. The LPJ-wsl model is regularly used in conjunction with NASA’s GEOS model to simulate the impact of wetlands and other methane sources on atmospheric methane concentrations, compare against satellite and airborne data, and to improve understanding and prediction of wetland emissions.
27
views
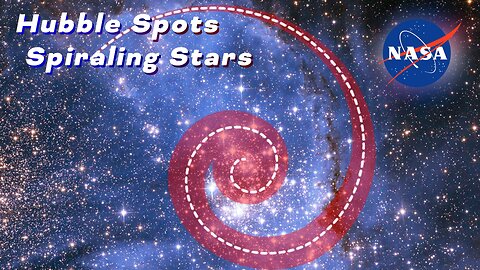
Hubble Spots Spiraling Stars
Nature likes spirals — from the whirlpool of a hurricane, to pinwheel-shaped protoplanetary disks around newborn stars, to the vast realms of spiral galaxies across our universe.
Now astronomers are bemused to find young stars that are spiraling into the center of a massive cluster of stars in the Small Magellanic Cloud, a satellite galaxy of the Milky Way.
2
views
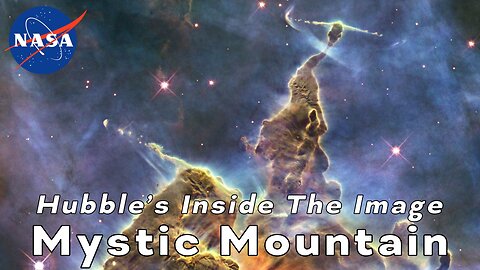
Hubble’s Inside The Image: Mystic Mountain
The Hubble Space Telescope has taken over 1.5 million observations over the past 32 years. One of them is the breathtaking Nebula known as Mystic Mountain.
This image, which is even more dramatic than fiction, captures the chaotic activity atop a pillar of gas and dust, three light-years tall, which is being eaten away by the brilliant light from nearby bright stars. The pillar is also being assaulted from within, as infant stars buried inside it fire off jets of gas that can be seen streaming from towering peaks.
In this video, Dr. Ken Carpenter takes us on a journey through the Nebula, teaching us some of the interesting science behind this famous Hubble image.
2
views
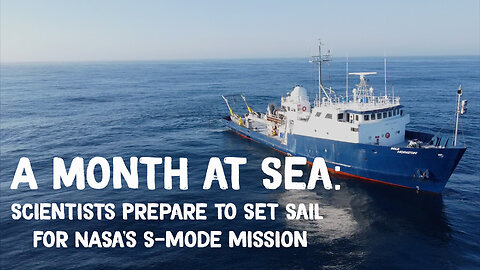
A Month at Sea: Scientists Prepare to Set Sail for NASA’s S-MODE Mission
In early October, the research vessel Bold Horizon set sail from Newport, Oregon, and joined a small fleet of planes, drones, and other high-tech craft chasing the ocean’s shapeshifting physics. NASA’s Sub-Mesoscale Ocean Dynamics Experiment (S-MODE) looks at whirlpools, currents, and other dynamics at the air-sea boundary. The goal is to understand how these dynamics drive the give-and-take of nutrients and energy between the ocean and atmosphere and, ultimately, help shape Earth’s climate.
1
view
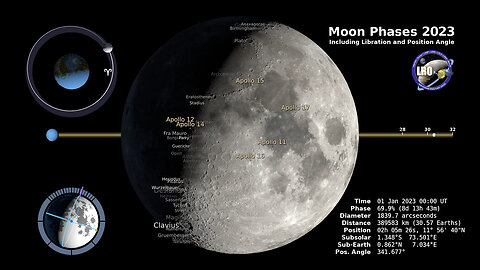
2023 Moon Phrases-Northern Hemisphere
The Moon always keeps the same face to us, but not exactly the same face. Because of the tilt and shape of its orbit, we see the Moon from slightly different angles over the course of a month. When a month is compressed into 24 seconds, as it is in this animation, our changing view of the Moon makes it look like it's wobbling. This wobble is called libration.
1
view
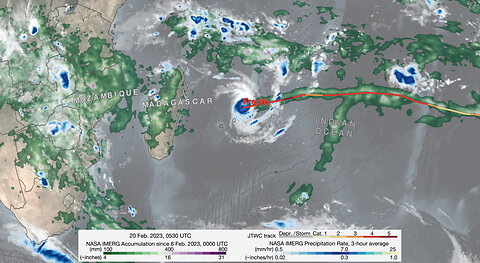
NASA Tracks Freddy, Longest-lived Tropical Cyclone on Record
longest-lived tropical cyclone in recorded history, Freddy set the record for having the highest accumulated cyclone energy (ACE) of any storm in history. ACE is an index used to measure the total amount of wind energy associated with a tropical cyclone over its lifetime.
NASA’s IMERG satellite precipitation product is ideal for monitoring and studying tropical cyclones around the world, especially over the open ocean where ground-based observations are sparse. IMERG uses precipitation estimates from a constellation of satellites united by the GPM Core Observatory to generate maps of global precipitation updated every 30 minutes in near real-time. The above animation shows IMERG surface rainfall estimates associated with the passage of Tropical Cyclone Freddy across the Indian Ocean as well as Freddy’s corresponding track and intensity. The animation begins at on Feb. 6, 2023, just before Freddy is about to form northwest of Australia. Over the course of the storm’s history, IMERG reveals a variety of precipitation features and trends that relate closely to the variations in Freddy’s intensity.
Tropical cyclones derive their energy from latent heating, which comes primarily from cloud condensation. Although essentially undetectable directly, the most significant latent heat release occurs within deep convective towers, which are associated with high cold cloud tops and areas of heavy rain at the surface. The IMERG animation illustrates this association between increased surface rain intensity and storm intensity - whenever Freddy undergoes a period of intensification, it is preceded by an increase in heavy rain. However, for the storm to really respond to the latent heating, that heating must occur near the storm’s center. For example, IMERG shows heavier rain on Feb. 8, but it is too far north of the center, and Freddy continues to weaken. Conversely, an absence of heavy rain near the center typically causes the storm to weaken. IMERG is also able to broadly resolve Freddy’s structure over the course of its lifetime, ranging from a highly asymmetrical rain field with most of the rain located on one side of the center, which occurs when the storm is weak or undergoing wind shear, to symmetrical when the storm is stronger, to having a full eye when the storm has an intense and well-developed circulation.
The end of the animation shows the total estimated rainfall for the entire period. IMERG shows that although heavy rain near the core of the storm is key to the storm maintaining or increasing in intensity, the highest overall rainfall totals are much more closely correlated to slow storm speed as evidenced by the extreme rainfall totals over Mozambique despite Freddy having weakened to a tropical storm. Here Freddy essentially stalls out for several days (Feb. 24 to March 2), allowing a sizeable portion of the storm’s circulation to remain over the warm waters of the Mozambique Channel and rainbands to continuously form and move inland. The result is rainfall totals on the order of ~16 to 31 inches (~400 to 800 mm, shown in purple) over parts of southern Mozambique and along the coast. Peak rainfall totals over Madagascar, where Freddy moved steadily across the island, are on the order of ~16 inches (400 mm). According to the latest media reports Freddy has been responsible for over 300 deaths in Mozambique, Madagascar and Malawi, and has caused widespread damage throughout these regions.
12
views
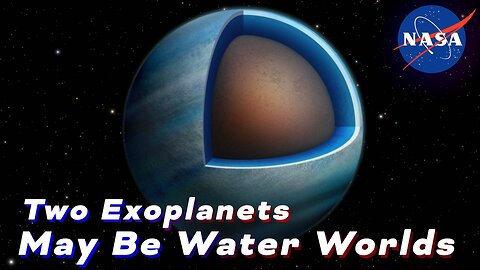
Two Exoplanets May Be Water Worlds
Using data from NASA’s Hubble and Spitzer Space Telescopes, astronomers have found evidence that two exoplanets orbiting a star 218 light-years away are “water worlds,” where water makes up a large fraction of the entire planet.
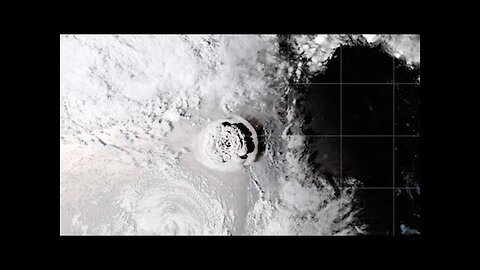
How NASA Sees the Life Cycle of Volcanic Island Hunga Tonga-Hunga Ha’apai
When the Hunga Tonga-Hunga Ha’apai volcano erupted on Jan. 15, it sent a tsunami racing around the world and set off a sonic boom that circled the globe twice. The underwater eruption in the South Pacific Ocean also blasted an enormous plume of water vapor into Earth’s stratosphere – enough to fill more than 58,000 Olympic-size swimming pools. The sheer amount of water vapor could be enough to temporarily affect Earth’s global average temperature. So outside of its sheer magnitude, what makes this eruption so unique? Well, it’s really a matter of our ability to see it through NASA and ESA satellites

Drought in the Horn of Africa
According to a July 29 2022 report from the International Food Security and Nutrition Working Group, the worst drought conditions in 70 years across the Horn of Africa have more than 16 million people coping with a shortage of drinking water. Yields of key crops are down for the third year in a row, milk production is in decline, and more than 9 million livestock animals have been lost due to a lack of water and suitable forage land. At the same time, regional conflicts, COVID-19, locusts, and the Ukraine War have caused price spikes and shortages of basic commodities. An estimated 18 to 21 million people now "face high levels of acute food insecurity" in Ethiopia, Kenya, and Somalia.
These animations depict root zone and surface soil moisture observations and forecasts from the NASA Hydrological Forecast and Analysis System (NHyFAS). Reds depict areas with soil moisture percentages below the average, while blues reflect areas that are above average (often due to passing storms). The first 27 seconds of the animation show soil moisture from August 2020 through June 2022. The final 10 seconds show forecasts for July through December 2022, including the next rainy season. Root zone moisture is critical for long term crop growth. New seedlings are mostly dependent on surface water, but then as plants grow and sink deeper roots, they are sustained by moisture in the top layer of the soil.
4
views
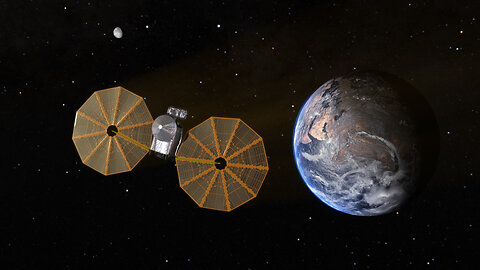
Lucy Spacecraft Will Slingshot Around Earth
NASA’s Lucy mission is heading to the Jupiter Trojans – two swarms of primitive asteroids trapped in Jupiter’s orbit that may hold clues to the formation of the planets. Lucy launched on October 16, 2021. After a year in orbit around the Sun, it is returning home on its launch anniversary for the first of three Earth gravity assists. On October 16, 2022, Lucy will fly by the Earth like a partner in a swing dance, boosting its speed and elongating its orbit around the Sun.
At 7:04 am, Eastern Time, Lucy will make its closest approach at just 219 miles above the planet: lower than the International Space Station. This exceptionally close shave will increase its velocity by 4.5 miles per second, setting Lucy on track to gain even more speed when it returns to Earth for its second gravity assist in December 2024.
Hubble Science: Hubble Constant, An Expanding Universe
When the Hubble Space Telescope launched, one of its main goals was to measure the rate at which our universe is expanding.
That rate is called the “Hubble Constant” – named after the astronomer Edwin Hubble, who contributed to the discovery of the universe’s expansion.
Using the Hubble Space Telescope, astronomers have been able to measure the Hubble Constant and even found out that the expansion rate of our universe is accelerating due to a mysterious force known as dark energy.
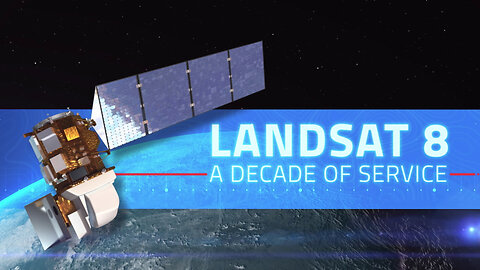
Landsat 8 - A Decade of Service
This February marks the 10th anniversary of the launch of Landsat 8, launched by NASA in 2013 and operated by the US Geological Survey. Equipped with its Operational Land Imager (OLI) and Thermal Infrared Sensor (TIRS) onboard instruments, Landsat 8 represented a significant advance in remote sensing technology and was the first to allow everyone in the world fully free and open access to its data from first light. In celebration of a decade of service, let’s take a look back at some of the remarkable ways Landsat 8 has fundamentally altered the way we see our world.

Leaders In Lidar | Chapter : 2 Go Back To Mars
Scientific Visualization Studio
5062: Active Region AR13182 launches an X1.2 Class Solar Flare - January 6, 2023
14265: TESS 2022 Sky Views
Leaders in Lidar
Released Thursday, January 19th, 2023
Updated Wednesday, May 3rd, 2023 at 11:43AM
Visualizations by:
Ryan Fitzgibbons
Written by:
Ryan Fitzgibbons
Edited by:
Ryan Fitzgibbons
Scientific consulting by:
Ryan Fitzgibbons,
James Garvin, and
Thomas A. Neumann
Interviewees:
Bryan Blair,
David E. Smith,
James Abshire,
Jan McGarry,
Jay Zwally,
Ralph Dubayah,
Scott Luthcke,
Thomas A. Neumann, and
Xiaoli Sun
View full credits
In this series, we dive into the legacy of Goddard's lead role in developing laser altimetry, which has revolutionized the way we map our planet, the Moon and other planets. Each chapter looks at the successes and failures of these lidar instruments, beginning with the Mars Observer Laser Altimeter in the late 1980s, through the current generation of laser altimeters on ICESat-2 and GEDI. Through dozens of interviews and archival footage, the history, challenges and legacy of lidar are uncovered.
Leaders in Lidar series teaser in standard format.
Music: "The Archives," Universal Production Music.
Complete transcript available.
Chapter 1: The Laser Is Better
The scientists and engineers at Goddard Space Flight Center embark on a new technological and scientific journey, building and sending a laser altimeter to Mars with the MOLA-1 Instrument.
Music: "Fragment," "Chasing Lights," "Charming Noise," "Steady Pace," "The Cage," "Taking It All In," "The Archives," "Intriguing Coincidence," "Everyday Stories," Universal Production Music
Complete transcript available.
Video Descriptive Text available.
Note on footage used: 00:03-00:09 provided by pond5.
Chapter 2: Go Back to Mars
After the devastating loss of Mars Observer, the Goddard team mourns and regroups to build a second MOLA instrument for the Mars Global Surveyor mission. But before they send their laser altimeter to Mars, the team seizes an opportunity to test it on the Space Shuttle.
6
views
Leaders In Lidar | Chapter 4: All the Easy Missions Are Done
The Goddard team recounts the challenging paths that lead to the current lidar missions, the Global Ecosystems Dynamics Investigation (GEDI) and ICESat-2, which look to measure changes on our planet.
Leaders In Lidar | Chapter 3: Take the Next Steps
Riding on the success of MOLA, the Goddard team develops new lidar instruments for Earth, the Moon and Mercury. Each new instrument is a major leap forward in technology and scientific ambition and equally fraught with challenges.
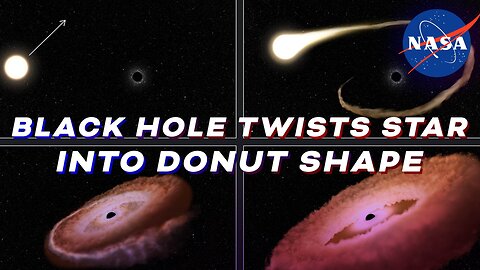
Hubble Finds Hungry Black Hole Twisting Captured Star Into Donut Shape
“Solar Eclipse” by Alexander Ryder Mcnair [ASCAP] and Harry Gregson Williams [BMI] via Atmosphere Music Ltd. [PRS] and Universal Production Music.
Master Version
Horizontal version. This is for use on any YouTube or non-YouTube platform where you want to display the video horizontally.
5
views