

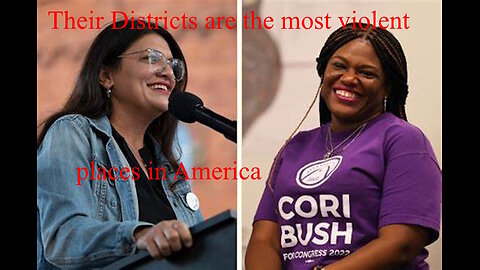
Creepy old man Sam Seder is worried about guns, his voters are the problem Part IIIA
TITLE: Creepy old man Sam Seder is worried about guns Part III
The following is a follow-up & continuation of https://web.archive.org/web/20230724234657/https://professor_enigma.webs.com/sam-seder-ilhan-omar-racism https://web.archive.org/web/20220608034416/https://professor_enigma.webs.com/sam-seder-ilhan-omar-racism2 https://web.archive.org/web/20220608034411/https://professor_enigma.webs.com/sam-seder-ilhan-omar-racism3 https://rumble.com/v3zu11r-creepy-sam-seder-is-worried-about-guns-his-voters-are-the-problem-part-ii.html https://rumble.com/v3vdj4w-creep-sam-seder-is-worried-about-guns-his-voters-are-the-problem-part-i.html
https://web.archive.org/web/20230801020040/https://professor_enigma.webs.com/covid-increase-homicides LOTS of County data, counties sans murders
See https://www.facebook.com/permalink.php?story_fbid=pfbid026vNKpPdMHW9ftUpYPHKxko2aYLrEvTZVZrEGtybjW5stz7QSu356xUU8Lvb2j2n2l&id=100064869933577 for the entire compendium of information on this topic, I will continue to update it & add to it.
Most of the cities I covered there will be contestants again, along with numerous other jurisdictions, along w/ their voting preferences https://web.archive.org/web/20220608034412/https://professor_enigma.webs.com/old-fart-rants-5 & who they send to the statehouse. I will focus solely on State House Districts. https://uselectionatlas.org/ https://www.zipdatamaps.com/politics/state-level/districts/map-of-california-state-assembly-districts https://ballotpedia.org/California_state_legislative_districts (plug in the state you need to look at) I will also try to post data on their Mayor, as well as City Council, assuming the elections are partisan or we find out they’re a Democrat running in a “nonpartisan” jungle primary.
I will screenshot (and eventually post on Facebook) https://www.facebook.com/media/set/?set=a.230733335765663&type=3 all the cities & their number of murders 2016-22, but on this document will only post 2020-22 murders. I will use FBI data https://cde.ucr.cjis.gov/LATEST/webapp/#/pages/explorer/crime/query & if I am using state or local data, I will link to that as well & post it separately. I may also use state or local data to fill in missing/obviously inaccurate data from the FBI.
All population data can be found https://www.biggestuscities.com/ https://www.census.gov/quickfacts/fact/table/US/PST045222 & if I get really desperate, I might go to that garbage can known as Wikipedia & find an archived page, but I doubt I will need that. I may also use https://www.census.gov/data/datasets/time-series/demo/popest/2020s-counties-total.html https://www.census.gov/data/datasets/time-series/demo/popest/2010s-counties-total.html if I need County or National data.
Keep in mind, some of these cities have shrunk so much that they are not large enough (and some of this depends on how many House Districts a state has, Iowa has 100 w/ a small population & NH has a lot, TX has a lot fewer) to control a State House District.
I will also (if applicable) toss in their Mayor & City Council, as that will tell us more about the lunatics being elected there. This will be a long, wild ride, buckle up. Sam Seder cries about guns a lot, but his voters are the problem & We The People need our firearms to protect our children from Sam’s mentally ill followers, just in case there are more than one attempting to attack us.
Any data for certain Iowa cities has already been posted here https://rumble.com/v268b7a-divorcee-sam-seder-vs.-utubekookdetector-iowa-homicide.html
I will also post statewide data afterwards as many states will feature several cities. I will also tally the aggregate for all the cities covered in that state so you can compare. Let us begin!
***
U.S. population 2020-22 = 996,768,392 * Murders 2020-22 = 65,262 * U.S. murder rate 2020-22 = 6.547 per 100,000 * U.S murder rate 2016-19 = 5.2 per 100,000
I’m not sure Sam Seder #samseder #majorityreport is smart enough to exhibit guile, but it appears to me that from 2020-22 the murder rate is much higher than 2016-19 & even though it dipped in 2022, in the problem areas it’s still way beyond the 4 years prior to the Saint George Floyd riots.
Los Angeles City, CA: 2020 & 2022 murders = 738 (2021 = 397) Population 2020-22 = 11,570,302 & that is a murder rate of 9.809 per 100,000.
Murder data (other than FBI) https://www.dailynews.com/2022/01/13/homicides-up-nearly-12-percent-in-los-angeles-last-year/ https://xtown.la/2022/01/10/los-angeles-murders-2021/
L.A. County votes Democrat two-to-one & Los Angeles City is even more lopsided than that, I guarantee it. All their State House Districts are Democrat & have been for some time. Their Mayoral elections are partisan & Democrats have dominated for quite some time. https://mayor.lacity.gov/ https://en.wikipedia.org/wiki/List_of_mayors_of_Los_Angeles https://www.zipdatamaps.com/politics/state-level/districts/map-of-california-state-assembly-districts https://ballotpedia.org/California_state_legislative_districts https://ballotpedia.org/California_State_Assembly
[NOTE: See Ballotpedia’s Notes for each District. The big map they display *currently* is the situation of Districts *prior to* the redistricting. There will be a map displaying the new location, but you cannot drill down on it as you can the big map, to see if a District goes inside the city limits of a certain jurisdiction. However, this is still good because you can see many of these Districts that I’m covering have been uber-Democrat for many years. See the “Redistricting” page for each state, you can compare Districts before &after]
Compton, CA: 2020-22 murders = 73 * Population 2020-22 = 281,297 & a murder rate of 25.951 per 100,000
Murder data https://lasd.org/wp-content/uploads/2023/01/Transparency_Patrol-CurrentMonth-YTD_012623-1.pdf (2021 data) https://lasd.org/transparency/crimeandarrest/#comparison
https://ballotpedia.org/California_State_Assembly_District_65 (and see previous links) https://www.comptoncity.org/our-city/elected-officials (are there enough “people of color” on Compton’s City Council?)
Stockton, CA: 2020-22 murders = 137 * Population 2020-22 = 964,743 & a murder rate of 14.2 per 100,000
Murder Data (other than FBI) http://ww1.stocktonca.gov/en/Departments/Police/News-and-Information/Statistics Stockton PD says 143 murders from 2020-22 = 14.822 murders per 100,000.
https://ballotpedia.org/California_State_Assembly_District_13 Many times in California you have two Democrats squaring-off in the general, due to their jungle primary format. If nobody hits 50% plus one vote, the top two move on to the general.
https://ballotpedia.org/Kevin_Lincoln_II Stockton’s current Mayor is a Republican surprisingly. https://en.wikipedia.org/wiki/Mayor_of_Stockton,_California The city elections are technically nonpartisan, but since 1990 it has gone back & forth between the GOP & the Dums. Stockton City votes overwhelmingly for Democrats in statewide elections (U.S. Senate & Gubernatorial 2022, POTUS 2020).
Oakland, CA: 2020-22 murders = 345 * Population 2020-22 = 1,305,036 & a murder rate of 26.436
Murder data (other than FBI) https://cityofoakland2.app.box.com/s/sjiq7usfy27gy9dfe51hp8arz5l1ixad/folder/151302530704 https://cityofoakland2.app.box.com/s/sjiq7usfy27gy9dfe51hp8arz5l1ixad/file/903152951382 https://cityofoakland2.app.box.com/s/sjiq7usfy27gy9dfe51hp8arz5l1ixad/folder/126124687343
Oakland PD says 123 murders in 2021, 102 in 2020 & 120 in 2022. Deferring to local data (and that’s what I usually do unless I find something amiss, or the FBI is missing a year of data).
https://ballotpedia.org/Oakland,_California https://en.wikipedia.org/wiki/List_of_mayors_of_Oakland,_California Oakland has had a long string of Dumocrat Mayors https://ballotpedia.org/California_State_Assembly_District_18
San Francisco, CA: 2020-22 murders = 161 * Population 2020-22 = 2,497,597 & a murder rate of 6.446 per 100,000. This is lower than the national average, but I am including the County because their murders have surged since 2020 & people are fleeing this dunghole.
California AG https://data-openjustice.doj.ca.gov/sites/default/files/2023-06/Homicide%20In%20CA%202022f.pdf says 161 murders 2020-22. FBI missing data for 2021
https://ballotpedia.org/San_Francisco,_California https://en.wikipedia.org/wiki/Mayor_of_San_Francisco https://ballotpedia.org/California_State_Assembly_District_17
Dave Leip’s data indicates that San Francisco County is one of the most Democrat-dominated cities in these United States.
Inglewood, CA: 2020-22 murders = 44 (2021 data missing, filling it in w/ data below) * 2020-22 population = 316,561 & a murder rate of 13.899
https://homicide.latimes.com/neighborhood/inglewood/year/all This website says 13 murders in 2021 in Inglewood. Inglewood PD is useless
https://en.wikipedia.org/wiki/List_of_mayors_of_Inglewood,_California https://joinjamesbutts.com/endorsements/ Assembly District 61 gobbles up Inglewood & prior to redistricting (that was District 62) that area was Democrat. I cannot find anything definitive on James T. Butts, current & longtime Mayor of Inglewood, but it’s likely that he’s on the Leninist side of the aisle considering the nutcases who have endorsed him.
Rudy Giuliani cleaned up NYC & made it habitable. Mr. Butthead has not yet been able to lower the murder rate in Inglewood. Ala Dalton from Road House, “It’s going to get worse, before it gets better.”
(See links for Lancaster) Inglewood is a city that votes about 80% (at least) Democrat in statewide elections.
Lancaster, CA: 2020-22 murders = 48 (2021 data missing, filling it in w/ data below) * 2020-22 population = 512,846 & a murder rate of 9.359
https://homicide.latimes.com/neighborhood/lancaster/year/all Credits Lancaster w/ 19 murders in 2021
Assembly District 39 (and 36 prior to the Census) covers Lancaster & more, it’s Democrap. However, District 36 was GOP controlled prior to redistricting. Remember, Assembly Districts are massive & Lancaster is not big enough by itself to control a District.
https://ballotpedia.org/California%27s_25th_Congressional_District_election,_2016#Endorsements https://ballotpedia.org/California%27s_25th_Congressional_District_special_election,_2020_(March_3_top-two_primary) https://en.wikipedia.org/wiki/R._Rex_Parris Lancaster’s current & longtime Mayor Rex Parris identifies as a Republican, but has endorsed Democrats. Looking at some of his political positions, maybe he would be better suited in the Democrat or Green Party. I think he wins in Lancaster because he is a huge squish. Anyways…
https://www.sos.ca.gov/elections/prior-elections/statewide-election-results/general-election-nov-8-2022/statement-vote https://elections.cdn.sos.ca.gov/sov/2022-general/ssov/us-senate-by-political-districts-ft.xlsx https://www.sos.ca.gov/elections/prior-elections/statewide-election-results/general-election-november-3-2020/statement-vote https://elections.cdn.sos.ca.gov/sov/2020-general/ssov/pres-by-political-districts.xlsx https://elections.cdn.sos.ca.gov/sov/2022-general/ssov/governor-pol-districts.xlsx https://www.sos.ca.gov/elections/prior-elections/statewide-election-results Lancaster voted for Alex Padilla over Mark P. Meuser (2022 U.S. Senate), Biden won Lancaster City by a massive margin in 2020 & Gavin Newsom also won the city in 2022, although the latter was much closer. Hillary Clinton easily won the city over Donald Trump. Wash, rinse, repeat.
Lynwood, CA: 2020-22 murders = 16 (2021 data omitted, using below to fill in) * 2020-22 population = 196,847 & a murder rate of 8.128
https://homicide.latimes.com/neighborhood/lynwood/year/all 4 murders in 2021, using that to fill in missing 2021 data
https://katieporter.com/katie-porters-senate-bid-endorsed-by-lynwood-mayor-oscar-flores/ https://en.wikipedia.org/wiki/List_of_mayors_of_Lynwood,_California Lynwood has had a boatload of Mayors because the City Council votes for Mayor, which I think is honestly a better system for small cities. Just my two cents. Their current Mayor endorsed Katie Porter, so he’s an idiot. It’s difficult to find data on these Council members & I am not going to waste the time.
Lynwood City votes overwhelmingly for Democrats in statewide elections.
Carson, CA: 2020-22 murders = 25 (2021 is omitted, filled in below) * 2020-22 population = 281,476 & a murder rate of 8.881
https://homicide.latimes.com/neighborhood/carson/year/all 10 murders for Carson in 2021
https://en.wikipedia.org/wiki/List_of_mayors_of_Carson,_California https://lauraforca.com/endorsements/ https://ballotpedia.org/Laura_Richardson https://ballotpedia.org/Albert_Robles_(California) Carson’s current Mayor endorsed Laura Richardson, so she needs her head examined & their previous Mayor is a Dumocrat. Carson typically votes Democrat 3-to-1 in statewide elections. Assembly District 69 engulfs Carson & it is Democrat. District 64 covered it prior to the Census & it was Dumocrat then as well.
California statewide: 2020-22 murders = 6,780 * 2020-22 population = 117,710,578 & a murder rate of 5.759 per 100,000
CA State Data says 6,769 murders
Murder rate in California OUTSIDE the cities (Carson, Los Angeles, Lynwood, Compton, Stockton, Lancaster, San Francisco, Inglewood, Oakland) I covered is (population = 99,783,873 & 5,193 murders) 5.204 per 100,000
Milwaukee City, WI: 2020-22 murders = 600 * Population 2020-22 = 1,709,860 & a murder rate of 35.09 per 100,000
https://archive.ph/Q5M1B https://city.milwaukee.gov/police/Information-Services/Crime-Maps-and-Statistics Milwaukee PD says 600 murders as well.
https://en.wikipedia.org/wiki/List_of_mayors_of_Milwaukee https://ballotpedia.org/Milwaukee,_Wisconsin https://www.zipdatamaps.com/politics/state-level/districts/map-of-wisconsin-state-assembly-districts https://ballotpedia.org/Wisconsin_state_legislative_districts https://ballotpedia.org/Wisconsin_State_Assembly Despite their Mayoral elections being nonpartisan, Milwaukee has had a lot of mayors associated w/ the Dumbasscrat Party. The 11 Wisconsin State House Districts that are part of Milwaukee (9, 19, 11, 18, 16, 10, 17, 12, 8, 7 & 20) are all Democrat currently & also were before the 2020 elections. Surprised? According to Dave Leip, in all statewide elections since 2018, Milwaukee City voted >78% for the Dumocrat.
Milwaukee is a very dangerous place & it’s all Democrat, all the time. Just as Los Angeles City skews more Democrat than Los Angeles County, Milwaukee City is an uber-Democrat city inside an uber-Democrat county.
Kenosha City, WI: 2020-22 murders = 27 * 2020-22 population = 297,749 & a murder rate of 9.068
https://www.doj.state.wi.us/dles/bjia/ucr-offense-data WI State Data concurs 27 murders
https://www.wisconsinhistory.org/Records/Article/CS4900 https://en.wikipedia.org/wiki/List_of_mayors_of_Kenosha,_Wisconsin https://www.breitbart.com/politics/2020/08/24/nolte-add-kenosha-to-growing-list-of-democrat-run-cities-engulfed-in-violence/ WI State Assembly Districts 64 & 65 cover Kenosha, both are Dummycrat – that was the case prior to redistricting. Longtime Kenosha Mayor John Antaramian is a Democrat. Not sure about Keith Bosman, but I would NOT be surprised if he were a Regressive lunatic.
According to Dave Leip, Kenosha City voted Democrat in every statewide election since 2016, the Democrat got at least 55.5% of the vote (Hillary had the lowest) in every contest. Kenosha County is a lean Republican County, Kenosha City goes the other way.
Wisconsin statewide: 2020-22 murders = 954 * 2020-22 population = 17,666,365 & a murder rate of 5.4
WI State Data says 957 murders statewide. Does retard Sam Seder see how WI has a much higher murder rate 2020-22 than 2016-19?
Murder rate in WI OUTSIDE of Kenosha City & Milwaukee City is (population = 15,658,756 & 327 murders) a paltry 2.088 per 100,000. This disparity would get even larger if I included all of Milwaukee County, which overwhelmingly votes Democrat.
Even a mouth breather like Sam Seder can now see the American Crime Wave in Wisconsin is confined to a very small portion of the state. We need not (and it won’t happen) disarm mostly white, rural WI counties because hood rats in Kenosha City & Milwaukee County like to kill each other.
Wilmington, DE: 2020-22 murders = 88 * 2020-22 population = 213,212 & a murder rate of 41.273 (per 100,000) Hey Sam Seder, is there a mythical crime wave in Kid Sniffer Joe Biden’s hometown or not? After you get done getting off thinking about male predators in the girls’ locker room at the local pool, answer that – would you fat ass?
https://www.wilmingtonde.gov/home/showpublisheddocument/11262/638083475917070000 https://www.wilmingtonde.gov/government/public-safety/wilmington-police-department/compstat-reports https://www.wilmingtonde.gov/home/showpublisheddocument/9849/637462295684930000 Wilmington PD says 88 murders also
https://www.zipdatamaps.com/politics/state-level/districts/map-of-delaware-state-house-of-representative-districts https://ballotpedia.org/Delaware_House_of_Representatives https://ballotpedia.org/Delaware_state_legislative_districts As you can see from the map, the Representatives that Wilmington sends to Dover each legislative session are all Dummycrats. It has been this way for a while.
https://en.wikipedia.org/wiki/List_of_mayors_of_Wilmington,_Delaware Wilmington’s Mayoral elections are partisan & the Democrats have dominated for a long time.
Delaware statewide: 2020-22 murders = 219 * 2020-22 population = 3,013,160 & a murder rate of 7.268
Murder rate in DE OUTSIDE of Wilmington = (population = 2,799,948 & 131 murders) 4.678 per 100,000
Cleveland, OH: Cleveland murders 2020-22 = 472 * Population 2020-22 = 1,102,230 & murder rate of 42.822
https://dpsoibrspext.azurewebsites.net/ Ohio State Data says Cleveland had 477 murders, which would push the average to 43.275. YIKES!
https://www.zipdatamaps.com/politics/state-level/districts/map-of-ohio-state-house-of-representative-districts https://ballotpedia.org/Ohio_House_of_Representatives https://ballotpedia.org/Ohio_state_legislative_districts https://en.wikipedia.org/wiki/Mayor_of_Cleveland https://ballotpedia.org/Redistricting_in_Ohio_after_the_2020_census https://ballotpedia.org/Cleveland,_Ohio Democrats dominate Mayoral elections in Cleveland & all the House districts that are within Cleveland’s city limits are Democrat. All Democrat, all the time in the war zone known as Cleveland.
Yet, Blacks are still slaughtering Blacks at a high rate there. Cuyahoga County typically votes 2-to-1 Democrat in statewide elections, Cleveland is even more lopsided than that. https://www.zipdatamaps.com/election-atlas/county/oh/cuyahoga-county/map-of-2020-presidential-election-results-by-voting-precinct
Akron, OH: Murders 2020-22 = 121 * Population 2020-22 = 568,272 & a murder rate of 21.292
Ohio State Data says 136 murders for Akron 2020-22, a murder rate of 23.932 per 100,000
See links for Cleveland on who Akron elects to represent them in Columbus each legislative session. https://ballotpedia.org/Ohio_House_of_Representatives_District_33 https://en.wikipedia.org/wiki/List_of_mayors_of_Akron,_Ohio Democrats do very well in murder-laden Akron, I wonder why?
Summit County is a lean-Democrat country, Akron City is dominant Democrat. However, Mike DeWine did win that county in 2022. In 2022, DeWine still lost Akron City by over 8,000 votes in a wave election against Democrats. https://www.ohiosos.gov/elections/election-results-and-data/ In 2020, Kid Sniffer Biden won Akron easily.
https://www.zipdatamaps.com/election-atlas/county/oh/summit-county/map-of-2020-presidential-election-results-by-voting-precinct
Toledo, OH: Murders 2020-22 = 185 * Population 2020-22 = 805,689 & a murder rate of 22.961
OH state data gives Toledo 195 murders 2020-22, which is a rate of 24.202
https://ballotpedia.org/Ohio_House_of_Representatives_District_44 https://ballotpedia.org/Toledo,_Ohio https://en.wikipedia.org/wiki/List_of_mayors_of_Toledo,_Ohio Toledo Mayoral races are non-partisan, but their current Mayor is associated with the Democrats & their previous Mayor was an elected Dummycrat in the OH State House. DeWine still lost Toledo in 2022. Toledo is a Democrat-dominated city in a lean-Democrat county (Lucas). https://www.zipdatamaps.com/election-atlas/county/oh/lucas-county/map-of-2020-presidential-election-results-by-voting-precinct Biden won Toledo City easily in 2020.
Dayton, OH: Murders 2020-22 = 112 * Population 2020-22 = 411,139 & a murder rate of 27.241
OH State data tallies 111 murders 2020-22, a rate of 26.998
https://en.wikipedia.org/wiki/Politics_of_Dayton,_Ohio https://www.daytonohio.gov/548/Meet-the-Mayor https://ballotpedia.org/Ohio_House_of_Representatives_District_38 Nan Whaley, the previous Mayor of Dayton was the Dumocrat nominee for Governor in 2022. Their current Mayor is a Dumocrat too. Look at the archived maps of each state, (Ballotpedia updates their maps each redistricting OR look at the redistricting page for each state, https://ballotpedia.org/Redistricting_in_Ohio_after_the_2020_census you will get maps aplenty) you can see who dominated prior to redistricting.
Dayton has lost so much population over the past few decades; they cannot even carry Montgomery Co. anymore. Too bad, so sad. Dayton City still overwhelmingly voted for Nan Whaley in 2022 & Biden in 2020. https://www.zipdatamaps.com/election-atlas/county/oh/montgomery-county/map-of-2020-presidential-election-results-by-voting-precinct
Cincinnati, OH: Murders 2020-22 = 259 * Population 2020-22 = 928,009 & a murder rate of 27.909
OH State Data says 262 murders 2020-22, a rate of 28.232
All the State House Districts encircling Cincy are Democrat. All State House Districts prior to the 2020 Census were Democrat in Cincinnati (remember, some districts that were part of Cincy prior to 2020 may have moved to a much different section of the state after redistricting). Hamilton is a lean Dumocrat county but has swung back a few times to the GOP. Cincy’s Mayors are typically Dumocrats. DeWine lost Cincy by a more than a 2-to-1 margin & Biden won it easily as well https://www.zipdatamaps.com/election-atlas/county/oh/hamilton-county/map-of-2020-presidential-election-results-by-voting-precinct https://en.wikipedia.org/wiki/List_of_mayors_of_Cincinnati https://ballotpedia.org/Cincinnati,_Ohio
Columbus, OH: Murders 2020-22 = 507 * Population 2020-22 = 2,720,338 & a murder rate of 18.637 per 100,000.
OH state data says 513 murders 2020-22 & a rate of 18.857 per 100,000
Columbus is a perfect example of Sam Seder’s stupidity. Their 2022 murder rate is much lower than 2020-21, but the 2020-22 rate is much higher than the prior 4 years & 2022 is higher than 2018-19. They have yet to return to the pre-George Floyd, “let us riot for a drug addict” baseline.
There is one House District that (as far as I can see) punches across Columbus’ city limits (see links for Cleveland) that the GOP won, but most of that District is outside Columbus. The rest of the House Districts that cover Columbus (3 & I may be wrong about that) are Democrat.
In all statewide elections since 2016, Franklin Co. has voted Dumocrat & Columbus leans more Democrat than the county. https://en.wikipedia.org/wiki/List_of_mayors_of_Columbus,_Ohio https://ballotpedia.org/Columbus,_Ohio https://www.zipdatamaps.com/election-atlas/county/oh/franklin-county/map-of-2020-presidential-election-results-by-voting-precinct It has been almost a quarter-century since Columbus elected a Mayor (and the elections are non-partisan, but we know which political party these clowns are associated with) that was associated w/ the GOP.
Youngstown, OH: Murders 2020-22 = 49 * 2020-22 Population = 179,470 & a murder rate of 27.302
OH State Data is incomplete for Youngstown, no data for 2020.
https://ballotpedia.org/Ohio_House_of_Representatives_District_59 https://en.wikipedia.org/wiki/List_of_mayors_of_Youngstown,_Ohio DeWine lost Youngstown City in 2022. The only OH House District that encompasses Youngstown is Democrat-controlled & their non-partisan Mayors tend to be Democrats. Surprise! https://www.zipdatamaps.com/election-atlas/county/oh/mahoning-county/map-of-2020-presidential-election-results-by-voting-precinct Joe Biden also cleaned up in the 2020 POTUS vote tally in Youngstown City
Ohio statewide: 2020-22 murders = 2,421 * 2020-22 population = 35,319,774 & a murder rate of 6.854
https://ocjs.ohio.gov/research-and-data/data-reports-and-dashboards/crime-data OH State Data says 2,800 cases of “homicide” January 2020-December 2022. I downloaded the Excel & this does include justifiable homicides & negligent manslaughter. When you download the Excel it DOES NOT tell you that, but you can see it on the graph.
Murder rate in Ohio OUTSIDE of the cities I covered (Columbus, Akron, Toledo, Cincinnati, Youngstown, Dayton, Cleveland) = only 2.503 per 100.000. Hey Sam Seder, what do you think of that old man? (population = 28,604,627 & 716 murders)
Memphis, TN: 2020-22 murders = 867 * Population 2020-22 = 1,880,722 & a murder rate of 46.099 per 100,000 (!)
https://www.tn.gov/tbi/divisions/cjis-division/recent-publications.html Tennessee State Data pegs Memphis’ murder rate at 45.992 per 100,000 (865 murders 2020-22)
Memphis is another example making Creepy old man Sam Seder look dumb. Their murder rate for 2022 was much lower than the previous two years, but still much higher the 2016-19 time frame. Whoops!
https://ballotpedia.org/Tennessee_House_of_Representatives https://ballotpedia.org/Tennessee_state_legislative_districts https://en.wikipedia.org/wiki/List_of_mayors_of_Memphis,_Tennessee https://ballotpedia.org/Memphis,_Tennessee Memphis’ Mayoral elections are nonpartisan, but their current Mayor Paul Young is a Democrat & so were the previous 2 clowns. Of all the TN State House Districts that are (86, 88, 91, 93, 96, 97) all or part of Memphis, only one is GOP currently & most of that District is outside Memphis.
Shelby County is staunch Democrat, most of that is because of Memphis, one of the very few Dumocrat strongholds in The Volunteer State. https://www.zipdatamaps.com/election-atlas/county/tn/shelby-county/map-of-2020-presidential-election-results-by-voting-precinct Donald Trump won very few precincts in Memphis back in 2020 & the ones that Biden won were usually in the 80% range.
Nashville, TN (aka Davidson County): Murders 2020-22 = 298 * Population 2020-22 = 2,051,927 & a murder rate of 14.522
TN State Data credits Nashville w/ 308 murders 2020-22, equaling a rate of 15.01. Want local Nashville (which is not up to date) data? https://www.nashville.gov/departments/police/news-and-reports/crime-statistics/nashville-crime-statistics
https://ballotpedia.org/Nashville,_Tennessee https://en.wikipedia.org/wiki/List_of_mayors_of_Nashville,_Tennessee TN State House Districts (58, 59, 55, 51, 56, 54, 50, 60 & 52) that are all or part of Nashville – they’re all occupied by the Dums. Democrats win Davidson by 25-30% in statewide elections. In nonpartisan Mayoral elections, Democrats do well in Nashville.
Nashville is a war zone & Democrats do well there. Why is it the most violent places in uber-Republican TN are run by the Dums?
Knoxville, TN: 2020-22 murders = 109 (FBI data is always first) * Population 2020-22 = 579,265 & a murder rate of 18.816
TN State Data allocates 111 murders for Knoxville & a rate of 19.162
https://en.wikipedia.org/wiki/Mayoral_elections_in_Knoxville Of the three State House Districts (19, 15, 90) that are all or part of Knoxville, two are Democrat. Knoxville has not had a Mayor associated w/ the GOP since Bill Haslam won in 2007. I would check to see which Gubernatorial candidate won Knoxville City in 2022, but the TN results https://sos.tn.gov/elections/results do not make it clear which precinct locales are Knoxville proper & I am not going to spend an hour or so finding out. Sue me.
https://www.zipdatamaps.com/election-atlas/county/tn/knox-county/map-of-2020-presidential-election-results-by-voting-precinct (Compare the precinct names w/ the following links if you doubt the veracity of my claims) https://www.google.com/maps/d/viewer?mid=1v9pOg7-Eyo7PyfdlyynvNoeoHjM&ll=36.024303486468526%2C-83.93851000000001&z=11 https://www.knoxcounty.org/election/precincts_map.php Joe Biden won Knoxville City while losing Knox County. This happens often & I hope you can see that even a GOP-leaning county can have a high murder rate & that’s because of a Dummycrat-leaning city within it.
Chattanooga, TN: 2020-22 murders = 93 * 2020-22 Population = 547,256 & a murder rate of 16.993
TN State Data pegs Chattanooga’s 2020-22 murders at 92 & a rate of 16.811
Of the 3 TN House Districts (26, 28, 30) that are all or part of Chattanooga, two are GOP. Can you say gerrymandering? And yes, I would “gerrymander” – to the victor go the spoils. Clever of TN State Republicans to chop up the few Democrat strongholds in TN. District 28 is the most Chattanooga District & it is a Democrat occupying it. https://en.wikipedia.org/wiki/List_of_mayors_of_Chattanooga,_Tennessee Of the last 4 Chattanooga Mayors, two have been Independent, one GOP & one Dummycrat. https://www.zipdatamaps.com/election-atlas/county/tn/hamilton-county/map-of-2020-presidential-election-results-by-voting-precinct Dementia Biden did win Chattanooga City easily in 2020
Tennessee statewide: 2020-22 murders = 1,981 * 2020-22 population = 20,930,476 & a murder rate of 9.464
Murder rate in TN OUTSIDE of (Memphis, Nashville, Knoxville, Chattanooga) the cities I covered = (population = 15,871,306 & 614 murders) 3.868 per 100,000. The Crime Wave in TN is a Democrat Crime Wave
TN State Data says 1,989 murders 2020-22, pretty close to FBI data
Chicago, IL: 2020-22 murders = 1,745 (the 2021 total of 370 is likely horse manure) 2020-22 Population = 8,107,946 & a murder rate of 21.522 per 100,000. Even that bogus total yields a murder rate >3X the national average. I will elucidate better data below.
The Sun-Times https://graphics.suntimes.com/homicides/ says Chicago had 794 (!) murders in 2021. Hey Jackass https://heyjackass.com/category/chicago-crime-2021/ says it was 798. Chicago PD https://home.chicagopolice.org/wp-content/uploads/CompStat-Public-2022-Year-End-1.pdf https://home.chicagopolice.org/statistics-data/crime-statistics/ says there were 2,275 murders 2020-22 & 804 in 2021.
However, https://home.chicagopolice.org/statistics-data/statistical-reports/ I am not totally sure that they’re not including negligent manslaughter & justified homicides in that data. One of the notes says, “Crime statistics reflect Illinois Compiled Statutes and differ from the crime categories of the F.B.I. Uniform Crime Reporting System.”
State of Illinois data https://www.isp.illinois.gov/StaticFiles/docs/CrimeReporting/cii/cii21/Index%20Crime.pdf https://www.isp.illinois.gov/CrimeReporting/CrimeInIllinoisReports says Chicago had 370 murders (they separate negligent homicide & justified homicide) in 2021.
IL NIBRS Data https://ilucr.nibrs.com/Report/CrimeTrends is no help because no reporting was done for most of the time frame.
What to do? It is NOT likely that Chicago had a combined 434 cases of negligent murder/homicide & justified homicides in 2021, which is the difference from FBI & state data w/ Chicago PD data.
Since I have 3 sources (Hey Jackass, Chicago Sun-Times & Chicago PD) putting Chicago’s 2021 murders at 790+ & two sources (Illinois State Police & FBI) putting it at 370.
If I put the 2021 total at 794, Chicago’s murder rate 2020-22 was (2,169 murders) 26.751 per 100,000. YIKES!
https://ballotpedia.org/Illinois_House_of_Representatives https://ballotpedia.org/Illinois_state_legislative_districts https://en.wikipedia.org/wiki/Mayor_of_Chicago https://ballotpedia.org/Chicago,_Illinois https://www.zipdatamaps.com/politics/state-level/districts/map-of-illinois-state-house-of-representative-districts Do we really need to do this? Chicago is one of the most uber-Democrat enclaves in this declining nation. Chicago regularly votes >80% Democrat in statewide elections & their Mayors have been Democrats for almost a century. Even though it’s officially nonpartisan (since 1999), we all know those who win are registered Dummycrats, period. All Illinois State House Districts in Chicago proper are Democrat-controlled & there are lots of them.
St. Louis City, MO: 2020-22 murders = 662 * Population 2020-22 = 881,462 & the murder rate is 75.102 per 100,000 (!). St. Louis & its metro area en masse might be the most dangerous place in these United States. Black on black murder is common. #blacklivesmatter
https://showmecrime.mo.gov/CrimeReporting/CrimeReportingTOPS.html https://showmecrime.mo.gov/public/View/dispview.aspx?ReportId=199&MemberSelection_[Summary%20Jurisdiction%20by%20County].[Summary%20Jurisdiction%20by%20County%20Hierarchy]=MOSPD0000 MO State Data says St. Louis City had 664 murders 2020-22 (75.329 per 100,000)
https://ballotpedia.org/Missouri_state_legislative_districts https://ballotpedia.org/Redistricting_in_Missouri https://ballotpedia.org/Missouri_House_of_Representatives https://www.stlouis-mo.gov/government/about/stlouis-mayors.cfm https://en.wikipedia.org/wiki/Mayor_of_St._Louis https://ballotpedia.org/St._Louis,_Missouri https://www.zipdatamaps.com/politics/state-level/districts/map-of-missouri-state-house-of-representative-districts
St. Louis Mayoral sweepstakes are non-partisan, but nobody’s fooled, we all know they’re Dummycrats & have been since the 1950s. Francis Slay was a major player in St. Louis politics for 32 years & accomplished nothing as people continue to leave this city in their rearview mirror & their murder rates are legendary. Banning firearms & confiscating them will have null effect on St. Louis crime, period. They just want your guns so they can imprison you, kill you if necessary & usher in a police state that would make the Stasi blush.
All the MO State House Districts encircling & inhabiting St. Louis City are Democrat, period. In all MO statewide elections since 2016, the Democrat nominee secured >78% of the vote every time.
Kansas City, MO: 2020-22 murders = 498 * 2020-22 Population = 1,525,662 & a murder rate of 32.641
https://showmecrime.mo.gov/public/View/dispview.aspx?ReportId=199&MemberSelection_[Summary%20Jurisdiction%20by%20County].[Summary%20Jurisdiction%20by%20County%20Hierarchy]=MOKPD0000 State Data says 497 murders 2020-22 (32.576)
https://ballotpedia.org/Kansas_City,_Missouri https://en.wikipedia.org/wiki/Mayor_of_Kansas_City,_Missouri See also links for St. Louis City. I know this will shock you, but KC’s House Districts that they send to Jefferson City to represent them are… Dumocrats. Too many to list, just see the map. KC’s Mayors tend to be associated w/ the Democrat Party, despite the fact that their elections are non-partisan. MO Secy. of State lacks precinct data, so I cannot tell you who Kansas City proper voted for.
However, Jackson County, Missouri tends to vote ~60% for the Democrat nominee (Hillary Clinton was the only outlier, netting just over 55%) in statewide races – Kansas City leans further Democrat than the County does, trust me on that.
Springfield, MO: 2020-22 murders = 56 * Population 2020-22 = 508,959 & a murder rate of 11.002
https://showmecrime.mo.gov/public/View/dispview.aspx?ReportId=199&MemberSelection_[Summary%20Jurisdiction%20by%20County].[Summary%20Jurisdiction%20by%20County%20Hierarchy]=MO0390300 MO State Data gives Springfield 56 murders as well.
https://en.wikipedia.org/wiki/List_of_mayors_of_Springfield,_Missouri See also links for St. Louis. House Districts 130, 132, 133, 135 & 136 are all or part of Springfield proper, 132, 135 & 136 are occupied by Democrats & they are the majority of the city. The other two districts are mostly outside the city & occupied by the GOP currently.
Prior to redistricting, the GOP was winning this area (3 of the 5 Districts), but there was a shift recently.
As far as I can see, Springfield’s nonpartisan Mayoral sweepstakes do elect a lot of folks who are Independent, although their current Mayor (Ken McClure) was Matt Blunt’s Chief of Staff for some time. Their previous Mayor Bob Stephens was supposedly a Libertarian but reading some of his tripe in favor of lockdowns & school closures make me think he’s probably closer to retard than Libertarian. Moving on…
St. Louis County: https://showmecrime.mo.gov/public/View/dispview.aspx (Select “NIBRS Crimes and Rates by County - Last 3 Years”, “Incident Data” (2020, 2021, 2022), “Offense Type” (Murder & Nonnegligent Manslaughter), “Jurisdiction by Geography” (St. Louis County) St. Louis County: 2020-22 murders = 256 * 2020-22 population = 2,991,911 & a murder rate of 8.556 per 100,000.
That is pretty high, but not as high as most of the jurisdictions I will cover here. I did not feel like checking a dozen cities on the FBI page, so I used MO state data to check the county en masse.
I should mention that the county is like most jurisdictions w/ a high murder rate. There are several cities that spike the rate for the entire county, it’s not homogenous. Sam Seder should go to the proctologist, have his head shoehorned out & realize that crime in this country is concentrated, not spread out.
https://en.wikipedia.org/wiki/List_of_county_executives_of_St._Louis_County,_Missouri https://stlouiscountymo.gov/st-louis-county-government/county-executive/ St. Louis County in statewide elections voted 60% or very close for the Democrat nominee (since 2016) every single time except Hillary Clinton in 2016. She still won that county comfortably. The entire county, except for a very small portion elects Democrats to the MO State House. It’s a Democrat enclave, period.
Missouri Statewide: 2020-22 murders = 1,977 * 2020-22 population = 18,502,700 & a murder rate of 10.684 per 100,000.
MO State Data says 1,994 murders, pretty close to the FBI total.
Murder rate in Missouri OUTSIDE of the jurisdictions (St. Louis City, St. Louis County, Kansas City, Springfield) = (population = 12,594,706 & 505 murders) 4.009 per 100,000.
Albuquerque, NM: Murders 2020-22 = 326 * Population 2020-22 = 1,688,188 & a murder rate of 19.31
https://www.cabq.gov/police/crime-statistics Albuquerque PD says 306 murders 2020-22 & that’s a rate of 18.125
https://ballotpedia.org/New_Mexico_House_of_Representatives https://ballotpedia.org/New_Mexico_state_legislative_districts https://en.wikipedia.org/wiki/List_of_mayors_of_Albuquerque https://ballotpedia.org/Albuquerque,_New_Mexico https://www.zipdatamaps.com/politics/state-level/districts/map-of-new-mexico-state-house-of-representative-districts https://ballotpedia.org/Redistricting_in_New_Mexico
Trying to find precinct data for Albuquerque from Bernalillo County or the New Mexico SOS is like pulling teeth. No thanks! I would wager that since the Dums win Bernalillo Co. easily, Albuquerque City leans more Democrat, but I am not totally sure.
Since 1986, Republicans have occupied the Mayor’s Office (despite the races being officially nonpartisan) for only 8 years. All of the NM State House Districts (and there are several) that encompass & engulf Albuquerque are Democrat-controlled.
Gallup, NM (a tiny town w/ big murder problems): 2020-22 murders = 13 * 2020-22 population = 64,334 & a murder rate of 20.207. If you are a fan of The Lost Room this piqued your interest.
https://ladailypost.com/gov-michelle-lujan-grisham-announces-endorsements-from-new-mexico-mayors/ https://gallupsun.com/index.php?option=com_content&view=article&id=13802 https://en.everybodywiki.com/List_of_mayors_of_Gallup,_New_Mexico https://gallupsun.com/index.php?option=com_content&id=14729:2020-local-story--1-mckinney-asks-governor-to-proclaim-a-state-of-emergency https://www.susanamartinez.com/working-across-party-lines/ The two State House Districts (5 & 9) that run through Gallup (NM has enough House Districts in a state that is largely rural that Gallup is split between these two, believe it or not) are both Democrat-occupied. This was the case prior to redistricting.
Their current Mayor (Luis Bonaguidi) endorsed Lockdown Michele Lujan Grisham, who absolutely devastated NM’s economy. Their previous Mayor (Jackie McKinney) is identified as a Democrat & was on board w/ the Fascist parameters of a state of emergency as COVID-19 swept across this country, setting its sights on drug addicts, fat people, old people & sick people. Because… we should ruin the lives of those under 50 & totally healthy, treat them like a drug addict on the verge of death.
New Mexico Statewide: 2020-22 murders = 690 * 2020-22 population = 6,347,548 & a murder rate of 10.87 per 100,000. I wonder if Sam Seder can figure out if NM is more violent 2020-22 than the previous 4 years or is his head so far in his colon he cannot read the data?
NM murder rate OUTSIDE of Albuquerque & Gallup (population = 4,595,026 & 350 murders) = 7.616 per 100,000. Still very high, NM has a lot of problems in rural areas as well. Look who runs this state, that tells you just about everything you need to know. I don’t feel the urge (especially w/ a lack of good county-level data) compiling dozens of small towns & going further w/ that state.
https://www.dps.nm.gov/107-uniform-crime-reports/ NM State Data is useless & I can’t find anything current w/ murder data by municipality or statewide, so FBI data only on this one.
Birmingham, AL: 2020-22 murders = 269 * 2020-22 population = 595,131 & a staggering murder rate of 45.2
https://crime.alabama.gov/Data/TwentyTwentyStatewideCrime (Select “Crime Data Table 2020-22”) AL State Data has lots of good county info & Jefferson County is a lean Democrat County. It had 336 murders from 2020-22 (16.736 per 100,000 murder rate).
https://police.birminghamal.gov/ https://police.birminghamal.gov/wp-content/uploads/2023/12/Part-I-YTD-as-of-Dec-11-202324.pdf https://web.archive.org/web/20220401000000*/https://police.birminghamal.gov/ Birmingham PD says 347 murders 2020-22 & a rate of 58.306
https://www.zipdatamaps.com/map-share/politics/state-level/districts/map-of-alabama-state-house-of-representative-districts https://ballotpedia.org/Alabama_House_of_Representatives https://ballotpedia.org/Alabama_state_legislative_districts https://en.wikipedia.org/wiki/List_of_mayors_of_Birmingham,_Alabama https://ballotpedia.org/Birmingham,_Alabama https://ballotpedia.org/Redistricting_in_Alabama https://ballotpedia.org/Redistricting_in_Alabama_after_the_2020_census
Alabama State House Districts covering Birmingham are all Democrat & that was the case prior to the 2020 Census. Despite Mayoral elections being nonpartisan, those who win that office in Birmingham are associated w/ the Democrat Part & have been for some time. Alabama Secy. of State does not have good data for precinct level results.
https://www.zipdatamaps.com/election-atlas/county/al/jefferson-county/map-of-2020-presidential-election-results-by-voting-precinct Most of Birmingham is in Jefferson County (a very tiny slice is in Shelby) & Biden defeated Trump by massive margins there in 2020.
Mobile City, AL: 2022-22 murders = 100 * Population 2020-22 = 555,289 & a murder rate of 18.008
https://www.mobilepd.org/stats-reports/ https://www.mobilepd.org/uploads/MobilePoliceDepartment2022AnnualReport.pdf Mobile PD says 138 murders & a rate of (Sometimes they do not make it clear if they are counting negligent manslaughter and/or justified homicides) 24.851 per 100,000.
https://en.wikipedia.org/wiki/List_of_mayors_of_Mobile,_Alabama https://ballotpedia.org/Sandy_Stimpson https://ballotpedia.org/Sam_Jones_(Alabama) AL State House Districts (97, 99, 101, 103) that are all or part of Mobile (97 & 99 cover much of it) – 3 are Dumocrat, one is GOP. 4 of the 5 were Democrat prior to redistricting. Their current Mayor is a Republican, their previous Mayor (Sam Jones, who occupies District 99) was a Democrat & the one before that was apparently an Indy.
https://www.zipdatamaps.com/election-atlas/county/al/mobile-county/map-of-2020-presidential-election-results-by-voting-precinct Iti s pretty obvious, Biden won Mobile City in 2020 over Trump. This is important, Mobile County is lean Republican, but Mobile City is lean Democrat.
Montgomery, AL: 2020-22 murders = 206 (FBI only has data for 2020, filling in below) * 2020-22 population = 596,237 & a murder rate of 34.55
https://data.montgomeryadvertiser.com/montgomery-homicides/ https://www.wsfa.com/2021/12/21/it-is-high-number-montgomery-reaches-75-homicides-before-end-2021/ https://www.waka.com/2023/01/04/montgomery-police-2022-homicide-numbers-drop-from-2021-2020/ AL State Data has supposedly good county data (it records only 36 “homicides” for Montgomery County entirely from 2020-22, which I know is NOT correct), but not for municipalities. Montgomery City PD data is useless.
The Montgomery Advertiser (82 in 2021, 74 in 2020 & 10 in 2022, they stopped recording apparently) stopped short of reporting & WAKA Action News says (61, 77, 68) 206 from 2020-22. Does this include any justifiable homicides & negligent manslaughter cases?
https://www.montgomeryindependent.com/opinion/at-current-rate-homicides-in-montgomery-set-to-outpace-2021-2022/article_790aec1a-9c08-11ed-b724-9f7e2efc13c2.html This piece says 62 in 2022 & 77 in 2021. https://www.montgomeryadvertiser.com/in-depth/news/crime/2021/01/14/extremely-violent-year-here-are-the-homicide-victims-2020/6477506002/ This piece says 68 (one case of manslaughter) murders in 2020. https://www.montgomeryadvertiser.com/story/news/crime/2024/01/22/how-many-homicides-did-mpd-report-in-2023/72272939007/ This article says 62 in 2022 & 77 in 2021.
That said, I am (77 in 2021, 61 in 2022 & 68 in 2020) going w/ 206 murders.
https://www.zipdatamaps.com/election-atlas/city/al/montgomery/map-of-2020-presidential-election-results-by-voting-precinct https://ballotpedia.org/Montgomery,_Alabama https://en.wikipedia.org/wiki/List_of_mayors_of_Montgomery,_Alabama https://ballotpedia.org/Steven_Reed_(Alabama) https://thehill.com/homenews/campaign/464957-montgomery-elects-citys-first-african-american-mayor/ https://ballotpedia.org/Bobby_Bright Joe Biden won Montgomery City easily in 2020. AL State House Districts (74, 76-78) covering Montgomery City are all Democrat, prior to redistricting it was 3 Dumocrats & one Republican. Montgomery County always votes for Demorats in statewide elections, Montgomery City is even more lopsided.
Montgomery City’s current Mayor (since Nov. 2019) is a Democrat & the Hill reports Todd Strange (Mayor for over a decade) is a Republican, so it must be true. The previous clown (Bobby Bright) was Mayor for over a decade & was an Independent (currently a Democrat) while holding that office.
Tuscaloosa, AL: 2020-22 murders = 28 * 2020-22 population = 310,847 & a murder rate of 9.007
https://www.tuscaloosa.com/government/annualreports Tuscaloosa PD pegs 2020-22 murders at 43, a rate of 13.833. Major difference from FBI data
https://www.zipdatamaps.com/election-atlas/city/al/tuscaloosa/map-of-2020-presidential-election-results-by-voting-precinct https://en.wikipedia.org/wiki/Tuscaloosa,_Alabama https://ballotpedia.org/Walt_Maddox AL State House Districts (63, 70 & 71) that are part of Tuscaloosa feature 2 Leninists & one Republican, it was that way prior to the 2020 Census as well. Their Mayor since 2005 is a Democrat who got the nomination for Governor back in 2018 – he got blown out.
Ironically, since 2016 in statewide elections, his election was the only time the Dems won Tuscaloosa County, every other time they were defeated handily, sometimes the GOP nominee got 60%. Tuscaloosa City is a Democrat enclave inside a GOP-leaning county. Senile Biden easily won Tuscaloosa City in 2020.
Gadsden, AL: 2020-22 murders = 9 * 2020-22 population = 101,036 & a murder rate of 8.907
https://ballotpedia.org/Craig_Ford https://www.gadsdentimes.com/story/news/2022/09/21/gadsden-mayor-race-results-2022-craig-ford-heather-brothers-new/69505731007/ https://web.archive.org/web/20220408074744/https://en.wikipedia.org/wiki/Gadsden,_Alabama https://cityofgadsden.com/127/Mayors-Office https://www.bamapolitics.com/alabama/profiles/sherman-guyton/ https://www.zipdatamaps.com/election-atlas/city/al/gadsden/map-of-2020-presidential-election-results-by-voting-precinct Gadsden’s current Mayor is a Dumocrat, pertaining to his 16-year predecessor (Sherman Guyton) I am not 100% sure. Wikipedia & BamaPolitics however, identify this clown as a Democrat. Ballotpedia has nothing on him, because he’s a nobody.
This Podunk, Redneck town recently created a City Administrator for Director of Diversity, Equity and Inclusion. Yes, every city needs at least one of those, need to make sure you have enough “people of color” in pivotal positions, even if they’re not qualified.
Joe Biden won Gadsden City to 6,429 votes to 6,099 votes for Donald J. Trump. Gadsden is not big enough to control an AL State House District by itself, Districts 28 & 29 split the city, both are GOP. Prior to redistricting, District 28 flipped to the GOP in 2018.
Alabama Statewide: 2020-22 murders = 1,499 * 2020-22 population = 15,148,498 & a murder rate of 9.895 per 100,000. This would likely be a bit higher, but Montgomery missed a year. Does creepy old man Sam Seder want to argue there’s no Crime Wave in Alabama? Would this mentally ill divorcee like to argue over who is murdering who in Alabama? I didn’t think so!
Murder rate in AL OUTSIDE of Montgomery City, Tuscaloosa City, Gadsden, Mobile City & Birmingham City = (887 murders & population of 12,989,958) 6.828 per 100,000. Still pretty high (a skosh above the national average), but I don’t feel like digging through a bevy of smaller towns w/ boatloads of black on black murder, sue me.
Alabama State Data by its own admission is useless
Detroit, MI: 2020-22 murders = 935 * 2020-22 Population = 1,891,955 & a murder rate of 49.419. Even a functionally-retarded mouth-breather like David Pakman or Sam Seder can see that from 2020-22, Detroit’s murder rate has skyrocketed from the 2016-19 time frame. Derp! Detroit is dying.
https://www.michigan.gov/msp/divisions/cjic/micr/annual-reports Michigan State Data says 947 murders 2020-22, a rate of 50.054 per 100,000. NOTE: When I read reports w/ multiyear data, such as for 2022 & 2021, I use the 2022 report for the 2021 data, as it is often adjusted just a tad.
https://ballotpedia.org/Michigan_House_of_Representatives
https://ballotpedia.org/Michigan_state_legislative_districts https://www.zipdatamaps.com/map-share/politics/state-level/districts/map-of-michigan-state-house-of-representative-districts https://en.wikipedia.org/wiki/List_of_mayors_of_Detroit https://ballotpedia.org/Detroit,_Michigan https://ballotpedia.org/Redistricting_in_Michigan We need not spend much time on this, Detroit’s Mayors have been associated w/ the Dummycrat Party since the 1960s & all their State House Districts are occupied by Democrats. Rashida Tlaib was one of those morons for a time. The rest is history as they say & the Democrats have run Detroit right into the ground. Lots of people have said “so long” to this cesspool in the past 50+ years.
Dave Leip reports that Detroit City gave >90% of its vote to Biden & Hillary in the last 2 POTUS Sweepstakes.
Grand Rapids, MI: 2020-22 murders = 68 * Population 2020-22 = 593,217 & a murder rate of 11.462
MI State Data says 69 murders for Grand Rapids 2020-22, a rate of 11.631
https://en.wikipedia.org/wiki/List_of_mayors_of_Grand_Rapids,_Michigan MI State House Districts (81-84) that are all or part of Grand Rapids are occupied by Dummycrats. Prior to redistricting, it looked as if 3 Districts infiltrated the city, one was GOP. Their current Mayor is associated w/ the Democrats, the previous one I could not find anything definitive. Gretchen Whitmer appointed him to the state Natural Resources Commission. Make what you want of that.
Hillary won (Dave Leip) 61.9% of the vote in Grand Rapids City & Biden won 69.6% of the vote in 2020.
Lansing, MI: 2020-22 murders = 58 * 2020-22 population = 337,878 & a murder rate of 17.165
MI State Data says 57 murders 2020-22 (16.869 per 100,000)
https://en.wikipedia.org/wiki/List_of_mayors_of_Lansing,_Michigan https://ballotpedia.org/Lansing,_Michigan As you can see, all the Michigan State House Districts (75, 73, 76 & 77) encircling Lansing are Democrat-occupied & Lansing Mayors (just 2) over the past 18 years have been associated w/ the Demoncrat Party.
Most of Lansing is in Ingham County, the city voted (Dave Leip) >68% for Hillary & 73% for “Plugs” Biden.
Pontiac, MI: 2020-22 murders = 41 * Population 2020-22 = 184,439 & a rate of 22.229
MI State Data says 41 murders as well
https://ballotpedia.org/Tim_Greimel https://www.michigan.gov/sos/elections/election-results-and-data/candidate-listings-and-election-results-by-county MI State House District 53 covers Pontiac entirely, it is Democrat & has been for some time. Their current Mayor is a Dumocrat, I could not find definitive info on their previous Mayor, but I suspect she voted for Joe Biden. Pontiac votes overwhelmingly Dumocrat in statewide elections & gave Whitmer ~80% of the vote in 2022. Some cities & counties don’t give you good precinct info, so it’s hard to tell how a city within a given county voted.
Pontiac City (Dave Leip) voted >80% for Biden & Hillary.
Flint, MI: 2020-22 murders = 98 * 2020-22 population = 241,750 & a murder rate of 40.537
MI State Data pegs Flint’s 2020-22 murders at 137, a rate of (I figured the FBI 2022 data was lowballed) 56.67. This is the figure I will use when I compile this at the end.
https://en.wikipedia.org/wiki/List_of_mayors_of_Flint,_Michigan MI State House Districts 69 & 70 cover Flint, both are the Party of Lenin & Districts that cover Flint voted that way prior to redistricting. The city regularly votes ~90% for the Democrat in statewide races. Flint has had Democrat Mayors for at least 20 years. Surprised that this hellhole votes Democrat & folks are leaving in droves? They’ve had numerous Black Mayors & the place is still a wreck. >80% of the vote in the city went to Biden & Shillary.
Kalamazoo City, MI: 2020-22 murders = 38 * 2020-22 population = 219,700 & a murder rate of 17.296
MI State Data says nothing as Kalamazoo City was not included. https://www.kalamazoopublicsafety.org/About/Data-Statistics-and-Reports/Reports-Documents Local PD (I had to look at the 2021 document as the 2022 document simply said murder was down from last year, but did not give me a number) says 37 murders & a rate of 16.841
https://en.wikipedia.org/wiki/List_of_mayors_of_Kalamazoo,_Michigan MI State House District covers 41 covers Kalamazoo City entirely in my estimation & it elects Democrats all the time. Their current Mayor is a Democrat https://secure.actblue.com/donate/2021launch who was securing donations via ActBlue for his Mayoral reelection. The previous Mayor endorsed the current Mayor, so they’re both likely crazier than a bag of cats. Could not find good precinct data for Kalamazoo City, but it likely leans a lot more towards the Party of Lenin than the county en masse does. >71% of the vote in Kalamazoo City went to Biden & Hillary according to Dave Leip.
Saginaw City, MI: 2020-22 murders = 63 * 2020-22 population = 131,543 & a stratospheric murder rate of 47.893
MI State Data says 69 murders, a rate of 52.454
https://en.wikipedia.org/wiki/List_of_mayors_of_Saginaw,_Michigan Cannot find good data on the political leanings of the Mayors there, I would not be surprised if they are BLM nutcases who want your guns, yet the miscreants that elect them will still have guns to kill other miscreants that vote Democrat (or likely, do not vote at all & never had a daddy). MI State House District 94 covers Saginaw entirely. Biden in 2020 & Whitmer in 2022 won Saginaw City more than three-to-one. It’s a Democrat enclave that looks like a demilitarized zone. The city voted >75% (Dave Leip) Democrat in the last 2 POTUS elections.
One more in Wolverine Land then we move on. Muskegon City, MI: 2020-22 murders = 17 * 2020-22 population = 114,081 & a murder rate of 14.901. MI State Data does not help in this instance. Local PD only has data for 2022.
MI State House District 87 encompasses Muskegon entirely (the city is not big enough to have a District to itself though) & is occupied by the Dums. Muskegon County’s election results archive told me nothing before 2023. Could not find much on their Mayors as it is a relatively small town. Sue me. According to Mr. Dave Leip, >68% of the vote went to Dumbasscrats in the last two POTUS elections in Muskegon City.
Michigan Statewide: 2020-22 murders = 2,210 * 2020-22 population = 30,148,942 & a murder rate of 7.33 per 100,000.
Michigan Murder Rate OUTSIDE of (Muskegon City, Flint, Detroit, Pontiac, Saginaw, Lansing, Kalamazoo City, Grand Rapids) the cities I mentioned = (909 murders & 26,434,379 population) a paltry 3.438 per 100,000. How about that Divorcee Sam Seder? Outside those “diverse” Democrat enclaves, MI is uber-safe. Funny, isn’t it ferret face?
MI State Data says 2,202 murders, correlating nicely w/ FBI data
Atlanta, GA: 2020-22 murders = 385 * 2020-22 population = 1,494,310 & a murder rate of 25.764
Even this functionally-retarded mouth-breather Sam Seder can see that the 2020-22 murder rate in Atlanta (and especially just 2022) is much higher than the period prior to the Saint George Floyd riots.
Georgia State Data https://gbi.georgia.gov/services/crime-statistics (which I will use later) has great county level & metro area data, but for a lot of specific cities that is scant. I will defer to Atlanta PD. https://www.atlantapd.org/i-want-to/crime-data-downloads
Atlanta PD says 488 murders 2020-22, which is a murder rate of 32.657
NOTE: They do NOT have a specific section for justified homicides or negligent manslaughter, yet their NIBRS definition sheet mentions those, so I am not totally sure those are excluded. From 2019-22, there are 2 years where Atlanta PD data diverges “significantly” from FBI data.
https://www.zipdatamaps.com/politics/state-level/districts/map-of-georgia-state-house-of-representative-districts https://ballotpedia.org/Atlanta,_Georgia https://ballotpedia.org/Georgia_state_legislative_districts
https://en.wikipedia.org/wiki/List_of_mayors_of_Atlanta https://ballotpedia.org/Georgia_House_of_Representatives
Of the beaucoup Georgia State House Districts that are all or part of Atlanta, I see a single solitary one (District 56) that goes within Atlanta’s city limits that is GOP-controlled. I am not going to count all the Democrat Districts, suffice to say it’s lopsided.
Atlanta has had Democrat-affiliated Mayors (elections are officially non-partisan) for decades & decades, no debate here who they support in this war zone. Atlanta is one of the worst cities in America for black-on-black murder, although they still have a long way to go before they catch up to Baltimore, Detroit, St. Louis or Memphis.
https://www.zipdatamaps.com/election-atlas/county/ga/fulton-county/map-of-2020-presidential-election-results-by-voting-precinct Suffice to say, Atlanta City is much more lopsided than Fulton County en masse. In fact, lopsided does not even begin to tell you how Democrat-dominated this dunghole is.
South Fulton, GA: 2020-22 murders = 73 * Population 2020-22 = 327,797 & a murder rate of 22.269
GA State House Districts 65 & 67 cover South Fulton & they’re both Demoncrat-occupied. Donald Trump did not win a precinct in South Fulton back in 2020. The Fulton County area has been dominated by Democrats for a very long time.
East Point, GA: 2020-22 murders = 43 * Population 2020-22 = 114,876 & a murder rate of 37.431
https://www.eastpointcity.org/police/#crime-stats East Point PD says 54 murders 2020-22, equaling a rate of 47.007. It’s not just Atlanta where the hood rats are shooting each other, is it Sam Seder?
GA State House Districts 62 & 63 encompass East Point, both are Democrat. Surprised? Joe Biden won East Point City easily in 2020.
College Park, GA: 2020-22 murders = 31 * 2020-22 population = 41,717 & a murder rate of 74.31. ZOINKS!!! In 2020, how many precincts do you think Donald Trump won there? Zero.
GA State House Districts 62 & 63 are Democrat-occupied & straddle College Park.
Douglasville, GA: 2020-22 murders = 18 * 2020-22 population = 108,164 & a murder rate of 16.641
GA State House District 66 covers Douglasville & has been occupied by the same Democrat for a long time. https://www.zipdatamaps.com/election-atlas/county/ga/douglas-county/map-of-2020-presidential-election-results-by-voting-precinct Donald Trump did not win a precinct in Douglasville City back in 2020.
Let’s do Fulton County, Georgia, shall we? It typically votes for Democrats two-to-one in statewide races.
GA State Data says 547 (!) murders in Fulton County 2020-22 (population = 3,203,867) & that is a staggering rate of 17.073. You can see, most of that is Atlanta, yet it’s not even half of Fulton’s population.
I tried to find data on the Fulton County Board of Commissioners (I suspect two are Democrats as one was on the Atlanta City Council for eons & another was a Democrat Candidate for the State House) but could not do it. https://fultoncountyga.gov/commissioners
Bibb County (Macon City) GA: 2020-22 murders = 151 * 2020-22 population = 470,306 & a murder rate of 32.106
GA State Data concurs w/ FBI data, 151 murders for Bibb County/Macon.
https://en.wikipedia.org/wiki/List_of_mayors_of_Macon,_Georgia The Mayor (for many years prior to consolidation & after) was a Democrat, not sure about Lester M. Miller. Bibb-Macon has voted Democrat overwhelmingly (and even more so from 2020 on) in every statewide election since 2016. GA State House Districts 142 & 143 are the Macon-Bibb area & they are occupied by Democrats. Dave Leip’s data indicates the Democrat nominee won 60% of the vote in statewide elections since 2016, except once.
Albany, GA: = 2020-22 murders = 50 * 2020-22 population = 205,892 & a murder rate of 24.284
https://www.albanyga.gov/about-us/city-departments/albany-police-department/apd-annual-reports Albany PD data is behind schedule at this time
https://www.albanyga.gov/about-us/city-commission/commission-directory/mayor https://en.wikipedia.org/wiki/Albany,_Georgia GA State House Districts 153 & 154 (although the former is most of Albany City & is Democrat) occupy Albany, currently one is Dem & one is GOP. I suspect that the clowns who have been Mayor there for the past decade plus (Dorothy Hubbard & Willie Adams Jr.) are Democrats (their current Mayor had a fetish for masks during COVID), but I cannot find definitive data.
Albany is >80% of Dougherty County’s population & Dougherty has voted almost two-to-one for the Dumocrats in every single statewide election since 2016 (Dave Leip). https://www.zipdatamaps.com/election-atlas/county/ga/dougherty-county/map-of-2020-presidential-election-results-by-voting-precinct Albany City voted overwhelmingly for Joe Biden in 2020.
Georgia Statewide: 2020-22 murders = 2,687 * 2020-22 population = 32,412,842 & a murder rate of 8.289 per 100,000. Hey Sam Seder, does GA’s murder rate 2020-22 look better or worse than 2016-19? #DemocratCrimeWave
GA State Data says 2,216 (?) murders from 2020-22. A mammoth difference from FBI data. Even though the 2022 report has many previous years & would be able to have revised data, the difference is still large.
GA murder rate OUTSIDE of
239
views
5
comments

Creepy Sam Seder vs logic (again)
Sam Seder vs. logic (again)
Democrat correlations to the Nazi Party https://web.archive.org/web/20230405030848/https://professor_enigma.webs.com/archive https://rumble.com/v2gaoks-divorcee-sam-seder-wants-to-sell-rural-america-some-snake-oil.html
My Democrat Crime Wave Hub (more to be added soon) https://rumble.com/v3mu0q4-brian-tyler-cohens-red-stateblue-state-homicide-pap-gets-nuked.html https://www.facebook.com/permalink.php?story_fbid=pfbid026vNKpPdMHW9ftUpYPHKxko2aYLrEvTZVZrEGtybjW5stz7QSu356xUU8Lvb2j2n2l&id=100064869933577
Creepy old man Sam Seder flunked #science You are XX or KY period, there is no “other”, “transgender” is an illusion, an idea in the mind. https://rumble.com/v43k1nq-sam-seder-latifah-faisal-mark-d.-langdon-and-keith-olbermann-humbled-by-ril.html https://rumble.com/v3u6uai-creepy-sam-seder-and-mark-d.-langdon-find-out-biology-is-real-science.html https://rumble.com/v36edqs-creep-sam-seder-and-mark-d.-lang-flunked-biology-anatomy-and-physiology.html https://rumble.com/v2lwmh8-creepy-sam-seder-and-dylan-mulvaney-embarrassed-by-james-okeefe.html
Sam Seder (debunked) whines about abortion being left to the states, as it always should have been https://rumble.com/v3wz1q0-creepy-sam-seder-ohio-abortion-ballot-initiative-and-the-roe-effect.html
My exit question in writing for Sam Seder again & using his own logic: Is Sam Seder desperately wanting to “change” his gender & hang out in the same dressing room w/ preteen girls? If not Sam Seder, why not? If those at the Daily Wire are “desperately” wanting to use the “N” word, then aren’t you also “desperately” wanting to “change” your gender to female, so you can hang out in the preteen girls’ locker room?
No male pretending to be a female will enter my daughter’s locker room or play sports w/ biological females, period. I am not negotiating Sam Seder, we are not compromising, we are not coming to an agreement, that is the way it is, period.
Is Sam Seder trying to normalize abominable/hebephilic/pedophilic behavior?
Sam Seder needs a thicker skin, he’s more worried about words than the pile of dead, young black men 135 miles high in cities his party runs.
Sam Seder’s logic is oddly adolescent, inconsistent & very sophomoric.
Sam Seder debunked on “Republican Voter Suppression” https://rumble.com/v24tyd2-divorcee-sam-seder-debunked-on-republican-voter-suppression.html
We don’t let 14-year-olds smoke weed or consume alcohol (not legally anyways), we don’t let them drive vehicles without a parent present & we’re not going to let them mutilate their genitals until they become adults.
If Sam Seder wants to move that 18-year-old red line, would have like to move it to 13 years old? Would he blush at the thought of a creepy 50+ year old man having consensual sex w/ a 13 year old girl?
Good luck answering those questions on your little internet show tomorrow old man. I will be busy at my real job, which does not consist of sitting on one’s fat ass all day in an echo chamber
If Sam Seder says we can balance the budget raising taxes, that has been totally debunked https://rumble.com/v1mjo9w-tell-your-democrat-friends-take-the-bernie-sanders-tax-hike-challenge.html https://web.archive.org/web/20220801231231/https://professor_enigma.webs.com/sam-seder-aoc-tax-the-rich
Sam Seder, let me make another thing clear to you old man. My wife & I will take care of our daughter's sex education (and we did), we do not need the assistance of a predator in a government school classroom or any other classroom.
I presume since your wife left you, she took care of that & were out of the (fragmented family) loop.
I don't worry about your kids that don't see you very often, you don't worry about mine. Capiche old man? #samseder #majorityreport
261
views
5
comments

Sam Seder, Latifah Faisal, Mark D. Langdon & Keith Olbermann HUMBLED by Riley Gaines
Creeps Sam Seder, Latifah Faisal (Story County, Iowa Board of Supervisors), Mark D. Langdon & Keith Olbermann HUMBLED by Riley Gaines, Caitlin Clark & Caroline Found
Here is the bill Riley talked about https://clerk.house.gov/Votes/2023192 https://www.congress.gov/bill/118th-congress/house-bill/734/all-actions https://www.congress.gov/bill/118th-congress/house-bill/734/text
[quote] Section 901 of the Education Amendments of 1972 (20 U.S.C. 1681) is amended by adding at the end the following:
“(d) (1) It shall be a violation of subsection (a) for a recipient of Federal financial assistance who operates, sponsors, or facilitates athletic programs or activities to permit a person whose sex is male to participate in an athletic program or activity that is designated for women or girls.
“(2) For the purposes of this subsection, sex shall be recognized based solely on a person’s reproductive biology and genetics at birth.
“(3) For the purposes of this subsection, the term ‘athletic programs and activities’ includes, but is not limited to, all programs or activities that are provided conditional upon participation with any athletic team.
“(4) Nothing in this subsection shall be construed to prohibit a recipient from permitting males to train or practice with an athletic program or activity that is designated for women or girls so long as no female is deprived of a roster spot on a team or sport, opportunity to participate in a practice or competition, scholarship, admission to an educational institution, or any other benefit that accompanies participating in the athletic program or activity. [quote]
Anyone who says the two parties are the same have lost their minds or have a low IQ. Every Republican voted for that, all Democrats opposed it. Yes, the GOP has a Legion of problems, for they are many, but to say they are the same as the Democrats is silly & retarded.
The groomers in Iowa City claim to love Caroline Found, but if one looks at how virulently they defend “transgender” predators, they’ve effectively defecated on the memory of Caroline Found. They would effectively end her volleyball career by letting men compete against her. Shame on them. If you want to learn about Iowa City volleyball player Caroline Found, google her or watch “The Miracle Season.” It’s a good movie, even if the makers took some liberties to make it a bit more dramatic.
I’ve asked the overweight Mark D. Langdon https://rumble.com/v3d43ic-mark-d.-langdon-facebook-idiots-on-parade.html https://www.facebook.com/profile.php?id=1598664829 many times, would he allow Dylan Mulvaney or Roman Polanski in the same locker room as his niece? Creepy “Uncle” Mark refuses to answer.
Caitlin Clark (I do not follow sportsball) is likely the most popular women’s basketball player of all-time & she’s still in college. Creepy, mentally ill old men like Keith Olbermann & Sam Seder demand that you allow biological men to compete w/ women & demand that you acknowledge them as women.
Dylan Mulvaney is a man pretending to be a woman, he will always be a man. He can pretend to be a woman all he wants, until he tries to enter my daughter’s locker room & then he & I will have a problem. He does not want to go there. William Thomas is a man & will always be a man. He can put on a goofy wig (or not), take estrogen, get his penis mutilated & get fake breasts attached to his chest – he is still a man.
Mark D. Langdon can pretend to play guitar, but he’s still a fat, old man w/ no talent aside from creating sock puppet accounts to subscribe to himself & thumb up his own comments.
If Caitlin Clark, a superstar in women’s sports was forced to compete against 6’ 6” black dudes who washed out of Division I Men's basketball, she would ride the end of the bench her entire career & that would be a shame.
This is what these creeps want to do. Story County, Iowa Supervisor Latifah Faisal #latifahfaisal #faisal4story #faisal4storycounty https://archive.ph/Xt8B9 is among them, she thinks refusing to acknowledge that Dylan Mulvaney is a woman (and he is not) is tantamount to discrimination against mentally-ill “transgender” people. She’s also angry that I can remove a book from a government school that talks about children engaging in oral sex w/ each other. Does Latifah Faisal get off on books that talk about cousins masturbating in front of each other? Latifah Faisal, do you get off on books about incest? Would you get off on thinking about your illegitimate children engaging in lesbian sex w/ each other? If so, you need your head examined. If you think that should be given to other children that have a mother & father unlike yours – you still need your head examined.
She, like every other Marxist brainwashing machine, wants the parents out of the loop. She wants to raise your kids, even though the father of hers is not in the picture. https://rumble.com/vo8m5t-waukee-school-board-listens-to-sexually-explicit-material-that-made-it-into.html https://rumble.com/vo3eaf-waukee-10-year-old-given-suggested-reading-item-book-about-little-boy-disco.html
Would Latifah Faisal like it if I talked to her illegitimate children about how homosexual men are the reason AIDS/HIV has spread like wildfire? https://rumble.com/v2e2f68-divorcee-sam-seder-just-isnt-very-bright-covid-19-vs.-aidshiv.html Yes Latifah Faisal, we are all watching you defend books on government school library shelves that talk about incestuous oral sex among children. I digress.
There is no such thing as “transgender” & that is not discrimination, it’s called #science You are either XX or XY, period. There is no “other”, there is no “binary”, period. To say otherwise is lunacy. https://rumble.com/v3w8icm-creepy-mark-d.-langdon-and-biopolaroid-sam-seder-flunked-science.html https://rumble.com/v3u6uai-creepy-sam-seder-and-mark-d.-langdon-find-out-biology-is-real-science.html https://rumble.com/v36edqs-creep-sam-seder-and-mark-d.-lang-flunked-biology-anatomy-and-physiology.html
PS Be aware America, Latifah Faisal, Sam Seder #samseder #majorityreport Keith Olbermann et al. are coming for your children. https://dailycaller.com/2023/06/28/lgbt-activists-coming-children-chant-just-misunderstood/ https://rumble.com/vjki03-sf-gay-mens-choir-sings-about-converting-kids-and-it-immediately-backfires.html They want to talk to your children about oral sex, sex in general & they want to hypersexualize them so they’re dysfunctional, which creates more Democrat voters. Sam Seder thinks it’s Fascism to deny reality & science, he is that far gone. Good thing his ex-wife got out of that toxic relationship.
Why do you think Detroit, Chicago, Baltimore, California & St. Louis vote overwhelmingly Democrat? They’re dysfunctional & the sane people are leaving.
PPS I was a good wrestler in high school, Mark D. Langdon was good at… eating lunch. If I was allowed to compete w/ the girls, I would have been a 4-time state champion. If I were forced to compete against Mark D. Langdon in eating hot dogs, it would be unfair. Mark is overweight & is good at vacuuming up calories by the million, it would be no contest. Mark needs to compete against someone who is a professional hot dog consumer.
347
views
Creepy Sam Seder & the 2030 Census Shift Tsunami
Creepy Sam Seder & the 2030 Census Shift Tsunami. The Democrats are desperate because some of their strongholds are set to lose a bevy of Electoral Votes.
https://thearp.org/blog/apportionment/2030-forecasted-apportionment/
States that Kid Sniffer Joe Biden & Mrs. Bill Clinton both won
California -5 * Oregon -1 * New York -3 * Illinois -2 * Rhode Island -1 * Delaware +1 * Minnesota -1 * That is a net LOSS of 12 Electoral Votes for the Party of Lenin & fat, old men who want to “change” their gender to female & change clothes in the same room as your minor daughter.
Every single one of those states is a Democrat Trifecta.
States that Donald J. Trump won 2X
Texas +4 * Florida +4 * North Carolina +1 * Tennessee +1 * Utah +1 * Idaho +1
That is a net gain of 12 Electoral Votes & every single one of those states is a Republican trifecta.
This is a swing of 24 Electoral Votes in toto, just in states that were won by a specific party both times (2016 & 2020). If we replay the 2020 election (which was won by Donald Trump https://archive.is/9qkHK https://archive.is/bEh4q ) Joe Biden now has 294 Electoral Votes, Donald Trump has 244 Electoral Votes.
If we factor in Wisconsin & Pennsylvania each losing one EV, Arizona & Georgia gaining one EV each – that’s a wash kids. If we transfer the “official results” from the 2020 election & run it in 2032 – if Georgia & Wisconsin flip, the Republican nominee wins. If Georgia flipped, along w/ Arizona or Georgia flipped along w/ Nevada & New Hampshire, the GOP nominee wins.
If Arizona flipped, along w/ Wisconsin & New Hampshire, the GOP nominee wins. https://uselectionatlas.org/TOOLS/evcalc.php Run your own Electoral College Calculator hypothetical, have fun.
https://ballotpedia.org/State_government_trifectas https://ballotpedia.org/Veto_overrides_in_state_legislatures
People are leaving Democrat-dominated states, fleeing for areas run by Republicans. I will know a lot more after the 2024 election, but it appears as of now the folks who are migrating are Republicans who are sick of “transgender” predators intimidating their daughters, sick of high taxes, sick of envirokooks, sick of government school indoctrination – they left & took their wallets w/ them. https://web.archive.org/web/20230405030848/https://professor_enigma.webs.com/archive https://archive.is/UdtWF
https://rumble.com/v2gaoks-divorcee-sam-seder-wants-to-sell-rural-america-some-snake-oil.html
People are leaving Democrat-dominated areas because they are immoral cesspools full of crime, where kids are not educated, but indoctrinated. The Democrats want to pack the Supreme Court so they can “find out” that the “We The People” segment of the Second Amendment does not apply to regular citizens like me & the individual right to bear arms does not exist. They will demand that Mr. & Mrs. America turn in their guns.
https://web.archive.org/web/20221110051920/https://professor_enigma.webs.com/covid-increase-homicides https://web.archive.org/web/20220608034412/https://professor_enigma.webs.com/sam-seder-ilhan-omar-racism https://web.archive.org/web/20220608034416/https://professor_enigma.webs.com/sam-seder-ilhan-omar-racism2 https://web.archive.org/web/20220608034411/https://professor_enigma.webs.com/sam-seder-ilhan-omar-racism3 (as an aside, I will point out to Miss Hakeem Jeffries that it’s HIS VOTERS, HIS PEOPLE perpetrating most of the violence in this country, not white, rural, uber-Republican counties)
This will allow Black Lives Matter to more easily intimidate citizens & riot as an election approaches, especially if half the police force was fired, moved or quit because they’re treated like criminals for pulling over felons. You will not be allowed to legally defend yourself, but the hood rats will still get their guns because they never cared about the law anyways.
WOTUS (waters of these United States) will also be christened, (see my Rural America video) so an all-out assault (on top of the mostly clandestine, not-so-obvious assaults) on private property (especially in rural areas) & farmland can begin.
This new, expanded Supreme Court will also find a way to validate elections being conducted mostly or wholly by mail & prohibit states like Iowa from asking for a Photo ID before casting a ballot.
Every intelligent dictator knows you cannot start sticking people in camps and/or murdering them until your opponents are disarmed.
https://queenseagle.com/all/aoc-says-pack-the-supreme-court-meeks-meng-and-jeffries-say-they-are-open-to-dramatic-reforms https://jeffries.house.gov/2022/06/23/rep-jeffries-statement-on-the-extreme-supreme-court-decision-to-flood-nyc-streets-with-guns/ https://news.yahoo.com/biden-says-voters-don-t-170433889.html https://www.markey.senate.gov/news/press-releases/05/16/2023/sen-markey-rep-johnson-announce-legislation-to-expand-supreme-court-restore-its-legitimacy-alongside-sen-smith-reps-bush-and-schiff https://www.congress.gov/bill/117th-congress/senate-bill/1141/text https://www.congress.gov/bill/117th-congress/house-bill/2584 https://www.congress.gov/bill/118th-congress/house-bill/3422/text https://www.congress.gov/bill/118th-congress/senate-bill/1616/text https://www.politico.com/minutes/congress/05-16-2023/supreme-court-expansion-bill/ https://www.foxnews.com/politics/rashida-tlaib-attacks-supreme-court-extremist-amid-union-case-calls-expand-court https://www.washingtonexaminer.com/news/chris-coons-says-his-mind-is-open-to-packing-the-supreme-court https://www.foxnews.com/politics/beto-orourke-says-drastic-supreme-court-changes-worth-considering-during-early-2020-campaign-stop
All their attacks on the Supreme Court are contrived & used as an excuse to expand it. The Democrat Party itself kept Harry Truman from making it easy for unions to infiltrate workplaces & wreck them (right-to-work). The Democrat Party itself stopped FDR from becoming a dictator & packing the Court. This is not that Democrat Party; it has totally gone insane. They have autistic fits when male predators are barred from my daughter’s locker room!! They think XX can become XY & vice-versa. These people want to make it ILLEGAL for you to call the cops if a male pedophile is dressing in the same room with your 10-year-old daughter.
Democrats are hell-bent on stacking the Supreme Court & they know that is slipping away as reliable Democrat states are hemorrhaging population. Those who are being the loudest about expanding the SCOTUS are a who’s-who of Crazy Town.
The obese Cori Bush, Rashida Tlaib, Hakeem Jeffries, the vacuous #AOC, Hank Johnson – they live in areas that are permeated with black-on-black murder, but they do not care about that. They just want your guns because you can’t institute a governmental system like China when those you oppose are armed.
If an old lady has her door kicked in & she’s got a shotgun handy (and knows how to use it), the villain will not do well.
Each state sends two people to the Senate, so that is not as important, but the House, as you know is apportioned by population. If the Dumocrats lose enough Electoral Votes, they will find tough sledding to win the White House & the Peoples’ House.
Efforts to limit https://www.congress.gov/bill/118th-congress/house-joint-resolution/1/text https://www.congress.gov/bill/118th-congress/house-joint-resolution/8/text https://www.congress.gov/bill/118th-congress/senate-bill/942/text the SCOTUS to nine justices have been unsuccessful.
Some might say, “We’ll just pack the Court too.” Problem is, Democrats will do the flight-of-the-bumblebee, get those 4 Justices confirmed & there go your gun rights, most private property (which includes those who rent to others), hello to mail-in elections & I would not be surprised if they harass that Court to do something to make sure these millions of illegal aliens Biden invited in are here to stay, the whole nine yards.
There won’t be an opportunity to strike back, get it? When Harry Reid broke the filibuster https://web.archive.org/web/20230110031425/https://professor_enigma.webs.com/bernie-sanders in 2014, Mitch McConnell told him, “You may regret this someday.”
A Donald Trump election victory & three Supreme Court Nominees later, the Dumbasscrats did regret that. If we “plan to get them back” there will not be a Republic left by the time they get finished running this country into the ground.
In conclusion, the Democrats are dumb, they want to talk to your kids about sex & they want to hypersexualize your children, so they can make them dysfunctional.
They also know an opportunity is slipping away as people vote w/ their feet – so, it is imperative that we survive until the 2030 midterms & then a massive shift is coming.
These retards know this, they know NY, CA & IL are losing their sway in the House & Presidential elections because people are voting w/a U-Haul.
We must at least win the Senate (3 are very winnable) in 2024 & if we win the WH with it, we are definitely safe from court packing until 2029. If we can maintain the Senate the entire time, the shift will make it much easier. Democrats know this, there will be astroturf riots this summer & intimidation tactics will be used.
I’m not fan of Star Trek, but they remind me of Khan, cursing Captain Kirk as he drew his last breath. The Democrats are mentally-ill, they’re desperate & their voters are dangerous. Mr. Chairman, I Yield Back!
Merry Christmas! ><> + <>< and especially to my friends Massachusetts Patriot & Jane 😉
350
views

Latifah Faisal (Story County, Iowa Supervisor) wants illegal alien migrant camps in Ames
Story County, Iowa Supervisor Latifah Faisal wants illegal alien migrant camps all over Ames, Iowa. She had a hissy fit & blocked me when I asserted that Kim Reynolds was right for telling Fake POTUS Joe Biden to jump in a lake when he wanted to dump illegal alien migrants in Iowa. Latifah Faisal is not good at taking care of herself (she once whined that she had to go to a skating rink to get the interwebs decades ago & probably thought someone else should pay for it – why didn’t her parents pay for it?) & she would not take in several single, young adult males from Honduras into her rural Iowa home – but she’s ok w/ taxpayers paying for it.
Vote this lunatic out, she is promoting policies that will create tent cities all over Iowa (Reynolds will block this, as will the Legislature), overrun hospitals & cause hyperinflation. Her policies will guarantee that the shelves are empty. She wants to bring this economy down on purpose.
No immigration by merit, she wants to import voters from the 3rd world that will become a burden on taxpayers, build them public housing (on your dime), give them free health care, a free education, etc. Latifah Faisal does NOT want meritorious immigration, she wants immigrants that she can sign up for a bevy of benefits & then register them to vote.
The end-game of this is to give amnesty to these people, so they can stack the Supreme Court, nullify an individual right to own a firearm & confiscate private property. Then & only then can they put dissenters into camps and/or murder them. This is the path every dictator takes because every intelligent dictator disarms their opponents first.
Latifah Faisal wants to turn Iowa into California, don’t let her do it. Latifah Faisal wants to turn the U.S. into California, don’t do it. She has never had a job in the private sector where she’s paid a dime in taxes. She has never created a job & never will.
Send her packing in November, back to her other taxpayer-funded job doing something for Story County. Latifah Faisal & Klaus Schwab have a lot in common, their end-game is the same, period https://rumble.com/v2nu6z6-they-the-democrats-want-you-to-be-poor.html https://rumble.com/v2gaoks-divorcee-sam-seder-wants-to-sell-rural-america-some-snake-oil.html
My previous responses to this lunatic https://web.archive.org/web/20230830001607/https://professor_enigma.webs.com/steve-orourke-story-county https://web.archive.org/web/20230830001619/https://professor_enigma.webs.com/latifah-faisal-story-county https://rumble.com/user/UTubekookdetector?q=latifah%20faisal
Some data on immigration, a bit dated but still relevant https://rumble.com/vdr66v-old-fart-rants-is-dung-now-by-utubekookdetector-illegal-immigration.html When Democrats say our immigration system is broken, what they mean is we’re not letting in enough people willy-nilly, they hate merit, which is counterproductive to their open borders scheme.
Ask them to tell you how many people were naturalized per year under Obama, the Bushes, Clinton or Reagan. Answers like, “too few” or “not enough” will not be accepted.
PS the Democrats are flummoxed now that the public is getting upset at this, so do not believe the lies they will tell over the next 11 months. They’ll tell you, “We’re going to hire more border agents, we’re going to close the border, we’re going to crack down.”
DO NOT believe it, it is a lie. They want to keep the WH in 2024, keep the Senate & gain the House on the back of that lie. As soon as that happens, they will open the border up again & begin the process to give amnesty to ~10+ million illegal aliens (that they purposely spread out all over this country, many times in the dead of night so it’s difficult to keep track of them. They have no intention of getting to their hearing, period), so they can stack the SCOTUS, take your guns away & confiscate private property
265
views
1
comment

Creepy Sam Seder is worried about guns, his voters are the problem PART II
Creepy divorcee Sam Seder is crying about guns, but his voters are the problem.
Let us continue where we left off here https://rumble.com/v3vdj4w-creep-sam-seder-is-worried-about-guns-his-voters-are-the-problem-part-i.html & cover the worst of the worst (some cities will be excluded from the previous list) & see how they compare to national data on the % of aggravated assault & robbery cases where the perpetrator uses a firearm. https://cde.ucr.cjis.gov/LATEST/webapp/#/pages/explorer/crime/crime-trend
Here is the previous data: From 2007-21, there were 4,370,720 KNOWN weapons involved in “Aggravated Assault” & “Robbery.” Of those weapons, only 32.13% (1,404,638) of the weapons were a “firearm/handgun/shotgun/rifle” etc.
For Robbery & Aggravated Assault 2012-2021 there were 3,171,135 KNOWN weapons & 33.82% (1,072,722) were a “Firearm/gun.”
For Robbery & Aggravated Assault 2016-19 there were 1,197,292 KNOWN weapons & 32% (383,216) of them were a “firearm/gun.”
For Robbery & Aggravated Assault 2020-21 there were 1,024,692 KNOWN weapons to commit those crimes & 38.19% (391,347) of the weapons were a “firearm/gun.”
For Robbery & Aggravated Assault 2022 there were 679,388 KNOWN weapons to commit those cries & 36.29% (246,575) were a “firearm/gun.”
2012-21: Of the 3,558,253 Offenders (Robbery & Aggravated Assault) where the RACE of the offender was known, 51.47% (1,831,496) of those offenders were Black. #blacklivesmatter
2016-19: Of the 1,357,434 offenders (Robbery & Aggravated Assault) where the RACE of the offender was known, 50.67% (687,910) of those offenders were Black. #whitesupremacy
2020-21: Of the 1,073,654 offenders where the RACE of the offender is KNOWN, 51.22% (549,929) of those offenders were Black.
2022: Of the 685,050 robbery/aggravated assault perps where their race was KNOWN, 49.97% (342,339) of the offenders were Black. Let’s get started!
***
https://cde.ucr.cjis.gov/LATEST/webapp/#/pages/explorer/crime/crime-trend Because I want to tally the Saint George Floyd “let’s burn the town down for a drug addict” riots/hissy fit, I will tally 2020-2022, which will take longer than if I used a 5 or 2-year period, due to the FBI not allowing a 3-year tally all at once.
Portland 2020-2022 (Robbery & Aggravated Assault): Of the 10,112 offenders where the race is KNOWN, 37.26% (3,768) of them were Black. Of the 11,170 KNOWN weapons to commit those crimes, 27.99% (3,127) were a “firearm/gun.” Portland is only 13.6% Black. https://www.census.gov/quickfacts/ Portland is a diverse dunghole run by Democrats & they’re running it right into the ground.
Minneapolis, MN 2020-22: Of the 17,704 KNOWN offenders, 85.02% (15,053) of them were Black. Of the 12,737 KNOWN weapons, 46.75% (5,955) were a “firearm/gun.” Minneapolis is only 18.4% Black.
St. Paul, MN 2020-22: Of the 4,245 KNOWN weapons, 44.8% (1,902) were a “firearm/gun.” Of the 3,108 KNOWN perpetrators, 72.29% (2,247) of them were Black. St. Paul is 16% Black.
Milwaukee, WI 2020-22: Of the 24,533 KNOWN offenders, 87.21% (21,397) were Black. Of the 23,619 KNOWN weapons, 49.56% (11,706) were a “firearm/gun.” Milwaukee is 39.4% Black.
District of Columbia 2021-22: Of the 6,308 known offenders, 96.48% (6,086) were Black & of the 6,361 known weapons, 49.74% (3,164) were a “firearm/gun.” The city is 45% Black.
St. Louis City, MO 2021-22: Of the 6,444 known weapons, 63.34% (4,082) were a “Firearm/gun” & of the 5,160 known offenders, 88.97% (4,591) were Black. Surprised? The city is 44.8% Black.
Kansas City, MO 2020-22: Of the 15,082 known weapons, 52.42% (7,907) were a “firearm” & of the 15,740 known offenders, 73.24% (11,529) were Black. The city is 26.5% Black.
Springfield, MO 2020-22: Of the 7,640 known weapons, 22.93% (1,752) were a “firearm/gun” & of the 5,973 known offenders, 27.1% (1,619) were Black. Springfield is only 4% Black.
Detroit, MI 2020-22: Of the 28,712 known weapons, 52.47% (15,066) were a “firearm/gun” & of the 22,462 known offenders, 93.08% (20,908) were Black. The city is 77.9% Black.
Flint, MI 2020-22: Of the 1,993 known weapons, 52.13% (1,039) were a “firearm/gun” & of the 1,734 known offenders, 77.33% (1,341) were Black. Flint is 56.7% Black.
Pontiac, MI 2020-22: Of the 1,464 known weapons, 34.9% (511) were a “firearm/gun” & of the 1,702 known offenders, 77.43% (1,318) were Black. The city is 47.7% Black.
Lansing, MI 2020-22: Of the 3,514 known weapons, 35.97% (1,264) were a “firearm/gun” & of the 3,004 known offenders, 69.37% (2,084) were Black. The city is 24.2% Black.
Memphis, TN 2020-22: Of the 27,690 known weapons, 74.71% (20,689) were a “firearm/gun” & of the 32,199 known offenders, 88.84% (28,607) were Black. The city is 64.6% Black.
Nashville, TN 2020-22: Of the 18,904 known weapons, 48.88% (9,242) were a “firearm/gun” & of the 22,608 known offenders, 70.24% (15,880) were Black. The city is 26.9% Black.
Chattanooga, TN 2020-22: Of the 5,036 known weapons, 46.32% (2,333) were a “firearm/gun” & of the 4,988 known offenders, 71.89% (3,586) were Black. The city is 30.6% Black.
Austin, TX 2020-22: Of the 11,449 known weapons, 42.58% (4,876) were a “firearm/gun” & of the 13,673 known offenders, 58.37% (7,982) were Black. The city is 7.7% Black. Can you say “disproportionate”?
Dallas, TX 2020-22: Of the 25,295 known weapons, 63.32% (16,018) were a “firearm/gun” & of the 32,277 known offenders, 65.58% (21,170) were Black. The city is 24% Black.
Houston, TX 2020-22: Of the 67,755 known weapons, 45.22% (30,645) were a “firearm/gun” & of the 98,412 known offenders, 64.69% (63,668) were Black. The city is 22.6% Black.
San Antonio, TX 2020-22: Of the 18,209 known weapons, 52.24% (9,514) were a “firearm/gun” & of the 16,080 known offenders, 23.6% (3,796) were Black. The city is 6.5% Black.
Fort Worth, TX 2020-22: Of the 10,791 known weapons, 48.46% (5,230) were a “firearm/gun” & of the 12,997 known offenders, 60.29% (7,837) were Black. The city is 18.8% Black.
Corpus Christi, TX 2020-22: Of the 5,696 known weapons, 37.11% (2,114) were a “firearm/gun” & of the 7,145 known offenders, 14.34% (1,025) were Black. The city is 3.9% Black.
Lubbock, TX 2020-22: Of the 5,725 known weapons, 36.57% (2,094) were a “firearm/gun” & of the 7,047 known offenders, 33.13% (2,335) were Black. The city is 8.1% Black.
Seattle, WA 2020-22: Of the 16,162 known weapons,16.52% (2,670) were a “firearm/gun” & of the 11,456 known offenders, 51.36% (5,884) were Black. The city is only 6.8% Black.
Tacoma, WA 2020-22: Of the 6,025 known weapons, 49.32% (2,972) were a “firearm/gun” & of the 6,626 known offenders, 51.04% (3,382) were Black. The city is only 10.8% Black.
Wilmington, DE 2020-22: Of the 2,307 known weapons, 41.09% (948) were a “firearm/gun” & of the 3,003 known offenders, 90.17% (2,708) were Black. The city is 56.7% Black.
Cleveland, OH 2020-22: Of the 13,534 known weapons, 33.13% (4,484) were a “firearm/gun” & of the 9,126 known offenders, 81.52% (7,440) were Black. The city is 47.4% Black.
Columbus, OH 2020-22: Of the 10,090 known weapons, 55.61% (5,612) were a “firearm/gun” & of the 13,255 known offenders, 78.85% (10,452) were Black. The city is 29.2% Black.
Akron, OH 2020-22: Of the 3,763 known weapons, 42.83% (1,612) were a “firearm/gun” & of the 3,270 known offenders, 72.59% (2,374) were Black. The city is 30.1% Black.
Toledo, OH 2020-22: Of the 5,995 known weapons, 52.82% (3,167) were a “firearm/gun” & of the 6,886 known offenders, 75.53% (5,201) were Black. The city is 28.1% Black.
Dayton, OH 2020-22: Of the 3,328 known weapons, 52.13% (1,735) were a “firearm/gun” & of the 4,004 known offenders, 75.34% (3,017) were Black. The city is 38.5% Black.
Cincinnati, OH, 2020-22: Of the 5,939 known weapons, 61.15% (3,632) were a “firearm/gun” & of the 8,621 known offenders, 89.15% (7,686) were Black. The city is 40.3% Black.
Denver, CO 2020-22: Of the 15,243 known weapons, 32.94% (5,022) were a “firearm/gun” & of the 17,275 known offenders, 38.91% (6,722) were Black. The city/county is 9.9% Black.
Oklahoma City, OK 2020-22: Of the 9,399 known weapons, 41.17% (3,870) were a “firearm/gun” & of the 11,309 known offenders, 54.58% (6,173) were Black. The city is 13.8% Black.
Tulsa, OK 2021-22: Of the 7,547 known weapons, 38.18% (2,882) were a “firearm/gun” & of the 6,339 known offenders, 52.4% (3,322) were Black. The city is 14.8% Black.
Buffalo, NY 2020-22: Of the 4,722 known weapons, 35.45% 1,674) were a “firearm/gun” & of the 3,575 known offenders, 74.74% (2,672) were Black. The city is 33.3% Black.
Rochester, NY 2021-22: Of the 2,619 known weapons, 53.07% (1,390) were a “firearm/gun” & of the 3,208 known offenders, 83.29% (2,672) were Black. The city is 38.4% Black.
Albany, NY 2020-22: Of the 1,686 known weapons, 22.65% (382) were a “firearm/gun” & of the 1,803 known offenders, 81.3% (1,466) were Black. The city is 27.7% Black.
Baton Rouge, LA 2021-22: Of the 3,906 known weapons, 55.81% (2,180) were a “firearm/gun” & of the 1,381 known offenders, 92.68% (1,280) were Black. The city is 53.3% Black.
Birmingham, AL 2021-22: Of the 4,986 known weapons, 68.73% (3,427) were a “firearm/gun” & of the 4,930 known offenders, 94.19% (4,644) were Black. The city is 68.7% Black.
Mobile, AL 2021-22: Of the 3,653 known weapons, 55.48% (2,027) were a “firearm/gun” & of the 3,686 known offenders, 81.33% (2,998) were Black. The city is 52.5% Black.
Indianapolis, IN 2020-22: Of the 22,782 known weapons, 53.57% (12,206) were a “firearm/gun” & of the 19,534 known offenders, 71.55% (13,977) were Black. The city is 28.8% Black.
South Bend, IN 2020-22: Of the 1,534 known weapons, 53.19% (816) were a “firearm/gun” & of the 1,594 known offenders, 76.72% (1,223) were Black. The city is 25.2% Black.
Louisville, KY 2020-22: Of the 12,735 known weapons, 56.34% (7,175) were a “firearm/gun” & of the 9,783 known offenders, 66.45% (6,501) were Black. The city is 23.8% Black.
Atlanta, GA 2020-22: Of the 7,608 known weapons, 63.65% (4,843) were a “firearm/gun” & of the 6,400 known offenders, 96.28% (6,162) were Black. The city is 48.2% Black.
Bibb County Sheriff’s Office, GA (Macon) 2020-22: Of the 2,605 known weapons, 73.93% (1,926) were a “firearm/gun” & of the 1,737 known offenders, 89.81% (1,560) were Black. The county is 57.1% Black.
Athens-Clarke County, GA: Of the 1,352 known weapons, 41.78% (565) were a “firearm/gun” & of the 1,228 known offenders,76.95% (945) were Black. The county is 27.5% Black.
Raleigh, NC 2020-22: Of the 4,105 known weapons, 48.47% (1,990) were a “firearm/gun” & of the 5,498 known offenders, 78.93% (4,340) were Black. The city is 28.6% Black.
Greensboro, NC 2020-22: Of the 4,973 known weapons, 50.91% (2,532) were a “firearm/gun” & of the 3,180 known offenders, 78.8% (2,506) were Black. The city is 43.1% Black.
Durham City, NC 2020-22: Of the 3,852 known weapons, 57.39% (2,211) were a “firearm/gun” & of the 3,897 known offenders, 83.6% (3,266) were Black. The city is 37.2% Black.
Winston-Salem, NC 2020-22: Of the 5,427 known weapons, 54.56% (2,961) were a “firearm/gun” & of the 4,579 known offenders, 74.23% (3,399) were Black. The city is 33.5% Black.
Fayetteville, NC 2020-22: Of the 4,704 known weapons, 44.26% (2,082) were a “firearm/gun” & of the 4,292 known offenders, 82.19% (3,528) were Black. The city is 42.5% Black.
Wilmington, NC 2020-22: Of the 1,428 known weapons, 39.14% (559) were a “firearm/gun” & of the 1,070 known offenders, 62.14% (665) were Black. The city is 17.2% Black.
Greenville, NC 2020-22: Of the 973 known weapons, 48.81% (475) were a “firearm/gun” & of the 853 known offenders, 86.16% (735) were Black. The city is 39.2% Black.
Asheville, NC 2020-22: Of the 1,903 known weapons, 26.95% (513) were a “firearm/gun” & of the 1,341 known offenders, 42.05% (564) were Black. The city is 10.9% Black.
Columbia, SC 2020-22: Of the 2,080 known weapons, 56.77% (1,181) were a “firearm/gun” & of the 2,478 known offenders, 90.27% (2,237) were Black. The city is 40.9% Black.
North Charleston, SC 2020-22: Of the 2,809 known weapons, 51.69% (1,452) were a “firearm/gun” & of the 2,491 known offenders, 81.17% (2,022) were Black. The city is 43.7% Black.
Little Rock, AR 2020-22: Of the 6,953 known weapons, 48.88% (3,399) were a “firearm/gun” & of the 6,764 known offenders, 84.43% (5,711) were Black. The city is 41.2% Black.
North Little Rock, AR 2020-22: Of the 1,461 known weapons, 55.3% (808) were a “firearm/gun” & of the 1,171 known offenders, 83.17% (974) were Black. The city is 43.9% Black.
Jacksonville, AR 2020-22: Of the 687 known weapons, 43.52% (299) were a “firearm/gun” & of the 832 known offenders, 73.31% (610) were Black. The city is 45.2% Black.
Pine Bluff, AR 2020-22: Of the 1,344 known weapons, 71.87% (966) were a “firearm/gun” & of the 1,171 known offenders, 90.69% (1,062) were Black. The city is 76.9% Black.
Fort Smith, AR 2020-22: Of the 1,999 known weapons, 26.16% (523) were a “firearm/gun” & of the 2,537 known offenders, 35.27% (895) were Black. The city is 8.4% Black.
Norfolk, VA 2020-22: Of the 3,250 known weapons, 63.63% (2,068) were a “firearm/gun” & of the 1,684 known offenders, 83.31% (1,403) were Black. The city is 40.7% Black.
Newport News, VA 2020-22: Of the 2,594 known weapons, 48.45% (1,257) were a “firearm/gun” & of the 2,700 known offenders, 85.07% (2,297) were Black. The city is 41% Black.
Portsmouth, VA 2020-22: Of the 1,882 known weapons, 64.39% (1,212) were a “firearm/gun” & of the 1,279 known offenders, 84.75% (1,084) were Black. The city is 52.2% Black.
Petersburg, VA 2020-22: Of the 539 known weapons, 57.69% (311) were a “firearm/gun” & of the 427 known offenders, 88.52% (378) were Black. The city is 76.6% Black.
Roanoke City, VA 2020-22: Of the 1,071 known weapons, 51.63% (553) were a “firearm/gun” & of the 1,036 known offenders, 70.17% (727) were Black. The city is 29.3% Black.
Las Vegas, NV 2020-22: Of the 15,201 known weapons, 38.6% (5,869) were a “firearm/gun” & of the 18,300 known offenders, 57.85% (10,588) were Black. The city is 11.5% Black.
Waterloo, IA 2020-22: Of the 1,017 known weapons, 31.56% (321) were a “firearm/gun” & of the 880 known offenders, 64.88% (571) were Black. The city is 17.3% Black. Hello Black Hawk County, Iowa Supervisor Chris Schwartz. You're looking... fat today old man. PS quit projecting Waterloo's hood rat culture on the entire state of Iowa. Capiche?
Des Moines, IA 2020-22: Of the 2,481 known weapons, 22.08% (548) were a “firearm/gun” & of the 2,049 known offenders, 44.41% (910) were Black. The city is 11.2% Black.
Davenport, IA 2020-22: Of the 1,434 known weapons, 45.74% (656) were a “firearm/gun” & of the 1,555 known offenders, 60.7% (944) were Black. The city is 10.9% Black.
Fresno, CA 2021-22: Of the 8,195 known weapons, 27.5% (2,254) were a “firearm/gun” & of the 6,508 known offenders, 29.08% (1,893) were Black. The city is 6.8% Black.
Philadelphia, PA 2021-22: Of the 24,660 known weapons, 45.66% (11,261) were a “firearm/gun” & of the 23,911 known offenders, 80.49% (19,246) were Black. The city is 40.8% Black.
And that is all folks! If you did not see a big city (such as Los Angeles) it is because they did not report NIBRS data. PART II is done, Part III will focus on murder rates for various Democrat-dominated or Democrat-leaning dungholes, as well as the (if that data exists on the local level or FBI) demographics of the murder perpetrators.
As you can see, there are large swaths of the country (see my previous installment https://rumble.com/v3vdj4w-creep-sam-seder-is-worried-about-guns-his-voters-are-the-problem-part-i.html) where murder (and in this case, aggravated assault & robbery) & other violent crimes are not very common, yet guns are common.
It’s not about the guns, it’s about the fatherless children & meth addicts that wield them. Democrat Leninists like the divorcee Sam Seder #samseder #majorityreport want to use that as a proxy to disarm (mostly rural) law-abiding Americans so the next time BLM riots, nobody will stop them.
They intend to demonize the police & in concert w/ that, thin their ranks (by intimidation) or deprive them of funds so they can’t do their job. Another intention is to intimidate the police so they do no proactive, broken windows policing (Ferguson Effect), which allows BLM to riot sans any pushback.
If Kyle Rittenhouse comes along & puts some of them in the ground, they intend to put him in prison for murder.
Creepy divorcee Sam Seder & his allies intend on stacking the SCOTUS w/ lunatics who will suddenly find that the 2nd Amendment does not apply to “We The People” & does not contain the right to bear arms on an individual level.
Why? Because you can’t murder your opponents & put them in jail, confiscate private property & institute a police state if your opponents are armed. Ask the British Crown what happened when some well-armed group of colonists told them they were tired of their oppression.
Part III will focus on national murder rates 2020-22 & a slew of cities run by Democrats. I will utilize FBI & local & state data for that. It will be large & time-consuming, but will further my detonation of Creepy Sam Seder & Brian Tyler Cohen’s whining about guns & “red state murder problems.”
261
views
6
comments

Creepy Sam Seder vs. Ron DeSantis & sound logic
Ron DeSantis & that thing called "basic logic" just nuked one of the Divorcee Sam Seder's favorite arguments. Whoops!
Ron DeSantis destroys creepy old man Sam Seder & the “logic” he employs to undermine his opponents.
The divorcee Sam Seder still owes Roy Moore an apology. https://rumble.com/v1g1qwv-divorcee-sam-seder-and-david-miss-pakman-owe-roy-moore-an-apology.html He owes Brett Kavanaugh an apology too. Hey Sam Seder, you owe your ex-wife and kids an apology too, come to think of it. https://rumble.com/vcj22f-face-bloat-stan-seder-i-mean-sam-seder-vs.-face-bloat-stan-seder.html
Sam Seder #samseder #majorityreport employs bad logic on a regular basis. https://rumble.com/v2e7snu-sam-seder-vs.-sound-logic-sam-seder-is-divorced-from-reality.html
Will the creepy old man Sam Seder now admit (using his logic) that Gavin Newsom’s policies are bad & ineffective because his in-laws left California for Florida?
BONUS: Facebook & Rumble user Mark D. Langdon debated me on why the most violent counties in America have beaucoup black on black murder & typically vote Demoncrat. He also debated me on whether biological males like Dylan Mulvaney should be able to hang out in his niece’s restroom. It did not go well for the old man.
https://rumble.com/v3w8icm-creepy-mark-d.-langdon-and-biopolaroid-sam-seder-flunked-science.html https://rumble.com/v3d43ic-mark-d.-langdon-facebook-idiots-on-parade.html https://rumble.com/v36edqs-creep-sam-seder-and-mark-d.-lang-flunked-biology-anatomy-and-physiology.html https://rumble.com/v2vn5na-utubekookdetector-vs-mark-lang-black-on-black-murder.html https://rumble.com/v2lnxy8-sam-seder-supporter-mdl61-gets-pwned-again.html https://rumble.com/v2bv0gy-sam-seder-supporter-mdl61-gets-pwned.html https://rumble.com/v3u6uai-creepy-sam-seder-and-mark-d.-langdon-find-out-biology-is-real-science.html That’s his Facebook page > https://www.facebook.com/profile.php?id=1598664829
DOUBLE BONUS: Sam Seder debunked on supposed “Republican Voter Suppression” https://rumble.com/v24tyd2-divorcee-sam-seder-debunked-on-republican-voter-suppression.html
TRIPLE BONUS: COVID-19 lockdowns get nuked! https://rumble.com/v2rgw38-covid-19-lockdowns-get-nuked.html
QUADRUPLE BONUS: Brian Tyler Cohen’s Red State/Blue State Murder essay gets nuked! https://rumble.com/v3mu0q4-brian-tyler-cohens-red-stateblue-state-homicide-pap-gets-nuked.html
QUINTUPLE BONUS!!! Story County, Iowa Supervisor Latifah Faisal #latifahfaisal #faisal4story #faisal4storycounty tried the “someone I like got a threat, that means my Marxist, gun-grabbing, expose your kids to ‘transgender’ policies are right” card & I obliterated it. https://rumble.com/vppty5-story-county-iowa-supervisor-latifah-faisal-is-worried-about-threats-to-ros.html https://rumble.com/vppupx-story-county-iowa-supervisor-latifah-faisal-is-worried-about-threats-to-ros.html https://rumble.com/vppw00-story-county-iowa-supervisor-latifah-faisal-is-worried-about-threats-to-ros.html Just because someone you like got a threat, does not mean “the other side is wrong.”
Ted Kennedy drove off a bridge, got away w/ negligent manslaughter & stayed in the Senate another 4+ decades. VOTE REPUBLICAN!
She would reject that argument, admitting that her argument is B.S. Latifah Faisal is not very bright.
287
views
3
comments

Stephen Colbert ruptured his appendix, Sen. Rand Paul did not laugh
I am not insinuating that Senator Rand Paul would laugh about Stephen Colbert's ruptured appendix, he's better than that.
However, since Colbert supports male predators/pedophiles https://www.dailydot.com/upstream/stephen-colbert-transgender-bathroom-ban-target-boycott/ hanging out in the same restroom as little girls, I do not have the same sentiment.
You are either XX or XY, there is no "other" as Colbert insinuates. To deny that is insanity, meaning you should probably be locked up. If you know Dylan Mulvaney is a man, but still support him changing in the same room w/ little girls, you are also insane & should likely be locked-up. https://rumble.com/v3w8icm-creepy-mark-d.-langdon-and-biopolaroid-sam-seder-flunked-science.html https://rumble.com/v3u6uai-creepy-sam-seder-and-mark-d.-langdon-find-out-biology-is-real-science.html https://rumble.com/v36edqs-creep-sam-seder-and-mark-d.-lang-flunked-biology-anatomy-and-physiology.html
Speaking of creeps, Sam Seder #samseder #majorityreport & a man named Mark D. Langdon from Florida (the latter refuses to answer whether he supports Dylan Mulvaney changing in the same room w/ his niece) also support Dylan Mulvaney & other mentally-ill men changing in the same room w/ my daughter. Try that in Iowa, you get arrested, period.
If you want to ask Mark D. Langdon (you will likely be blocked) if he supports biological men changing in the same room w/ little girls, I will link to his PUBLIC Facebook account. https://rumble.com/v3d43ic-mark-d.-langdon-facebook-idiots-on-parade.html https://www.facebook.com/profile.php?id=1598664829
It's hard to feel sorry for Stephen Colbert, a man who laughed about Rand Paul being assaulted -- after he makes an untimely trip to the hospital.
While Nurse Ratched dumps his colostomy bag, maybe Stephen Colbert will watch the King of Late Night, Greg Gutfeld?
202
views
4
comments
Creepy Sam Seder, Ohio Abortion Ballot Initiative & the Roe Effect
Creepy Sam Seder probably thinks Black women killing his voters is a good idea. His victory lap might be a bit premature.
https://www.ohiosos.gov/elections/election-results-and-data/
https://www.biggestuscities.com/city/columbus-ohio https://www.biggestuscities.com/city/cleveland-ohio https://www.biggestuscities.com/city/cincinnati-ohio https://www.biggestuscities.com/city/toledo-ohio https://www.biggestuscities.com/city/akron-ohio https://www.biggestuscities.com/city/dayton-ohio https://www.census.gov/library/publications/1960/dec/population-pc-p1.html https://www2.census.gov/census_2000/census2000/states/oh.html https://www.census.gov/quickfacts/fact/table/OH/PST045222 https://www.census.gov/quickfacts/fact/table/daytoncityohio,clevelandcityohio,cincinnaticityohio,toledocityohio,akroncityohio,columbuscityohio/PST045222
Ohio population 1960 = 9,647,079 * 2000 = 11,353,140 * 2010 = 11,536,504 * 2020 = 11,799,374 * 2022 = 11,756,058
Akron, Cincinnati, Dayton, Cleveland, Columbus, Toledo population 1960 = 2,720,602 [28.2% of OH’s population] Akron, Cincinnati, Dayton, Cleveland, Columbus, Toledo population 2000 = 2,220,151 [19.55% of OH’s population] * 2010 = 2,108,636 [18.27% of OH’s population] * 2020 = 2,186,270 [18.52% of OH’s population] 2022 = 2,169,845 [18.45% of OH’s population]
https://ohiohouse.gov/members/directory https://ballotpedia.org/Ohio_House_of_Representatives https://uselectionatlas.org/RESULTS/ https://www.zipdatamaps.com/politics/state-level/districts/map-of-ohio-state-house-of-representative-districts https://ohiohouse.gov/members/district-map https://ohiohouse.gov/members/district-map
Ohio Abortion ballot measure, Issue I https://ballotpedia.org/Ohio_Issue_1,_Right_to_Make_Reproductive_Decisions_Including_Abortion_Initiative_(2023) There will be some haggling over this & moving goalposts will be employed. When does “fetal viability” occur? Do “reproductive decisions” encompass mutilating your genitals & “transitioning” to a women from a man (which is utter B.S. anyways)?
Creepy old man Sam Seder is doing a victory lap over the abortion vote in Ohio, but I think it might be a boomerang that comes back, only to clobber him.
https://mises.org/power-market/abortion-battle-we-dont-need https://rumble.com/c/Mises I’ve talked to my father about this a lot & I concur w/ Ron Paul on abortion – here is a snippet:
[Ron Paul quote begin] Former President Donald Trump infuriated many anti-abortion voters last week when he refused to commit to national abortion restrictions and seemed to blame them for Republican losses in the 2022 mid-term elections. Trump even criticized the six-week abortion ban signed by Florida Governor (and fellow Republican candidate) Ron DeSantis. So, not only is Trump balking at national restrictions but he is criticizing a state restriction. What are pro-life voters to do…
I strongly believe that the more difficult the issue is, the more local should be its solution. That is the real success of the Dobbs decision, because abortion should have never been a federal issue in the first place. Overturning Roe v Wade returned us to where we belonged, with state and local laws governing all issues not Constitutionally reserved for the Federal Government.
Bigger problems are best decided closest to home. Look for example at what happened when parents started going to school board meetings and demanding accountability on everything from Covid restrictions to transgenders in school bathrooms. Parents were extremely effective because they only had to travel to the local school board meeting to demand – and get - results. Does anyone think they would have been able to get the same results at the Department of Education in Washington DC? [Ron Paul quote end]
So, if I were a Republican in the U.S. House, U.S. Senate or running for a spot in one of those establishments, I would come out & say I would vote “Present” on any legislation addressing abortion rights or abortion in Congress. Period.
We did not fight this hard to return it to those clowns in Washington & we got a good Federalism (and perhaps a lean towards dual Federalism once again that existed prior to FDR’s New Deal, which tore a lot of that down) w/ the Dobbs ruling.
I’ve urged my elected officials in Washington to de-centralize other items like so-called “Means-Tested Entitlements (Medicaid, Food Stamps, LIHEAP, Unemployment Insurance, etc.) & give that power back to the states where it belongs.
The Marxists in the Democrat Party do not want that, they want a one-size-fits-all where Leviathan yokes every state & every citizen w/ a policy.
So, let us not undercut what was done in Dobbs by sending it back to Washington, let each state decide & in Ohio they decided.
Before Democrats take a victory lap on this, let us consider the demographics of abortion. https://www.facebook.com/permalink.php?story_fbid=2983549468548116&id=1400591836843895 https://www.youtube.com/watch?v=SVXM692AGL4 https://www.cdc.gov/mmwr/volumes/71/ss/ss7110a1.htm https://www.cdc.gov/mmwr/volumes/70/ss/ss7009a1.htm
In New York City & many other areas such as Alabama, Arkansas, Delaware, Michigan, New Jersey, Tennessee and Virginia – the vast majority of aborted children tend to be black. For 2016 in these United States for the areas reporting data on abortions by ethnicity there were 126,841 abortions performed on “white” women, 137,510 abortions performed on “black” women, 29,731 abortions performed on women categorized as “other” race & 68,164 abortions performed on “Hispanic” women.
Among the 30 areas that reported race by ethnicity data for 2020, non-Hispanic White women (White) and non-Hispanic Black women (Black) accounted for the highest percentages of all abortions (32.7% and 39.2%, respectively), and Hispanic women and non-Hispanic women in the other race category accounted for lower percentages (21.1% and 7.0%, respectively) (Table 6). White women had the lowest abortion rate (6.2 abortions per 1,000 women aged 15–44 years) and ratio (118 abortions per 1,000 live births), and Black women had the highest abortion rate (24.4 abortions per 1,000 women aged 15–44 years) and ratio (426 abortions per 1,000 live births).
Among the 40 areas that reported by marital status for 2020, 13.7% of women who obtained an abortion were married, and 86.3% were unmarried (Table 7). The abortion ratio was 46 abortions per 1,000 live births for married women and 412 abortions per 1,000 live births for unmarried women… Among the 43 areas that reported the number of previous live births for 2020, 39.1%, 24.5%, 20.3%, 9.7%, and 6.4% of abortions reported were among women who had zero, one, two, three, or four or more previous live births, respectively (Table 8). Among the 42 areas that reported the number of previous induced abortions for 2020, 57.7%, 24.1%, 10.5%, and 7.8% of abortions reported were among women who had had zero, one, two, or three or more previous induced abortions, respectively (Table 9)…
In reporting areas that provided data that met CDC reporting standards, abortions that were categorized by weeks of gestation were further categorized by age and by race or ethnicity (Table 14). In every subgroup for these characteristics, the highest percentage of abortions occurred at ≤9 weeks’ gestation. In 41 reporting areas, by age, 61.0% of adolescents aged <15 years and 75.5% of adolescents aged 15–19 years obtained an abortion at ≤9 weeks’ gestation, compared with ≥80.6% among women aged ≥20 years. Conversely, 18.7% of adolescents aged <15 years and 9.1% of adolescents aged 15–19 years obtained an abortion after 13 weeks’ gestation, compared with 6.3%–7.2% for women aged ≥20 years. In 28 reporting areas, by race or ethnicity, 80.1% of abortions obtained by Black women occurred at ≤9 weeks’ gestation, compared with 81.5% of non-Hispanic women in the other race category, 82.0% of White women, and 83.9% of Hispanic women. Conversely, 5.4% of abortions obtained by Hispanic women occurred after 13 weeks’ gestation, followed by 6.2% of White women, 6.3% of Black women, and 6.9% of non-Hispanic women in the other race category…
Among the 30 areas that reported race by ethnicity data for 2019, non-Hispanic White women and non-Hispanic Black women accounted for the largest percentages of all abortions (33.4% and 38.4%, respectively), and Hispanic women and non-Hispanic women in the other race category accounted for smaller percentages (21.0% and 7.2%, respectively) (Table 6). Non-Hispanic White women had the lowest abortion rate (6.6 abortions per 1,000 women) and ratio (117 abortions per 1,000 live births), and non-Hispanic Black women had the highest abortion rate (23.8 abortions per 1,000 women) and ratio (386 abortions per 1,000 live births).
Among the 42 areas that reported by marital status for 2019, 14.5% of women who obtained an abortion were married, and 85.5% were unmarried (Table 7). The abortion ratio was 46 abortions per 1,000 live births for married women and 394 abortions per 1,000 live births for unmarried women.
Illinois, Georgia, Florida, District of Columbia, New York City & Michigan were some of the jurisdictions w/ the highest rates.
The women receiving abortions tend to be Black & not married. Unfortunately, many black children grow up in a single-parent household even if they are able to get out of the womb alive. This policy, along w/ the welfare state, an ineffective & evil government education system, a lack of personal responsibility & a victim mentality pushed by Marxists has ravaged the black community. https://rumble.com/v1mtkci-divorcee-sam-seder-suddenly-concerned-about-fatherless-black-children.html https://rumble.com/v1mt84s-more-information-on-out-of-wedlock-births-2010-2017.html
As an aside, I think Ohio Speaker (Ballotpedia link) Jason Stephens had the best answer on this: in response to statement from Ohio Republican lawmakers regarding “removing jurisdiction from the judiciary”: “I mean, we believe in the constitution and the three branches of government. I think, you know, this is ‘Schoolhouse Rock’-type stuff. We need to make sure that we have the three branches of government, and the constitution is what we abide by.”
Abortion remaining a right enshrined in the Ohio Constitution guarantees that fewer black women will experience live births & that will be typically occurring in the list of Ohio cities I posted above.
Those cities (Akron, Dayton, Columbus, Cincinnati, Toledo & Cleveland) tend to be more “diverse” than Ohio en masse, ergo, the vast majority of abortions will be performed on unmarried, young black women, ensuring their population does not grow as much.
Those cities all lean Democrat or are staunch Democrat & have been for some time. They typically vote Democrat in statewide elections & all the Ohio State House Districts for those cities are Democrat.
It’s not college-educated, non-Hispanic, White women getting the vast majority of abortions, it’s Black women & they vote Democrat in greater numbers than any other gender/demographic. In essence, Democrats are ensuring their voters do not reproduce, which is fine by me, but if they had a father to teach them to keep their pants on until they’re married, maybe they would not be slaughtering their children.
Go ahead, kill all your children, chop that family tree down. This is part of the reason Democrats are trying to import millions & millions of poor folks from other countries, this is to replace all their voters that have been murdered since Roe v. Wade.
https://web.archive.org/web/20230306061501/https://odh.ohio.gov/explore-data-and-stats/published-reports/data-and-stats-abortion-reports https://odh.ohio.gov/wps/portal/gov/odh/know-our-programs/vital-statistics/resources/vs-abortionreport2021 https://odh.ohio.gov/know-our-programs/vital-statistics/resources/vs-abortionreport2020
Approximately 8.7% of women who obtained abortions in 2021 [in Ohio] were under 20 years of age; with another 29.5% between the ages of 20-24 years of age (Table 2). While the age distribution of women obtaining abortions has remained relatively unchanged since 2004, the age-specific abortion rates for women under age 25 have steadily decreased (Figure 5).
Approximately 80% of women who obtained abortions in Ohio were never married, divorced, or widowed (Table 2). Approximately 12% of women who obtained abortions in Ohio were married or separated (Table 2). Approximately 42.6% of resident women who obtained abortions and for whom race was reported were White; 49% were Black; 3.1% were Asian/Pacific Islander; and 4.9% reported more than one race (Figure 2). 5% of women with known ethnicity who obtained abortions were of Hispanic origin (Table 1).
Perusing the data (Table 2), you will see Blacks are disproportionately aborted & in 2020 & 2021 the numbers of Black children that were snuffed out increased to a point where they were more than the White total nominally.
The % of abortions for Blacks (relative to all abortions in OH) are always well beyond their % of the population.
I believe this will only worsen after Issue I & this will lead to more of those diverse cities growing slowly or as Cleveland & Dayton have done for some time, they will shrink.
Those cities used to be large enough that they had a big say in who ran the Statehouse & who inhabited the Governors’ Mansion. Not anymore and this increased tenacity towards abortion will hammer more nails into that coffin.
You are killing your voters Democrats! https://www.wsj.com/articles/SB122695016603334449
[James Taranto quote begin] It is a statement of fact, not a moral judgment, to observe that every pregnancy aborted today results in one fewer eligible voter 18 years from now. More than 40 million legal abortions have occurred in the United States since 1973, and these are not randomly distributed across the population. Black women, for example, have a higher abortion ratio (percentage of pregnancies aborted) than Hispanic women, whose abortion ratio in turn is higher than that of non-Hispanic whites. Since blacks vote Democratic in far greater proportions than Hispanics, and whites are more Republican than Hispanics or blacks, ethnic disparities in abortion ratios would be sufficient to give the GOP a significant boost--surely enough to account for George W. Bush's razor-thin Florida victory in 2000…
The Roe effect would have made itself felt before post-Roe children even reached voting age. Children, after all, are counted in the population figures that determine states' representation in Congress and the Electoral College. Thus, if the greater prevalence of abortion post-Roe affected statewide fertility patterns, the results would have begun showing up after the 1980 reapportionment--in the 1982 election for Congress, and the 1984 election for president.
The first post-Roe babies reached voting age in 1991, in time for the 1992 election. In 1992 the Roe effect would have been minimal, since it was limited to a small segment of the electorate (18- and 19-year-olds), who tend not to vote. The affected segment of the population grows with each election, ranging up to 23-year-olds in 1996, 27-year-olds in 2000, and 31-year-olds in 2004. The Roe effect is compounded over generations. Children who are never born do not have children or grandchildren.
Critics of the Roe effect hypothesis point out that abortion does not necessarily diminish a woman's lifetime fertility. A woman may, for example, have an abortion while in college, but later marry and bear children – children she might not have had, had she been forced to carry her collegiate pregnancy to term. Yet it is not clear how much this might mitigate the Roe effect. Some women do abort their final pregnancy, and delayed childbearing is one manifestation of the Roe effect. If a woman has a child at, say, age 30 rather than 20, one additional census passes before the child counts toward his state's congressional and electoral college apportionment, and two or three presidential elections pass before he reaches voting age. The compounding element applies here as well; if a woman has a daughter at 30 rather than 20, the daughter reaches childbearing age a decade later than she otherwise would have. Moreover, attitudes about abortion and politics are subject to change with age and experience, and usually in a conservative direction. Thus, some women who delay childbearing contribute to the Roe effect on both ends: by having abortions when they are young, single, and pro-choice, and by bearing children when they are older, married, and pro-life.
Has the Roe effect borne itself out in practice? The results are mixed. In terms of reapportionment, the trend is decidedly in favor of Republican states. The 30 states George W. Bush carried in 2000 had 271 electoral votes, a bare majority. Reapportionment after the 2000 census increased that number to 278. In the 1980s, they were worth only 267 electoral votes, not enough for a majority; in the 1970s, 260. The trend continues: Of the 10 fastest-growing states in 2003-04, Bush carried nine in 2004. (One of them, New Mexico, went for Al Gore four years earlier.)
[NOTE: I will have a video soon on the coming 2030 massive Census realignment. For what it’s worth, states that Donald Trump won twice (IA, MT, ND, SD, FL, SC, AL, IN, OH, UT, ID, WY, KS, OK, TX, TN, NE, MO, AR, AK, KY, MS, WV, LA & NC) had 229 electoral votes in 2004, 232 electoral votes in 2012 & will have 230 electoral votes in 2024. This total will be much larger in the 2032 POTUS sweepstakes following the 2030 Census, more on this in a forthcoming video. NY, CA & IL had 107 EVs in 2004, but will have 101 EVs in 2024. That total will be much lower by 2032. https://rumble.com/v1isntx-david-miss-pakman-debunked-vol.-i.html Stay tuned!]
But Roe effect doubters can point to 2004 exit-poll results that found 18- to 29-year-old voters--i.e., those born after 1975, who correspond closely with the post-Roe generation--were the only age cohort that supported John Kerry over Mr. Bush, by 54% to 45%. Yet caution is in order in interpreting these results. The Roe effect does not predict that younger voters will be more apt to vote Republican than older ones, only than they otherwise would be. Putting the Roe effect to a real test will require a longitudinal look at these voters. How will their voting pattern change, as they grow older and more settled? In any given year, the youngest age cohort will include a high proportion of lower-income and never-married voters, both traits that are highly correlated with voting Democratic. Marriage, in particular, tends to correspond with conservative attitudes on abortion and other social issues, and therefore with voting Republican. According to 2004 exit polls, Mr. Bush outpolled Mr. Kerry among married voters, 57% to 42%, while Mr. Kerry beat Mr. Bush among singletons, 58% to 40%...
And if Republicans keep winning the presidency and appointing Supreme Court justices, Roe v. Wade may eventually be overturned. [NOTE: Mr. Taranto was prophetic on this, wasn’t he?] (This almost certainly would have happened in 1992 if the Senate had approved Robert Bork's confirmation five years earlier.) If Roe goes by the boards, one would expect fertility to increase in states that outlawed abortion, which would presumably be largely conservative and Republican ones. If the Roe effect continues to operate, though, it would make those states more Democratic and liberal, since women who otherwise might get abortions would no longer have the option in their home states. But in the end, that may not matter. If Roe were overturned, the politics of abortion would change dramatically, and in the Democrats' favor. With the legality of abortion itself on the line, the debate would shift away from the pro-choice extremes, forcing pro-choice politicians to take a more centrist (and popular) position. Republicans would be torn between their antiabortion base and more moderate voters, for whom an outright ban on abortion is a bridge too far.
The best solution for both parties would likely be a return to the status quo ante Roe--that is, for Congress and the president largely to ignore abortion, and leave its regulation to the state legislatures. This would allow politicians, Democrat and Republican alike, to tailor their views to match those of their constituents and their own consciences, and it would remove abortion as a polarizing issue from national elections. Thus, one might say that both Roe and the Roe effect contain the seeds of their own demise. [Taranto quote end]
James channels Ron Paul & vice-versa, saying the end of Roe should also mean the end of Washington getting involved in abortion, period.
The Democrats will try to bait Republicans on this & my advice to any Republicans running to replace Sherrod Brown – when he has a hissy fit over Black children not getting killed 35 weeks into a pregnancy, tell him he might want to read the Dobbs opinion, it is a state issue & it should stay that way. I intend to vote “present” on any legislation addressing abortion in the U.S. Congress.
We need to relegate more activities to the states. We saw during COVID a bevy of states wreck their economies because they had a federal safety net that taxpayers in Iowa et al. states that did not shut the entire place down. Make them do it themselves & raise their own money, instead of relying on Leviathan & its ability to expand the money supply at will, risking the future of your grandchildren.
We need more state activity in issues like Medicaid, food stamps, LIHEAP, unemployment insurance, etc. This will keep states that are losing people, states that are declining (like NY, CA, IL) from sucking off the taxpayer teat, fleecing taxpayers in 47 other states.
I urge you ALL to write your U.S. Senators & your Congressman, tell them to vote “present” on any legislation addressing abortion. We did not work this hard to return it to the states, just so the criminal enterprise in Washington could create a one-size-fits-all regime… again.
States like California, New York, Illinois, Massachusetts – those states will likely have willy-nilly abortions. Get pregnant at a party (and most abortions are done early in the pregnancy) & you don’t want to bother putting the kid up for adoption – just go to Planned Parenthood & kill it. Their legislators will do what those sick people (and there are plenty of people leaving those states) want & abortion will be subject to zero restrictions. Go for it, just do not ask me to pay for it.
While I was watching coverage of the 2023 elections, Rick Santorum actually had an intelligent thought. He opined (paraphrase), “I am not a fan of direct democracy.”
Neither am I, but Iowa Republicans used this against Democrats in 2022, putting a https://ballotpedia.org/Iowa_Amendment_1,_Right_to_Keep_and_Bear_Arms_Amendment_(2022) constitutional amendment on the ballot which basically took red flag laws to the gallows. This is part of the reason I believe Zach Nunn was able to win a close race & Reynolds won by a YUUUGE margin.
I am generally against that though, just write to your legislators, have them do that for you & if you do not like what they’re doing then I suggest you replace them.
Here is Iowa’s bill https://www.legis.iowa.gov/legislation/billTracking/billHistory?ga=90&billName=HF732 https://www.legis.iowa.gov/docs/publications/LGE/90/Attachments/HF732_GovLetter.pdf
The ACLU & other mentally ill folks like Story County, Iowa Supervisor Latifah Faisal, Claire Celsi, etc. et al. are going crazy over this because they want Black children murdered in the final trimester.
They are the extremists, they are the group (and reading the bill Kim Reynolds signed into law will make this clear) that refuses to compromise, to find any middle ground Mr. Taranto was talking about.
They want abortions at nine months, they want you to pay for them & they’re throwing hissy fits that we have some Federalism making a small comeback in this country. The just-for-the-heck-of-it, willy-nilly abortions in Iowa will no longer happen.
If Democrats want more abortions, get rid of the federal welfare state, that will likely induce more of these people who get abortions (black women who at best, finished high school, are not married & poor) to get those abortions instead of being “punished with a baby.” I’m sure Barack Hussein Obama would agree w/ that.
In conclusion, the bi-polaroid Sam Seder #samseder #majorityreport may find out that this abortion victory in Ohio results in more Republican voters & bigger wins statewide for Republicans in Ohio.
It will also take a Democrat talking point (assuming the Ohio GOP takes my advice) away, they cannot whine about abortion in Ohio because the voters already spoke. Less black women will reproduce in cities that are already hemorrhaging population & more people will move out of those areas.
The Democrats in Ohio are becoming extinct & more of their voters are going to end up dead, this is the crazy silver-lining to this for the GOP.
GOP, just shut up about federal abortion legislation, the SCOTUS has spoken, leave it to the states & let’s work on giving more items to the states, just as it should be.
Exit Question for Story County, Iowa Supervisor Latifah Faisal: Why did you allow yourself to be punished with a baby? You have never mentioned the father of your children, but you often mention your parents & your daughters (she has two if I remember right) & you show us pictures of food you have cooked.
She is so co-dependent, she has to show us she can cook. Amazing! I make a mean bowl of oatmeal Latifah, but I keep that to myself.
Anyways, if there was no federal welfare state to lean on (and why did your parents not help you out when you needed the Internet, isn’t that their job?) would you have allowed yourself “to be punished with a baby?” https://transcripts.cnn.com/show/bb/date/2008-03-29/segment/01 https://www.youtube.com/watch?v=jszkPtsFH-k
If there were no dollars flowing from the Treasury into your wallet, would you have aborted those kids Latifah Faisal? All those posts you make are public, so you can’t tell me to mind my own business.
You can’t accuse me of being mean because you defend abortion as a sacrament, so if you had terminated your daughters in the womb, it’s no big deal. If you want more abortions, end the welfare state because the mistakes you made when you were much younger were your mistakes. It is not my fault you are incapable of cultivating a decent relationship w/ the opposite gender of your species, that is your fault.
Someone needed to sit you down & give you a Coming To Jesus talk, but you never got that & now your political views are a microcosm of your own failures as a human being.
If either of your progeny get raped, they can get an abortion in Iowa. If a physician determines the baby is not viable due to a defect or the health of the mother is in imminent danger, an abortion can be performed or just get it done before a fetal heartbeat is detected.
If they, like you, are “punished with a baby” because of their own inability to avoid “making a provision for the flesh” – get to the Planned Parenthood murder factory before a fetal heartbeat is detected (or if they’re exceedingly stupid, keep those Plan B pills stocked up in the medicine cabinet) or you’ll be forced to let that child live & then I would strongly suggest sending it to a middle class family in Idaho, where it will live a normal life safe from the mental illnesses permeating a few counties in Iowa. I Digress! Mr. Chairman, I Yield Back!
PS this renewed focus on abortion, much like the George Floyd riots will induce more Democrat constituencies to abort their children, just like the George Floyd riots induced more Democrat constituencies to murder Black folks.
This may make the 2030 Census shift (6+ years to go) even larger towards the GOP. Buckle up kids.
371
views
10
comments

Creepy Mark D. Langdon & biopolaroid Sam Seder flunked #science
Creepy Mark D. Langdon & bipolaroid Sam Seder flunked #science #facts #reality #samseder #majorityreport
The study Clay & Buck talked about https://www.ncbi.nlm.nih.gov/pmc/articles/PMC1180246/
Sam Seder is a creepy old man https://rumble.com/vcj22f-face-bloat-stan-seder-i-mean-sam-seder-vs.-face-bloat-stan-seder.html
My previous refutations of Mark D. Langdon https://rumble.com/v3d43ic-mark-d.-langdon-facebook-idiots-on-parade.html https://rumble.com/v36edqs-creep-sam-seder-and-mark-d.-lang-flunked-biology-anatomy-and-physiology.html https://rumble.com/v2vn5na-utubekookdetector-vs-mark-lang-black-on-black-murder.html https://rumble.com/v2lnxy8-sam-seder-supporter-mdl61-gets-pwned-again.html https://rumble.com/v2bv0gy-sam-seder-supporter-mdl61-gets-pwned.html https://rumble.com/v3u6uai-creepy-sam-seder-and-mark-d.-langdon-find-out-biology-is-real-science.html
mdl61 Here is Mark D. Langdon’s Facebook page if you want to ask this old man if he approves of biological men using the same locker room his niece uses https://www.facebook.com/profile.php?id=1598664829 He still refuses to answer that question. I wonder why?
You are either XX or XY, there is no middle ground or “other.” Genghis Khan could’ve cut off his genitals, taken boatloads of estrogen, put on a goofy wig, fake boobs, the whole nine yards & he would still be XY, period.
To deny that either makes you so insane you should be locked up or you want biological male predators in the same locker room as little girls & you should probably be locked up for that too.
If you feel the need to emasculate yourself, to butcher your genitals, wait until you’re 18. If you feel the need to consume alcohol, well, you have to wait until you’re 21 to do that. Same w/ cigarettes.
If you want to beclown yourself like Dylan Mulvaney, be my guest. If you ask my opinion, you should refrain from that behavior. But do not ask me to pay for it & do not demand to enter my daughter’s locker room if you are an XY male.
Doing so may be hazardous to your health & you’ll likely get arrested. This is not California, we do not celebrate predatory behavior & pedophilia. Have a nice day!
203
views

Wikipedia's Democrat election deniers get called out
Wikipedia's treasonous, baseless, ludicrous, disingenuous election deniers get called out by UTubekookdetector
https://en.wikipedia.org/wiki/2016_United_States_presidential_election Wikipedia’s entry on the 2016 POTUS election mentions “Russia” or “Russian” (not including sources & footnotes) 30+ times & “Russian interference” was mentioned 6 times. Sounds like election denial, eh?
https://en.wikipedia.org/wiki/Donald_Trump In its profile of Donald Trump, Wikipedia uses the term “election denial” & links to an essay https://en.wikipedia.org/wiki/Election_denial_movement_in_the_United_States that was hastily cobbled-together w/ a bevy of cut-and-paste sources to “prove” that Donald Trump’s claims about the 2020 election were false. They were not false though. https://web.archive.org/web/20220608034413/https://professor_enigma.webs.com/democrat-election-fraud https://web.archive.org/web/20220608034412/https://professor_enigma.webs.com/democrat-vote-fraud
In their hasty, sloppy article on election denial they mention Kari Lake, https://en.wikipedia.org/wiki/Kari_Lake https://en.wikipedia.org/wiki/Stacey_Abrams but fail to mention the morbidly-obese Stacey Abrams. In their profile of Abrams they say, “She narrowly lost the election to Republican candidate Brian Kemp, but refused to concede, accusing Kemp of engaging in voter suppression as Georgia Secretary of State. News outlets and political science experts have been unable to determine whether voter suppression affected its result.”
Contrast that w/ their just-so statements on the 2016 POTUS election & Russia’s role in it. Very disingenuous & amusing indeed. [I debunked a user on Gab named “LogicOnly” who was alleging Russian interference via spending on political ads & debunked that completely https://web.archive.org/web/20220513024507/https://professor_enigma.webs.com/archive ]
In their election denier essay they say, “An October 2022 Washington Post analysis found that 51% of Republican nominees for House, Senate and key statewide offices in nearly every state that year denied or questioned the 2020 election outcome…As of August 2023, a large majority of Republican voters and Republican-leaning independents continued to believe Joe Biden was not legitimately elected in 2020.”
Many Democrats falsely believed Donald Trump was an illegitimate President, but that was not included, was it? Why not? https://rumble.com/vj8jbz-latifah-faisal-story-county-iowa-supervisor-whines-about-the-jan.-6-insurre.html https://rumble.com/vhmkzl-latifah-faisal-vs.-utubekookdetector-stopthesteal-and-capitol-insurrection.html
https://en.wikipedia.org/wiki/Hillary_Clinton In their “article” on Hillary Clinton & as they did w/ the obese Stacey Abrams, they do not use the term “election denier” or “election denial.” Neither Clinton nor Abrams were mentioned in their “essay” on election denial. Odd?
https://en.wikipedia.org/wiki/Maxine_Waters Maxine Waters has a history of election denial, going all the way back on 2000, but Wikipedia fails to mention that history at all other than saying she objected to 3 POTUS elections on the House floor.
Why didn’t they attach the election denier tag to her? Was it because her claims were B.S. and/or some of their idiots might get confused & think that Republicans did not invent election denial?
Did Wikipedia do an analysis of Democrats in office or running for office & how many of them spewed forth misinformation & election denial after the 2016 POTUS election? Russia changed no votes, but that lie, The Big Lie has been spewed forth many times by Dumocrats.
https://en.wikipedia.org/wiki/John_Lewis Noted grifter John Lewis was not tagged w/ the “election denier” label, despite his false statements about the 2016 POTUS election & Wikipedia fails to mention him in their election denier essay. Wikipedia also thinks we’re a democracy, so they flunked High School Civics, but they have a lot of company out there in that regard.
https://en.wikipedia.org/wiki/Kamala_Harris The overweight Kamala Harris agreed w/ false statements made about so-called “Russian interference” in the 2016 election, yet she does not appear in Wiki’s “essay” on election denialism, nor do they tag her w/ the “election denier” label in their profile of her. Why not?
https://en.wikipedia.org/wiki/Hakeem_Jeffries Mr. Magoo, aka Hakeem Jeffries parroted lies about the 2016 Presidential election more than once, yet he does not appear in Wikipedia’s essay on election denialism, nor do they mention it on his profile page.
They do say this, “Jeffries voted to impeach President Donald Trump during both his first and second impeachments in the House. He repeatedly called Trump's presidency "illegitimate" due to the Russian interference in the 2016 United States presidential election.”
I guess they did not call him an election denier because Wikipedia wants to keep that false talking point alive. So, why not just call him an “election denier”? You know the answer to that.
https://en.wikipedia.org/wiki/Mike_Lindell Mike Lindell is taken to task for questioning the 2020 election, but James McGovern, https://en.wikipedia.org/wiki/Jim_McGovern_(American_politician) who spouted lies during the 2016 Electoral Vote tally was not labeled an election denier, nor did he appear in Wiki’s essay on election denialism.
They did say this, “On January 6, 2017, McGovern objected to Alabama's electoral votes, which Donald Trump had won with 62.08% of the vote. Because no senator joined his objection, the objection was dismissed.”
I ask again, why not tag him w/ the “election denier” label. They gave it two sentences & moved on. Why not?
https://en.wikipedia.org/wiki/Sheila_Jackson_Lee Sheila Jackson Lee is a prominent election denier, but she is not mentioned in Wiki’s “essay” on election denialism. Why not?
The profile of her on their site does mention in passing that she objected to 3 Presidential elections & even mentions 30 of her comrades throwing a hissy fit in 2005 over the count in Ohio.
It’s funny that they mention the counting of votes in 2000 was “contentious”, but do not say the same thing about vote counting in 2020 in certain states. I wonder why?
https://en.wikipedia.org/wiki/Barbara_Lee More of the same. They say the following about Barbara Lee but fail to call her an election denier: “After the 2016 presidential election, Lee objected to Michigan's and West Virginia's electoral votes. Because no senator joined her objections, they were dismissed.”
https://en.wikipedia.org/wiki/Al_Gore https://en.wikipedia.org/wiki/Joe_Lieberman Uncle Albert Gore Jr., the Senator’s Son & his running mate Mr. Milquetoast Joe Liebermann were vocal on more than one occasion that the 2000 election was stolen from them, but they do NOT appear in Wiki’s article on election denialism & they are not dubbed as “election deniers” in their profile pages on Wiki either.
They don’t call Gore an election denier, despite refusing to concede his loss until 12/13/00. After that, Gore has asserted several times over the years that the election was stolen from him. Is he fomenting domestic terrorism for refusing to admit that he lost?
https://en.wikipedia.org/wiki/Barbara_Boxer Barbara Boxer is NOT mentioned in Wiki’s essay on election denialism, nor do they call her that on her profile page, yet: “On January 6, 2005, Boxer joined Representative Stephanie Tubbs Jones (D-Ohio) in filing a U.S. Congressional objection to the certification of Ohio's Electoral College votes in the 2004 U.S. presidential election. She called the objection her "opening shot to be able to focus the light of truth on these terrible problems in the electoral system". The Senate voted the objection down 74–1; the House voted the objection down 267–31. It was only the second Congressional objection to an entire State's electoral delegation in U.S. history; the first instance was in 1877.”
https://en.wikipedia.org/wiki/Blake_Masters Blake Masters, who ran for Senate in Arizona is not called an election denier, but it is implied, “Masters has echoed Donald Trump's claims that the 2020 presidential election was "stolen". In June 2021, Masters said that "it's really hard to know" the winner of the 2020 presidential election, and supported an audit of the vote in Maricopa County. In a November 2021 campaign ad, Masters stated he thought "Trump won in 2020.”
https://en.wikipedia.org/wiki/Ted_Cruz This is said about Ted Cruz: “After the January 2021 Capitol attack, Cruz received widespread political and popular backlash for objecting to the certification of Joe Biden's victory in the 2020 presidential election and giving credence to the false claim that the election was fraudulent. Cruz backed a failed appeal to the U.S. Supreme Court attempting to overturn or nullify the 2020 presidential election in Pennsylvania filed by U.S. Representative Mike Kelly, which argued that the Pennsylvania Constitution requires in-person voting except in narrow and defined circumstances; the Supreme Court of Pennsylvania had already rejected this argument. The U.S. Supreme Court declined to take up the case or issue an injunction and Pennsylvania's Electoral College votes were cast for Joe Biden. Cruz later led an effort by a group of Republican senators to refuse to count Pennsylvania's Electoral College votes, citing baseless allegations of fraud.”
Were Boxer’s claims baseless? What about Jim McGovern’s claims or Al Gore’s claims or Sheila Jackson Lee? What about Maxine Waters? Did her claims receive popular backlash? Were her claims false?
You can see how Wikipedia, America’s fact-free, heavily-edited “encyclopedia” treats Democrat election deniers with kid gloves, but when it comes to Ted Cruz, Kari Lake or Donald Trump, it’s different.
https://en.wikipedia.org/wiki/Joe_Biden Even Joe Biden has engaged in election denial, insinuating that Al Gore really won the 2000 POTUS sweepstakes, but they don’t mention it in the senile Senator’s profile. Why not?
https://en.wikipedia.org/wiki/January_6_United_States_Capitol_attack Lastly, Wikipedia’s essay on the so-called #INSURRECTION fails to mention all the protestors that got arrested at Donald Trump’s Inauguration, https://rumble.com/vj8jbz-latifah-faisal-story-county-iowa-supervisor-whines-about-the-jan.-6-insurre.html https://rumble.com/vhmkzl-latifah-faisal-vs.-utubekookdetector-stopthesteal-and-capitol-insurrection.html as well as all the violent demonstrations that broke out shortly after Hillary Clinton was defeated. I guess that was an Insurrection too, eh? But it’s not mentioned, why not?
Why did Wikipedia not mention all the false claims made by Democrats in November 2016 that emboldened their unemployed base to engage in domestic terrorism? For four years we listened to Hillary Clinton, Nancy Pelosi, Jimmy Carter, Hakeem Jeffries, fat Kamala Harris, John Lewis, Maxine Waters, Dianne Feinstein, Marcia Fudge, Jamie Raskin, Sheila Jackson Lee, Ted Lieu, the overweight Jerry Nadler & a whole host of others. We listened to that bile for four years. https://rumble.com/v35f4z4-donald-trump-vs-election-deniers-hillary-clinton-obama-nancy-pelosi-kamala-.html
Wikipedia forgot to mention that.
My other videos on Democrat #electiondenial #electiondenier https://rumble.com/v2nux2c-election-deniers-cnn-and-divorcee-sam-seder-get-wrecked-by-donald-trump-vot.html https://rumble.com/v2sc8kw-election-denier-sam-seder-vs-scott-walker.html https://rumble.com/v2slknk-election-denier-jen-psaki-vs-chris-sununu.html https://rumble.com/v2lxv0y-election-denier-sam-seder-vs-rudy-giuliani.html https://rumble.com/v1ou9vw-kari-lake-decimates-the-democrat-media-on-the-big-lie.html https://rumble.com/vhmkzl-latifah-faisal-vs.-utubekookdetector-stopthesteal-and-capitol-insurrection.html https://rumble.com/v3goy0i-election-deniers-wonkette-vs-donald-john-trump.html [Are Democrats guilty of an Insurrection by writing the Electoral College, telling them to be “faithless electors”?] https://rumble.com/v3crzcc-election-denier-fani-willis-vs.-donald-john-trump.html https://rumble.com/vd1qg9-democrats-assault-democracy-dispute-2016-election.html #samseder #majorityreport
456
views

Creep Sam Seder is worried about guns, his voters are the problem Part I
The Creepy divorcee Sam Seder is worried about guns, but his voters are the problem. #samseder #majorityreport
***ALL screenshots related to this can be found at https://www.facebook.com/permalink.php?story_fbid=pfbid02Nr6ACnSP68DceYZ2Vsqp6vENhDnL1S1tnYAp2CpzLaCeRf13Lzq1PNo5nwVLuQ2Ml&id=100004109170994 Enjoy!***
The bi-polar divorcee & creepy old man Sam Seder is worried about guns & mainly worried about them from law-abiding citizens because genocide against your enemies cannot commence if your opponents are armed. Lenin knew that, Hitler knew that, the corrupt genocidal government of Cameroon understands that – all dictatorial regimes realize that if their opponents are armed, they cannot engage in wanton & gratuitous genocide.
The creepy divorcee Sam Seder won’t do anything aside from sitting on his fat ass (he spent more time worrying about Rush Limbaugh than he did his own father, kids & now ex-wife), he’s looking for others to do this & he needs to disarm (mainly) white, rural Americans to create a society that mimics the one in China. This is why he defends murderous regimes in China, he wants that type of society here.
I am not sure what he thinks he’s going to gain from it, he will likely still live in a small apartment, separate from his children & will never own any real property. He will continue to be a social media vegetable.
Perhaps he’s exhibiting Stockholm Syndrome symptoms, where he casts his lot w/ genocidal maniacs, hoping to obtain a few shekels.
He is mentally-ill, by his own admission, nothing really surprises me. He also had a fantasy involving his own kid & Roman Polanski https://rumble.com/vcj22f-face-bloat-stan-seder-i-mean-sam-seder-vs.-face-bloat-stan-seder.html & also became so obsessed w/ Donald Trump he barely noticed his wife – until she served him w/ divorce papers.
Let’s get to meat of this essay, we are going to look at violent crime (aside from murder) & the weapons used in the commission of these crimes. Democrats often trot-out statistics related to “mass shootings” that include injuries, not dead people – to inflate these stats.
I’ve often said, if State A had a high % of mass shootings, but their murder rate was 50% the national average & State B had a murder rate above the national average, but no mass shootings – which state is worse?
That said, let’s look at lots of damaged psyches in the wake of a violent crime (primarily aggravated assault, & robbery) & then look at the weapons used (personal weapons, knife, firearm, blunt object, etc.) in the commission of those crimes.
Remember, Democrats are concerned about guns, so let’s see how many people victimized & a gun was not the weapon of choice. If the Dems retort, “That is bad, but at least they’re still alive,” I will retort, “So are the folks who are merely injured in mass shootings.”
https://cde.ucr.cjis.gov/LATEST/webapp/#/pages/explorer/crime/query
How about Robbery & Aggravated Assault for a long time frame (FBI “Data Discovery Tool”)?
(National Data) Robbery & Aggravated Assault 2007 = 1,313,682 * 2008 = 1,287,246 * 2009 = 1,221,256 * 2010 = 1,150,933 * 2011 = 1,107,195 * 2012 = 1,117,060 * 2013 = 1,071,870 * 2014 = 1,053,994 * 2015 = 1,092,166 * 2016 = 1,135,779 * 2017 = 1,130,915 * 2018 = 1,092,260 * 2019 = 1,090,500 * 2020 = 1,165,105 * 2021=1,121,447 * 2022 = 1,114,430
***(As I was polishing this off, the FBI published 2022 data, I am including that just for kicks, even though most of the data below cuts off at 2021. Later I decided to include the 2022 data for each city, so you can compare it to 2020-21 & previous years)***
https://cde.ucr.cjis.gov/LATEST/webapp/#/pages/explorer/crime/crime-trend 2016-19 combined Aggravated Assault & Robbery rate = 341.515 per 100,000. * 2020-21 Aggravated Assault & Robbery rate = 344.629 per 100,000. 2022 Aggravated Assault & Robbery rate = 334.374 per 100,000
*** I should also mention, because of the adolescent logic of some like Creepy Sam Seder, #samseder #majorityreport just because a crime is declining (I have written about this in my essays many times, murder is very concentrated for example) nationally, does not mean that is the case everywhere. It could be declining markedly in areas not prone to violence (like say, rural Iowa, Idaho, Kansas) & spiking in Democrat-dominated cesspools like Chicago (which has bad data on this metric) or St. Louis. Aggravated Assault 2020-22 is up substantially, relative to 2016-19, Robbery is not. The creepy divorcee Sam Seder should also realize (and you will see this in the cities I am covering) that in a lot of minority-dominated, Democrat cities, violent crime did spike in 2020 & continued into 2022. In many of those jurisdictions, the 2022 rate was above the pre-COVID plandemic rate ***
(Aggravated Assault remained historically high in 2021, robbery is on a different trajectory https://www.statista.com/statistics/191231/reported-aggravated-assault-rate-in-the-us-since-1990/ https://www.statista.com/statistics/191235/reported-robbery-rate-in-the-us-since-1990/ If you want to compare other data sources)
That should give you a good idea of trends & now we’ll shift to NIBRS data & see the preferred weapons of these criminals when committing these heinous acts.
https://cde.ucr.cjis.gov/LATEST/webapp/#/pages/explorer/crime/crime-trend From 2007-21, there were 4,370,720 KNOWN weapons involved in “Aggravated Assault” & “Robbery.” Of those weapons, only 32.13% (1,404,638) of the weapons were a “firearm/handgun/shotgun/rifle” etc.
The perp did not need a firearm the vast majority of the time & defenseless people getting the tar beaten out of them by miscreants in this country has become much more common over the past few years.
For Robbery & Aggravated Assault 2012-2021 there were 3,171,135 KNOWN weapons & 33.82% (1,072,722) were a “Firearm/gun.”
For Robbery & Aggravated Assault 2016-19 there were 1,197,292 KNOWN weapons & 32% (383,216) of them were a “firearm/gun.”
For Robbery & Aggravated Assault 2020-21 there were 1,024,692 KNOWN weapons to commit those crimes & 38.19% (391,347) of the weapons were a “firearm/gun.”
As you can see, those crimes much more often than not, the assailant does not need to use a firearm to beat someone senseless & take their wallet or purse. In the 2020-21 period, which saw a major spike in aggravated assault – the % of those crimes where a firearm was used in the commission of it spiked, but still well short of even half.
I covered several periods from 2007-21 & the Black Lives Matter Crime-A-Thon in the midst of the Saint George Floyd protests, which was a dark period for this county.
How about the demographics of Robbery & Aggravated Assault? I already covered demographic data on murder victims & assailants from 2016-19 vs. 2020-21. The latter time frame saw a much higher murder rate & the % of victims & assailants that were black also spiked. Let’s do the same for Aggravated Assault & Robbery.
2012-21: Of the 3,558,253 Offenders (Robbery & Aggravated Assault) where the RACE of the offender was known, 51.47% (1,831,496) of those offenders were Black. #blacklivesmatter
2016-19: Of the 1,357,434 offenders (Robbery & Aggravated Assault) where the RACE of the offender was known, 50.67% (687,910) of those offenders were Black. #whitesupremacy
2020-21: Of the 1,073,654 offenders where the RACE of the offender is KNOWN, 51.22% (549,929) of those offenders were Black. That metric when compared to 2012-21 was static.
***
Now for some selected Dumocrat enclaves that are melting down. First, I will post their raw stats, courtesy of the FBI Data Discovery Tool (wish I had utilized that when covering murder stats, nobody is perfect) https://cde.ucr.cjis.gov/LATEST/webapp/#/pages/explorer/crime/query & then I will use NIBRS to give us the preferred weapon(s) when these crimes are commissioned by Democrat voters.
For population data see https://www.biggestuscities.com/city/portland-oregon OR https://www.census.gov/quickfacts/fact/table/
https://www.census.gov/data/datasets/time-series/demo/popest/2020s-counties-total.html https://www.census.gov/data/datasets/time-series/demo/popest/2010s-counties-total.html
Portland, OR: Aggravated Assault plus Robbery 2016-21: 2016 = 2813 * 2017 = 2893 * 2018=2986 * 2019 = 3222 * 2020 = 3444 * 2021 = 4492 (2020-21 cumulative avg. = 613.443 per 100,000) 2022 = 4285 (674.731 per 100,000)
Minneapolis, Minnesota: Aggravated Assault plus Robbery 2016-21: 2016 = 4132 * 2017=4058 * 2018=2932 * 2019= 3487 * 2020=4601 * 2021=5182 (2020-21 cumulative avg. = 1,150.356 per 100,000) 2022= 4761 (1,119.982 per 100,000)
St. Paul, MN: Aggravated Assault plus Robbery 2016-21: 2016=1767 * 2017=1757 * 2018=1649 * 2019 =1488 * 2020=2059 * 2021=2093 (2020-21 cumulative avg. = 671.697 per 100,000) 2022 = 1851 (610.536)
Milwaukee, WI: Aggravated Assault plus Robbery 2016-21: 2016 =8586 * 2017=8952 * 2018=7871 * 2019=7416 * 2020=8882 * 2021=8842 (2020-21 cumulative avg. = 1,545.848 per 100,000) Stay classy Milwaukee! 2022 = 7835 (1,390.898)
District of Columbia: 2016=7046 * 2017=6025 * 2018=6008 * 2019=6388 * 2020=6323 * 2021=2245 (2020-21 cumulative avg. = 629.933) 2022 = 4531 (674.453)
St. Louis City, MO: Aggravated Assault plus Robbery 2016-21: 2016=5540 * 2017=5967 * 2018=5029 * 2019=5333 * 2020=5520 * 2021=4442 (2020-21 cumulative robbery & aggravated assault avg. = 1,674.612 per 100,000) 2022 = 3861 (1,347.277)
Kansas City, MO: Aggravated Assault plus Robbery 2016-21: 2016=7370 * 2017=7870 * 2018=7335 * 2019=6726 * 2020=7394 * 2021=6824 (2020-21 cumulative robbery & aggravated assault avg. = 1,399.005) 2022 = 6993 (1,373.069)
Ferguson, MO: 2016=154 * 2017=134 * 2018=123 * 2019=89 * 2020=128 * 2021=160 (2020-21 cumulative robbery & aggravated assault avg. = 781.186) Ferguson is a dump that has been home to a high rate of violent crime, like forever. 2022 = 136 (749.6)
Hazelwood, MO: 2016=136 * 2017=78 * 2018=90 * 2019=106 * 2020=141 * 2021=154 (2020-21 cumulative robbery & aggravated assault avg. = 581.739) 2022 = 158 (630.814)
Springfield, MO: 2016=1950 * 2017=1892 * 2018=1869 * 2019=2204 * 2020=2439 * 2021=2440 (2020-21 avg. = 1,439.691) 2022 = 2,201 (1,294.195)
Independence, MO: 2016=543 * 2017=602 * 2018=441 * 2019=565 * 2020=640 * 2021=576 (2020-21 avg. = 496.14) 2022 = (425.735)
St. Joseph, MO: 2016=372 * 2017=394 * 2018=367 * 2019=305 * 2020=290 * 2021=324 (2020-21 avg. = 426.143) 2022 = 382 (540.647)
Charleston, MO: 2016=38 * 2017=36 * 2018=35 * 2019=40 * 2020=40 * 2021=54 (2020-21 avg. = 942.45) 2022= 28 (561.459)
Berkeley, MO: 2016=59 * 2017=91 * 2018=98 * 2019=86 * 2020=107 * 2021=165 * (2020=21 avg. = 1,662.286) 2022 = 219 (2,715.773)
Joplin, MO: 2016=275 * 2017=270 * 2018=230 * 2019=243 * 2020=282 * 2021=218 (2020-21 avg. = 482.574) 2022 = 200 (380.821)
Sedalia, MO: 2016=113 * 2017=141 * 2018=171 * 2019=171 * 2020=153 * 2021=97 (2020-21 avg. = 574.158) 2022 = (364.514)
Overland, MO: 2016=69 * 2017=36 * 2018=33 * 2019=43 * 2020=75 * 2021=67 (2020-21 avg. = 447.667) 2022 = (409.836)
Bridgeton, MO: 2016=98 * 2017=76 * 2018=61 * 2019=48 * 2020=65 * 2021=55 (2020-21 avg. = 525.624) 2022 = (599.753)
Bellefontaine Neighbors, MO: 2016=101 * 2017=82 * 2018=94 * 2019=115 * 2020=198 *
2021=161 (2020-21 avg. = 1,681.498) 2022 = 127 (1,215.659)
Rolla, MO: 2016=70 * 2017=94 *2018=91 * 2019=93 * 2020=100 * 2021=77 (2020-21 avg. = 441.804) 2022 = 99 (487.156)
Hannibal, MO: 2016=58 * 2017=58 * 2018=78 * 2019=70 * 2020=71 * 2021=63 (2020-21 avg. = 392.03) 2022 = (425.079)
Caruthersville, MO: 2016=79 * 2017=78 * 2018=65 * 2019=60 * 2020=54 * 2021=71 (2020-21 avg. = 1,140.51) 2022 = (623.229)
Poplar Bluff, MO: 2016=116 * 2017=85 * 2018=68 * 2019=91 * 2020=71 * 2021=158 (2020-21 avg. = 707.379) 2022 = 7 [?? Likely not accurate]
Detroit, MI: Aggravated Assault plus Robbery 2016-21: 2016=12827 * 2017=12764 * 2018=12226 * 2019=11796 * 2020=13478 * 2021=13364 (2020-21 cumulative robbery & aggravated assault avg. = 2,142.492) 2022 = 11,690 (1,884.341)
Are you kids seeing a massive spike in these cities 2020-21, relative to the previous 4 years due to the Saint George Floyd riots? “George Floyd had a fatal altercation w/ the police, we better rob the general public & assault them.” Yeah, makes sense.
George Floyd was a career criminal & drug addict who failed to cooperate w/ police because he was on drugs. Why wasn’t Memphis burned to the ground after Trye Nichols (I believe Nichols was murdered, I think Chauvin should’ve been charged w/ negligent manslaughter IMO) was murdered? That’s right, the cops that attacked him were all black.
Flint, MI: Aggravated Assault plus Robbery 2016-21: 2016=1405 * 2017=1735 * 2018=1577 * 2019=1225 * 2020=1037 * 2021=922 (2020-21 cumulative robbery & aggravated assault avg. = 1,210.036) Oddly, Flint bucked the trend, but nobody moves to Flint anymore, it’s dying a slow death. 2022 = 888 (1,112.029)
Pontiac, MI: Aggravated Assault plus Robbery 2016-21: 2016=667 * 2017=578 * 2018=720 * 2019=693 * 2020=775 * 2021=647 (2020-21 cumulative avg. = 1,160.011) 2022 = 573 (926.375)
Grand Rapids, MI: Aggravated Assault plus Robbery 2016-21: 2016=1175 * 2017 =1255 * 2018=1167 * 2019=1135 * 2020=1759 * 2021=1787 (2020-21 cumulative avg. = 894.756) 2022 = 1,720 (873.504)
Saginaw, MI: Aggravated Assault plus Robbery 2016-21: 2016=651 * 2017=699 * 2018=724 * 2019=664 * 2020=945 * 2021=1032 (2020-21 cumulative avg. = 2,244.907) 2022 = 859 (1,975.757)
Inkster, MI: Aggravated Assault plus Robbery 2016-21: 2016=285 * 2017=308 * 2018=212 * 2019=213 * 2020=277 * 2021=324 * (2020-21 cumulative avg. = 1,160.164 per 100,000) 2022 = 237 (928.428)
Romulus, MI: Aggravated Assault plus Robbery 2016-21: 2016=136 * 2017=200 * 2018=162 * 2019=195 * 2020=224 * 2021=185 (2020-21 cumulative avg. = 813.655) 2022 = 223 (889.083)
Highland Park, MI: Aggravated Assault plus Robbery 2016-21: 2016=173 * 2017=170 * 2018=171 * 2019=210 * 2020=188 * 2021=198 (2020-21 cumulative avg. = 2,158.595) #whitesupremacy is the reason this Black Majority community has been in decline for 60 years. By 2040, Highland Park will no longer exist. 2022 = 164 (1,894.42)
Harper Woods, MI: Aggravated Assault plus Robbery 2016-21: 2016=115 * 2017=88 * 2018=117 * 2019=105 * 2020=136 * 2021=129 (2020-21 cumulative avg. = 861.312) 2022 = 84 (553.833)
Melvindale, MI: Aggravated Assault plus Robbery 2016-21: 2016= 53 * 2017=60 *
2018=59 * 2019=42 * 2020=93 * 2021=106 (2020-21 cumulative avg. = 780.943) 2022 = 54 (427.485)
Ecorse, MI: Aggravated Assault plus Robbery 2016-21: 2016=135 * 2017=129 * 2018=90 * 2019=112 * 2020=155 * 2021=115 (2020-21 cumulative avg. = 1,456.624) 2022 = 95 (1,036.552)
Wyoming, MI: Aggravated Assault plus Robbery 2016-21: 2016=279 * 2017=280 * 2018=268 * 2019=309 * 2020=364 * 2021=346 (2020-21 cumulative avg. = 463.268) 2022 = 303 (394.911)
Taylor, MI: Aggravated Assault plus Robbery 2016-21: 2016=333 * 2017=305 * 2018=310 * 2019=343 * 2020=345 * 2021=287 (2020-21 cumulative avg. = 502.284) 2022 =342 (549.326)
Lansing, MI: Aggravated Assault plus Robbery 2016-21: 2016=1198 * 2017=1212 * 2018=1156 * 2019=1162 * 2020=1571 * 2021=1593 (2020-21 cumulative avg. = 1,404.094) 2022 = 1,326 (1,178.279)
Kalamazoo, MI: Aggravated Assault plus Robbery 2016-21: 2016= 793 * 2017=767 * 2018=884 * 2019=833 * 2020=1004 * 2021=1093 (2020-21 cumulative avg. = 1,425.487) 2022 = 988 (1,355.783)
Warren, MI: Aggravated Assault plus Robbery 2016-21: 2016=568 * 2017=550 * 2018=576 * 2019=546 * 2020=566 * 2021=607 (2020-21 cumulative avg. = 422.66) 2022 = 586 (427.403)
Ypsilanti, MI: Aggravated Assault plus Robbery 2016-21: 2016=130 * 2017=154 * 2018=150 * 2019=188 * 2020=240 * 2021=264 (2020-21 cumulative avg. = 1,236.294) 2022 = 180 (912.223)
Battle Creek, MI: Aggravated Assault plus Robbery 2016-21: 2016=508 * 2017=504 * 2018=510
2019=503 * 2020=516 * 2021=562 (2020-21 cumulative avg. = 1,026.236) 2022 = 613 (1,176.064)
Memphis, TN: Aggravated Assault plus Robbery 2016-21: 2016=11232 * 2017=12321 * 2018=12062 * 2019=117190 * 2020=14664 * 2021=15092 (2020-21 cumulative avg. = 2,362.213 per 100,000) 2022 = 14,463 (2,328.775)
Nashville, TN: Aggravated Assault plus Robbery 2016-21: 2016=6837 * 2017=7094 * 2018=7096 * 2019=6888 * 2020=7549 * 2021=7710 (2020-21 cumulative avg. = 1,115.175) 2022 = 7,023 (1,027.322)
Chattanooga, TN: Aggravated Assault plus Robbery 2016-21: 2016=1688 *
2017=1753 * 2018=1722 * 2019=1752 * 2020=2263 * 2021=2236 (2020-21 cumulative avg. = 1,238.813) 2022 = 1,887 (1,025.064)
Knoxville, TN: 2016=1497 * 2017=1491 * 2018=1368 * 2019=1085 * 2020=1365 * 2021=1410 (2020-21 avg. = 723.832) 2022 = 1,457 (743.788)
Clarksville, TN: 2016=849 * 2017=803 * 2018=864 * 2019=755 * 2020=891 * 2021=828 (2020-21 avg. = 509.037) 2022 = (433.396)
Murfreesboro, TN: 2016=729 * 2017=645 * 2018=533 * 2019=525 * 2020=635* 2021=490 (2020-21 avg. = 362.559) 2022 = 704 (433.502)
Jackson, TN: 2016=588 * 2017=620 * 2018=633 * 2019=603 * 2020=672 * 2021=597 (2020-21 avg. = 930.774) 2022 = 575 (840.889)
Millington, TN: 2016=70 * 2017=115 * 2018=93 * 2019=97 * 2020=79 * 2021=116 (2020-21 avg. = 924.871) 2022 = 76 (727.829)
Kingsport, TN: 2016=353 * 2017=362 * 2018=385 * 2019=315 * 2020=326 * 2021=389 (2020-21 avg. = 644.01) 2022 =395 (703.472)
Cleveland, TN: 2016=367 * 2017=363 * 2018=392 * 2019=422 * 2020=429 * 2021=345 (2020-21 avg. = 808.304) 2022 = 334 (687.851)
Columbia, TN: 2016=223 * 2017=253 * 2018=213 * 2019=244 * 2020=279 * 2021=270 (2020-21 avg. = 645.517) 2022 = 287 (626.747)
Lebanon, TN: 2016=183 * 2017=201 * 2018=157 * 2019=122 * 2020=198 * 2021=153 (2020-21 avg. = 442.338) 2022 = 172 (389.439)
Brownsville, TN: 2016=158 * 2017=109 * 2018=95 * 2019=136 * 2020=126 * 2021=99 (2020-21 avg. = 1,157.05) 2022 = 114 (1,194.718)
Union City, TN: 2016=85 * 2017=81 * 2018=62 * 2019=74 * 2020=71 * 2021=85 * (2020-21 avg. = 700.336) 2022 = 86 (782.885)
Dyersburg, TN: 2016=222 * 2017=170 * 2018=197 * 2019=170 * 2020=198 * 2021=197 (2020-21 avg. = 1,227.089) 2022 = 165 (1,034.028)
Springfield, TN: 2016=121 * 2017=145 * 2018=129 * 2019=107 * 2020=113 * 2021=81 (2020-21 avg. = 512.617) 2022 = 92 (478.643)
East Ridge, TN: 2016=182 * 2017=136 * 2018=89 * 2019=82 * 2020=112 * 2021=131 (2020-21 avg. = 550.733) 2022 = 120 (547.045)
Lewisburg, TN: 2016=108 * 2017=76 * 2018=74 * 2019=45 * 2020=61 * 2021=93 (2020-21 avg. = 621.494) 2022 = 58 (453.621)
Martin, TN: 2016=33 * 2017=31 * 2018=28 * 2019=17 * 2020=34 * 2021=38 * (2020-21 avg. = 337.394) 2022 = 47 (431.43)
Austin, TX: Aggravated Assault plus Robbery 2016-21: 2016=3117 * 2017=3173 * 2018=2901 * 2019=3443 * 2020=4184 * 2021=4372 (2020-21 cumulative avg. = 444.219) 2022 = 4,618 (473.909)
Dallas, TX: Aggravated Assault plus Robbery 2016-21: 2016=9133 * 2017=9371 * 2018=9445 * 2019=10882 * 2020=11355 * 2021=10320 (2020-21 cumulative avg. = 835.977) 2022 = 9,360 (720.252)
Houston, TX: Aggravated Assault plus Robbery 2016-21: 2016=22449 * 2017=23974 * 2018=22601 * 2019=23789 * 2020=27985 * 2021=26756 (2020-21 cumulative avg. = 1,189.208) 2022 = 24,414 (1,060.151)
San Antonio, TX: Aggravated Assault plus Robbery 2016-21: 2016=9415 *2017=9365 * 2018=8194 * 2019=9311 * 2020=10330 * 2021=9661 (2020-21 cumulative avg. = 692.636) 2022 = 11,150 (757.005)
Fort Worth, TX: Aggravated Assault plus Robbery 2016-21: 2016= 3919 * 2017=4256 * 2018=3944 * 2019=3537 * 2020=4603 * 2021=4632 (2020-21 cumulative avg. = 497.992) 2022 = 4,074 (425.834)
Corpus Christi, TX: 2016=2045 * 2017=2060 * 2018=2169 * 2019=2325 * 2020=2510 * 2021=2535 (2020-21 avg. = 793.693) 2022 = 2,231 (705.479)
Beaumont, TX: 2016=1216 * 2017=1157 * 2018=1156 * 2019=1125 * 2020=1332 * 2021=1122 (2020-21 avg. = 1,077.147) 2022 = 1,075 (959.059)
Port Arthur, TX: 2016=339 * 2017=357 * 2018=357 * 2019=305 * 2020=391 * 2021=369 (2020-21 avg. = 680.065) 2022 = 369 (663.919)
Jasper, TX: 2016=38 * 2017=37 * 2018=20 * 2019=27 * 2020=30 * 2021=28 (2020-21 avg. = 409.517) 2022 =35 (471.507)
Arlington, TX: 2016=1860 * 2017=1772 * 2018=1624 * 2019=1812 * 2020=1887 * 2021=1905 (2020-21 avg. = 481.803) 2022 = 1,920 (486.566)
Mesquite, TX: 2016=535 * 2017=536 * 2018=511 * 2019=632 * 2020=546 * 2021=661 (2020-21 avg. = 405.145) 2022 = 621 (419.881)
Lubbock, TX: 2016=2558 * 2017=2511 * 2018=2317 * 2019=2332 * 2020=2601 * 2021=2530 (2020-21 avg. = 990.253) 2022 = 2,483 (940.779)
Amarillo, TX: 2016=1247 * 2017=1322 * 2018=1412 * 2019=1278 * 2020=1522 * 2021=1349 (2020-21 avg. = 714.87) 2022 = 1,317 (654.276)
Pasadena, TX: 2016=583 * 2017=613 * 2018=563 * 2019=765 * 2020=778 * 2021=834 (2020-21 avg. = 536.398) 2022 = 788 (533.651)
Killeen, TX: 2016=851 * 2017=949 * 2018=453 * 2019=464 * 2020=915 * 2021=843 (2020-21 avg. = 568.189) 2022 =766 (481.24)
Waco, TX: 2016=565 * 2017=568 * 2018=622 * 2019=683 * 2020=811 * 2021=904 * (2020-21 avg. = 613.128) 2022 = 775 (538.254)
Midland, TX: 2016=385 * 2017=338 * 2018=338 * 2019=164 * 2020=458 * 2021=450 (2020-21 avg. = 344.136) 2022 = 556 (413.555)
Alamo, TX: 2016=158 * 2017=163 * 2018=112 * 2019=68 * 2020=89 * 2021=120 (2020-21 avg. = 528.832) 2022 = 95 (467.865)
Alton, TX: 2016=10 * 2017=16 * 2018=53 * 2019=144 * 2020=97 * 2021=81 (2020-21 avg. = 461.941) 2022 = 94 (477.812)
Donna, TX: 2016=144 * 2017=202 * 2018=193 * 2019=116 * 2020=157 * 2021=231 (2020-21 avg. = 1,154.418) 2022 = 180 (1,073.089)
Mercedes, TX: 2016=71 * 2017=84 * 2018=63 * 2019=60 * 2020=74 * 2021=57 (2020-21 avg. = 396.621) 2022 = 119 (711.85)
Palmview, TX: 2016=76 * 2017=48 * 2018=48 * 2019=56 * 2020=99 * 2021=71 (2020-21 avg. = 535.956) 2022 = (409.758)
Lancaster, TX: 2016=199 * 2017=217 * 2018=155 * 2019=139 * 2020=187 * 2021=202 * (2020-21 avg. = 474.349) 2022 = 238 (588.395)
Stafford, TX: 2016=81 * 2017=no data * 2018=73 * 2019=84 * 2020=47 * 2021=117 * (2020-21 avg. = 468.21) 2022=75 (430.366)
Waller, TX: 2016=8 * 2017=6 * 2018=1 * 2019=4 * 2020=15 * 2021=11 (2020-21 average = 469.06) 2022=5 (178.571) Some clowns might object to me covering cities that are small or like Waller, very small. However, if a MAGA-hat wearing person beat up a black person in Jerkwater, MT & was yelling the “N” word, while it was recorded – that small town would be a big deal, eh? MSLSD would be screeching about it for months.
San Benito, TX: 2016=42 * 2017=24 * 2018=32 * 2019=135 * 2020=188 * 2021=137 (2020-2021 avg. = 654.7) 2022 = 128 (518.953)
Paris, TX: 2016=165 * 2017=213 * 2018=213 * 2019=223 * 2020=208 * 2021=180 (2020-21 avg. = 793.748) 2022 = 160 (647.904)
Aransas Pass, TX: 2016=56 * 2017=52 * 2018=46 * 2019=47 * 2020=49 * 2021=45 (2020-21 avg. = 589.267) 2022 = 35 (398.678)
Addison, TX: 2016=88 * 2017=73 * 2018=59 * 2019=69 * 2020=63 * 2021=78 (2020-21 avg. = 413.501) 2022 = 67 (387.059)
Seattle, WA: Aggravated Assault plus Robbery 2016-21: 2016=4022 * 2017=4192 *
2018=4709 * 2019=4562 * 2020=4511 * 2021=5579 (2020-21 cumulative avg. = 685.957) 2022 = 5,750 (767.427)
Tacoma, WA: Aggravated Assault plus Robbery 2016-21: 2016=1827 * 2017=1551 *
2018=1662 * 2019=1677 * 2020=1709 * 2021=2455 (2020-21 cumulative avg. = 949.86) 2022 = 3,338 (1,505.122)
Wilmington, DE: Aggravated Assault plus Robbery 2016-21: 2016=1229 * 2017=1083 *
2018=1058 * 2019=1011 * 2020=1070 * 2021=974 (2020-21 cumulative avg. = 1,443.064) 2022 = 818 (1,142.952)
Cleveland, OH: Aggravated Assault plus Robbery 2016-21: 2016=5927 * 2017=4976 *
2018=5375 * 2019=5220 * 2020=5772 * 2021=5802 (2020-21 cumulative avg. = 1,562.738) 2022 =5,272 (1,457.936)
Columbus, Ohio: Aggravated Assault plus Robbery 2016-21: 2016=3677 * 2017= 3456 *
2018=3588 * 2019=3618 * 2020=4171 * 2021=4439 (2020-21 cumulative avg. = 475.069 per 100,000) 2022 = 2,950 (324.9) Columbus has seen a massive decline in those crimes, after a massive spike
Akron, OH: Aggravated Assault plus Robbery 2016-21: 2016=1037 * 2017=1130 * 2018=1450 * 2019=1598 * 2020=1536 * 2021=1426 (2020-21 cumulative avg. = 779.96) 2022 = 1,304 (691.744)
Toledo, OH: Aggravated Assault plus Robbery 2016-21: 2016=2966 * 2017=2463 * 2018=2222 * 2019=2369 * 2020=25343 * 2021=2690 (2020-21 cumulative avg. = 968.505) 2022 = 2,817 (1,057.825 per 100,000)
Dayton, OH: Aggravated Assault plus Robbery 2016-21: 2016=1277 * 2017=1093 * 2018=1086 * 2019=1105 * 2020=1382 * 2021=1277 (2020-21 cumulative avg. = 966.223) 2022 = 1,368 (1,006.296)
Cincinnati, OH: Aggravated Assault plus Robbery 2016-21: 2016=2489 * 2017=2477 *
2018=2195 * 2019=2228 * 2020=2437 * 2021=2208 (2020-21 cumulative avg. = 751.015) 2022 = 2,259 (729.856)
East Cleveland, OH: 2016=100 * 2017=123 * 2018=101 * 2019=93 * 2020=46 * 2021=97 (2020-21 cumulative avg. = 508.542) 2022 = 137 (981.704)
Denver, CO: 2016=3960 * 2017=4022 * 2018=4488 * 2019=4687 * 2020=5579 * 2021=6049 (2020-21 cumulative avg. = 814.855) 2022 =6,699 (939.219)
Oklahoma City, OK: Aggravated Assault plus Robbery 2016-21: 2016=4512 * 2017=4549 * 2018=5069 * 2019=4158 * 2020=4218 * 2021=3695 (2020-21 cumulative avg. = 578.093) 2022 = 3,877 (558.002)
Tulsa, OK: 2016=3933 * 2017=3721 * 2018=3812 * 2019=3568 * 2020=4105 * 2021=4055 (2020-21 cumulative avg. = 989.661) 2022 = 3,384 (821.624)
Muskogee, OK: 2016=384 * 2017=429 * 2018=344 * 2019=367 * 2020=421 * 2021=309 (2020-21 cumulative avg. = 991.08) 2022 = 369 (1,004.409)
Del City, OK: 2016=124 * 2017=142 * 2018=157 * 2019=165 * 2020=198 * 2021=154 (2020-21 cumulative avg. = 810.462) 2022 = 109 (509.631)
Warr Acres, OK: 2016 =52 * 2017=50 * 2018=37 * 2019=65 * 2020=35 * 2021=58 (2020-21 cumulative avg. = 445.061) 2022 = 33 (318.194)
Hugo, OK: 2016=10 * 2017=18 * 2018= [no data] * 2019=22 * 2020=28 * 2021=42 (2020-21 cumulative avg. = 679.15) 2022 = 24 (459.682)
Idabel, OK: 2016=19 * 2017=18 * 2018=22 * 2019=30 * 2020=55 * 2021=25 (2020-21 cumulative avg.= 572.696) 2022 = 11 (155.895) As you can see, some cities did see a return to normalcy in 2022.
Lawton, OK: 2016=708 * 2017=740 * 2018=743 * 2019=742 * 2020=634 * 2021=525 (2020-21 cumulative avg. = 638.314) Despite having a level of violence well beyond the national average, Lawton saw it decline 2020-21, it was much worse years ago. 2022 = 647 (706.779)
Okmulgee, OK: 2016=59 * 2017=62 * 2018=52 * 2019=61 * 2020=61 * 2021=36 (2020-21 cumulative avg. = 431.36) 2022 = 36 (315.734)
Buffalo, NY: 2016=2660 * 2017=2429 * 2018=2468 * 2019=2365 * 2020=2553 * 2021=2219 (2020-21 cumulative avg. = 859.652) 2022 = 1,853 (670.196)
Syracuse, NY: 2016=965 * 2017=891 * 2018=891 * 2019=1005 * 2020=1064 * 2021=no data 2022 = 1,197 (828.654)
Rochester, NY: 2016= 1641 * 2017=1704 * 2018=1455 * 2019=1405 * 2020=1546 * 2021=1447 (2021-21 avg. = 709.364 per 100,000) 2022 = 1,403 (670.163)
New York City, NY: 2016=46417 * 2017=43766 * 2018=43004 * 2019=44732 * 2020=45238 * 2021=no data (2020 average = 513.823) 2022 = 58,236 (698.617)
Albany, NY: 2016=791 * 2017=814 * 2018=759 * 2019=672 * 2020=792 * 2021=774 * (2020-21 avg. = 791.508) 2022 = 841 (834.11)
Utica, NY: 2016=338 * 2017=292 * 2018=330 * 2019=337 * 2020=276 * 2021=293 (2020-2021 avg. = 438.407) 2022 = 322 (502.489)
Troy, NY: 2016=334 * 2017=314 * 2018=260 * 2019=268 * 2020=305 * 2021=no data (2020 avg. = 593.223) 2022 = 314 (616.956)
Poughkeepsie, NY: 2016=208 * 2017=183 * 2018=186 * 2019=206 * 2020=216 * 2021=no data (2020 average = 683.955) 2022 = 177 (552.952)
Schenectady, NY: 2016=535 * 2017=517 * 2018=562 * 2019=469 * 2020=437 * 2021=373 (2020-21 average = 604.297) 2022 = 471 (684.503)
Binghampton, NY: 2016=308 * 2017=316 * 2018=283 * 2019=311 * 2020=346 * 2021=317 (2020-21 average = 694.03) 2022 = 297 (630.372)
Niagara Falls, NY: 2016=548 * 2017=505 * 2018=392 * 2019=397 * 2020=336 * 2021=331 * (2020-21 avg. = 687.395) 2022 = 373 (777.196)
Hempstead, NY: 2016 =389 * 2017=320 * 2018=309 * 2019=279 * 2020=346 * 2021=242 (2020-21 avg. = 498.71) 2022 = 297 (509.163)
Baton Rouge, LA: Aggravated Assault plus Robbery 2016-21: 2016=1973 * 2017=2148 * 2018=1914 * 2019=1944 * 2020=1930 * 2021=2539 (2020-21 cumulative avg. = 995.099) 2022= 2,062 (931.123)
New Orleans/Orleans Parish, LA: 2016=3538 * 2017=3725 * 2018=3783 * 2019=3621 * 2020=4302 * 2021=4875 (2020-21 average = 1,205.962) 2022 = 4,637 (1,254.093)
Lake Charles, LA: 2016=606 * 2017=584 * 2018=514 * 2019=350 * 2020=372 * 2021=402 (2020-21 cumulative avg. = 466.172) 2022 = 439 (554.902)
Alexandria, LA: 2016 =847 * 2017=664 * 2018=656 * 2019=707 * 2020=816 * 2021=764 (2020-21 cumulative avg. = 1,757.465) 2022 = 717 (1,629.397)
Bossier City, LA: 2016=547 * 2017=483 * 2018=526 * 2019=492 * 2020=548 * 2021=620
(2020-21 cumulative avg. = 928.153) 2022 = 584 (932.386)
Monroe, LA: 2016=1430 * 2017=1058 * 2018=645 * 2019=799 * 2020=1431 * 2021=1218 (2020-21 cumulative avg. = 2,788.89) 2022 = 1,248 (2,665.527)
Shreveport, LA: 2016=1666 * 2017=1646 * 2018=1416 * 2019=1294 * 2020=1519 * 2021=1458 (2020-21 average = 801.113) 2022 = 1,282 (711.617)
Houma, LA: 2016=146 * 2017=101 * 2018=136 * 2019=188 * 2020=115 * 2021=262 (2020-21 cumulative avg. = 567.583) 2022 = 255 (802.517)
West Monroe, LA: 2016=80 * 2017=77 * 2018=94 * 2019=105 * 2020=172 * 2021=215 (2020-21 cumulative avg. = 1,491.559) 2022 = 193 (1,527.502)
Thibodaux, LA: 2016=87 * 2017=60 * 2018=62 * 2019=78 * 2020=67 * 2021=67 (2020-21 avg. = 429.955) 2022 = 65 (418.194)
Lafayette City, LA: 2016=611 * 2017=678 * 2018=651 * 2019=634 * 2020=681 * 2021=577 (2020-21 avg. = 517.335) 2022 = (446.498)
Ruston, LA: 2016=109 * 2017=119 * 2018=75 * 2019=82 * 2020=120 * 2021=117 (2020-21 avg. = 533.303) 2022 = 159 (713.164)
Gretna, LA: 2016=38 * 2017=37 * 2018=81 * 2019=112 * 2020=57 * 2021=117 (2020-21 avg. = 491.483) 2022 = 96 (558.301)
Opelika, AL: Aggravated Assault plus Robbery 2016-21: 2016=196 * 2017=197 * 2018=150 * 2019=74 * 2020=99 *2021=197 (2020-21 cumulative avg. = 473.244) 2022 = 229 (698.447)
Birmingham, AL: 2016=3192 * 2017=2236 * 2018=3757 * 2019=no data * 2020=809 (I doubt the veracity of this number) * 2021=2979 * (2020-21 avg. = 951.23) 2022 = 3,076 (1,562.134)
Mobile, AL: 2016=1576 * 2017=1647 * 2018=1419 * 2019=no data * 2020=285 (this data is likely fallacious) * 2021=2346 (2020-21 avg. = 707.258 Even w/ that bogus figure, it is still high) 2022 = 2,053 (1,120.089)
Tuscaloosa, AL: 2016=412 * 2017=411 * 2018=462 * 2019=344 * 2020=331 * 2021=203 * (2020-21 avg. = 266.673) 2022 = 607 (548.814)
Bessemer, AL: 2016=731 * 2017=752 * 2018=459 * 2019=365 * 2020=428 * 2021=95 [??] (2020-21 avg. = 1,012.663) 2022 = 435 (1,721.817)
Dothan, AL: 2016=525 * 2017=540 * 2018=634 * 2019=355 * 2020=381 * 2021=122 (2020-21 avg. = 353.664) 2022 = 676 (948.971)
Tuskegee, AL: 2016=90 * 2017=73 * 2018=24 * 2019=66 * 2020=45 * 2021=63 (2020-21 avg. = 591.748) 2022 = 72 (812.732)
Livingston, AL: 2016=14 * 2017=39 * 2018=17 * 2019=21 * 2020=4 * 2021=5 * (2020-21 average = 136.591) 2022 = 16 (507.453) The average in this town from 2016-19 was stratospheric, then tailed off, but I am wondering if that’s accurate. 2022 was a return to normalcy.
Union Springs City (AL): 2016=28 * 2017=41 * 2018=46 * 2019=20 * 2020=13 * 2021=42 (2020-21 avg. = 824.34) 2022 = 48 (1,448.4) Census Bureau Quick Facts does NOT include cities under 5,000, so I used the 2021 figure.
Selma, AL: 2016=319 * 2017=253 * 2018=252 * 2019=57 * 2020=no data * 2021=93 (2021 avg. = 527.659) 2022 = 119 (699.054)
Linden City & Demopolis City (AL): 2016=44 * 2017=43 * 2018=54 * 2019=36 * 2020=37 * 2021=37 (2020-21 avg. = 411.522) 2022 = 54 (615.805)
Indianapolis, IN: 2016=11075 * 2017=10792 * 2018=10331 * 2019=8290 * 2020=8915 * 2021=8513 (2020-21 cumulative avg. = 984.799) 2022 = 8,336 (946.604)
South Bend, IN: 2016=953 * 2017=956 * 2018=989 * 2019=1288 * 2020=1660 * 2021=535 (2020-21 cumulative avg. = 1,061.468) “Rear Admiral” Pete Buttigieg presided over one of the most violent cities in America. If your city is a haven for violence & one party wins consistently, it tells me a lot about your voters. 2022 = 63 I doubt the veracity of that figure, not going to average it. It will be amended next year.
East Chicago, IN: Aggravated Assault plus Robbery 2016-21: 2016 =178 * 2017=174 * 2018=89
2019=186 * 2020=170 * 2021=264 (2020-21 cumulative avg. = 827.028) 2022 = 141 (542.975)
Muncie, IN: 2016=217 *2017=205 * 2018=178 * 2019=192 * 2020=593 * 2021=261 (2020-21 cumulative avg. = 654.24) 2022 = 269 (413.362) 2022 = 725 (626.355)
Evansville, IN: 2016=679 * 2017=730 * 2018=574 * 2019=620 * 2020=1100 * 2021=759 (2020-21 cumulative avg. = 795.314) 2022 = 725 (626.355)
Terre Haute, IN: 2016 =119 * 2017=73 * 2018=241 * 2019=587 * 2020=806 * 2021=288 (2020-21 cumulative avg. = 934.499) 2022 = 300 (514.271)
Louisville, KY: 2016= 4314 * 2017=4167 * 2018=3871 * 2019=4385 * 2020=6022 * 2021=6242 (2020-21 cumulative avg. = 972.846) 2022 = 3,923 (628.238)
Atlanta, GA: Aggravated Assault plus Robbery 2016-21: 2016=4874 * 2017=4143 * 2018=3481 * 2019=2797 * 2020=1252 * 2021=4308 (2020-21 cumulative avg. = 558.206) I have a sneaking suspicion, due to the Ferguson Effect, that 2020 total is artificially low, but even that low watermark year, Atlanta maintained a Robbery & Aggravated Assault rate much higher than the national average. E.G. The Atlanta average 2016-18 was ~836 per 100,000. 2022 = 3,842 (769.743)
Bibb County Sheriff’s Office (Macon), GA: 2016=688 * 2017=832 * 2018=952 * 2019=513 * 2020=1346 * 2021=1737 (2020-21 cumulative avg.= 982.266) 2022 = 2,134 (1,366.223)
South Fulton, GA: 2019=161 * 2020=991 * 2021=937 (2020-21 cumulative avg. = 891.775 per 100,000) 2022 = 1,093 (983.285)
Athens-Clarke County (GA) Police Dept: 2016=475 * 2017=456 * 2018=386 * 2019=472 * 2020=548 * 2021=629 (2020-21 cumulative avg. = 462.477) 2022 = 606 (471.371)
Marietta, GA: 2016=220 * 2017=197 * 2018=184 * 2019=247 * 2020=276 * 2021=255 (202-21 avg. = 433.692 per 100,000) 2022 = 239 (381.776)
Chamblee, GA: 2016=185 * 2017=123 * 2018=13 [??] * 2020=354 * 2021=261 (2020-21 cumulative avg. = 1,025.769) 2022 = 146 (488.801)
Albany, GA: 2016=829 * 2017=778 * 2018=766 * 2019=746 * 2020=1174 * 2021=1044 (2020-21 cumulative avg. = 1,601.051) 2022 = 198 I doubt that is accurate, will be adjusted next year most likely
Douglasville, GA: 2016=174 * 2017=230 * 2018=184 * 2019=166 * 2020=173 * 2021=196 (2020-21 cumulative avg. = 524.386 per 100,000) 2022 = 212 (558.659)
Charlotte, NC: Aggravated Assault plus Robbery 2016-21: 2016=6274 * 2017=5982 * 2018=6169 * 2019=6563 * 2020=7650 * 2021=7073 (2020-21 cumulative avg. = 838.221) 2022 = 6,753 (752.239)
Raleigh, NC: 2018=102 (likely inaccurate) * 2019=1256 * 2020=1714 * 2021=2049 (2020-21 cumulative avg. = 401.794) 2022 = 2,135 (447.976)
Greensboro, NC: 2016=1736 * 2017=2058 * 2018=1743 * 2019=2294 * 2020=2553 * 2021=2503 (2020-21 cumulative avg. = 848.221) 2022 = 2,328 (773.126)
Durham, NC: 2016=1867 * 2017=2109 * 2018=1848 * 2019=1890 * 2020=2289 * 2021=1994 (2020-21 cumulative avg. = 751.499) 2022 = 1,780 (609.739)
Winston-Salem, NC: 2016=1702 * 2017=1960 * 2018=2042 * 2019=2533 * 2020=2979 * 2021=2745 (2020-21 cumulative avg. = 1,145.558) 2022 = 2,837 (1,128.704)
Fayetteville, NC: 2016=1399 * 2017=1397 * 2018=1451 * 2019=1694 * 2020=1966 * 2021=1893 (2020-21 cumulative avg. = 924.634) 2022 = 1,919 (918.74)
Wilmington, NC: 2016=700 * 2017=730 * 2018=725 * 2019=681 * 2020=709 * 2021=556 (2020-21 cumulative avg. = 541.086) 2022 = 545 (452.943)
High Point, NC: 2016=678 * 2017=736 * 2018=633 * 2019=764 * 2020=740 * 2021=548 (2020-21 cumulative avg. = 564.966) 2022 = 587 (510.137)
Asheville, NC: 2016=479 * 2017=544 * 2018=540 * 2019=638 * 2020=696 * 2021=635 (2020-21 cumulative avg. = 706.201) 2022 = 806 (859.494)
Greenville, NC: 2016=448 * 2017=574 * 2018=436 * 2019=417 * 2020=376 * 2021=437 (2020-21 cumulative avg. = 459.774) 2022 = 474 (531.193)
Ahoskie, NC: 2016=38 * 2017=26 * 2018=34 * 2019=53 * 2020=39 * 2021=29 (2020-21 cumulative avg. = 693.382) 2022 = 25 (512.4)
Rocky Mount, NC: 2016=419 * 2017=365 * 2018=407 * 2019=388 * 2020=586 * 2021=477 (2020-21 cumulative avg. = 982.394) 2022 = 437 (809.064)
Roanoke Rapids, NC: 2016=97 * 2017=105 * 2018=78 * 2019=117 * 2020=135 * 2021=102 (2020-21 cumulative avg. = 780.632) 2022 = 97 (652.934)
Henderson, NC: 2016=151 * 2017=176 * 2018=258 * 2019=205 * 2020=287 * 2021=232 (2020-21 cumulative avg. = 1,726.719) 2022 = 245 (1,652.948)
Columbia, SC: Aggravated Assault plus Robbery 2016-21: 2016=1009 * 2017=909 * 2018=941 * 2019=922 * 2020=888 * 2021=855 (2020-21 cumulative avg. = 634.152) 2022 = 767 (549.041)
North Charleston, NC: 2016= 872 * 2017=920 * 2018=951 * 2019=985 * 2020=1233 * 2021=1122 (2020-21 cumulative avg. = 1,009.676) 2022 = 1,007 (849.015)
Rock Hill, SC: 2016=382 * 2017=409 * 2018=312 * 2019=445 * 2020=485 * 2021=427 (2020-21 cumulative avg. = 615.139) 2022 = 322 (427.344)
Greenville, SC: 2016=364 * 2017=383 * 2018=332 * 2019=354 * 2020=463 * 2021=459 (2020-21 cumulative avg. = 644.782) 2022 = 369 (510.302)
Sumter, SC: 2016=270 * 2017=315 * 2018=350 * 2019=399 * 2020=469 * 2021=334 (2020-21 cumulative avg. = 930.281) 2022 = 360 (841.967)
Florence, SC: 2016=389 * 2017=455 * 2018=336 * 2019=411 * 2020=542 * 2021=498 (2020-21 cumulative avg. = 1,302.001) 2022 = 480 (1,197.843)
Spartanburg, SC: 2016=391 * 2017=470 * 2018=410 * 2019=420 * 2020=509 * 2021=556 (2020-21 cumulative avg. = 1,384.339) 2022 = 416 (1,078.167)
Myrtle Beach, SC: 2016=485 * 2017=459 * 2018=404 * 2019=360 * 2020=431 * 2021=379 (2020-21 cumulative avg. = 1,106.406) 2022 = 312 (812.14)
Aiken, SC: 2016=229 * 2017=135 * 2018=111 * 2019=151 * 2020=237 * 2021=185 (2020-21 cumulative avg. = 662.48) 2022 = 169 (520.592)
Anderson, SC: 2016=266 * 2017=164 * 2018=141 * 2019=101 * 2020=184 * 2021=266 (2020-21 cumulative avg. = 769.836) 2022 = 168 (564.307)
Orangeburg City & Orangeburg County Sheriff’s Office, SC: 2016=330 * 2017=425 * 2018=603 * 2019=859 * 2020=1050 * 2021=1104 (2020-21 cumulative avg. = 1,289.642) 2022 = 1,060 (1,275.663)
Kingstree City & Williamsburg Co. Sheriff’s Office, SC: 2016=144 * 2017=139 * 2018=177 * 2019=138 * 2020=170 * 2021=131 (2020-21 cumulative avg. = 490.204) 2022 = 115 (382.593)
Mullins City, Marion City & Marion Co. Sheriff’s Office, SC: 2016=213 * 2017=171 * 2018=207 * 2019=155 * 2020=212 * 2021=152 (2020-21 cumulative avg. = 627.305) 2022 = 177 (622.144)
Bennettsville City & Marlboro Co. Sheriff’s Office, SC: 2016=200 * 2017=144 * 2018=127 * 2019=142 * 2020=168 * 2021=157 (2020-21 cumulative avg. = 613.983) 2022 = 198 (760.397)
Winnsboro City & Fairfield Co. Sheriff’s Office, SC: 2016=169 * 2017=183 * 2018=134 * 2019=158 * 2020=139 * 2021=117 (2020-21 cumulative avg. = 614.66) 2022 = 193 (943.534)
Lee Co. Sheriff’s Office & Bishopville City, SC: 2016=89 * 2017=74 * 2018=65 * 2019=146 * 2020=97 * 2021=98 (2020-21 cumulative avg. = 594.584) 2022 =97 (600.507)
Hampton City & Hampton Co. Sheriff’s Office, SC: 2016=66 * 2017=76 * 2018=52 * 2019=80 * 2020=85 * 2021=78 (2020-21 cumulative avg. = 442.97) 2022 = 87 (480.318)
Little Rock, AR: Aggravated Assault plus Robbery 2016-21: 2016=2844 * 2017=3033 *
2018=2628 * 2019=2777 * 2020=3413 * 2021=3776 (2020-21 cumulative avg. = 1,777.334 per 100,000) 2022 = 3,365 (1,658.746 per 100,000)
North Little Rock, AR: 2016=483 * 2017=499 * 2018=464 * 2019=513 * 2020=625 * 2021=725 (2020-21 cumulative avg. = 1,047.916) 2022 = 734 (1,135.748)
Jacksonville, AR: 2016=223 * 2017=236 * 2018=319 * 2019=246 * 2020=298 * 2021=321 (2020-21 cumulative avg. = 1,053.079) 2022 = 294 (1,009.268)
Sherwood, AR: 2016=140 * 2017=55 * 2018=164 * 2019=177 * 2020=185 * 2021=202 (2020-21 cumulative avg. = 587.886) 2022 = 236 (713.378)
Pine Bluff, AR: 2016=658 * 2017=741 * 2018=630 * 2019=598 * 2020=691 * 2021=754 (2020-21 cumulative avg. = 1,779.666) 2022 = 593 (1,501.455)
Helena-West Helena, AR: 2016=112 * 2017=138 * 2018=155 * 2019=166 * 2020=147 * 2021=218 (2020-21 cumulative avg. = 1,964.372) 2022 = 131 (1,476.555)
Marion, AR: 2016=89 * 2017=125 * 2018=112 * 2019=110 * 2020=147 * 2021=124 (2020-21 cumulative avg. = 986.028) 2022 = 86 (632.538)
West Memphis, AR: 2016=397 * 2017=406 * 2018=446 * 2019=439 * 2020=571 * 2021=609 (2020-21 cumulative avg. = 2,425.687) 2022 = 591 (2,483.715)
Fayetteville, AR: 2016=396 * 2017=424 * 2018=414 * 2019=338 * 2020=447 * 2021=492 (2020-21 cumulative avg. = 496.169) 2022 = 429 (432.089)
Fort Smith, AR: 2016=639 * 2017=707 * 2018=634 * 2019=762 * 2020=930 * 2021=893 (2020-21 cumulative avg. = 1,020.048) 2022 = 867 (963.418)
Jonesboro, AR: 2016=347 * 2017=334 * 2018=364 * 2019=449 * 2020=552 * 2021=510 (2020-21 cumulative avg. = 671.68) 2022 = 424 (530.822)
Conway City, AR: 2016=287 * 2017=275 * 2018=306 * 2019=271 * 2020=310 * 2021=294 (2020-21 cumulative avg. = 468.565) 2022 = 331 (489.521)
Texarkana, AR: 2016=157 * 2017=227 * 2018=178 * 2019=166 * 2020=249 * 2021=260 (2020-21 cumulative avg. = 868.556) 2022 = 272 (928.137)
Hot Springs, AR: 2016=248 * 2017=194 * 2018=159 * 2019=188 * 2020=240 * 2021=153 (2020-21 cumulative avg. = 515.964) 2022 = 159 (417.224)
Hope, AR: 2016=110 * 2017=105 * 2018=67 * 2019=58 * 2020=115 * 2021=107 (2020-21 cumulative avg. = 1,266.689) 2022 = 82 (950.834)
Forrest City City & St. Francis County Sheriff’s Office, AR: 2016=173 * 2017=18 (Forrest City reported no data) * 2018=144 * 2019=152 * 2020=232 * 2021=276 (2020-21 cumulative avg. = 1,109.412) 2022 = 323 (1,438.688)
Magnolia, AR: 2016=48 * 2017=52 * 2018=18 * 2019=12 * 2020=44 * 2021=64 (2020-21 cumulative avg. = 485.262) 2022 = 52 (473.098)
Camden, AR: 2016=104 * 2017=153 * 2018=112 * 2019=105 * 2020=108 * 2021=133 (2020-21 cumulative avg. = 1,153.882) 2022 = no data
Norfolk, VA: Aggravated Assault plus Robbery 2016-21: 2016=1440 * 2017=1199 * 2018=986 * 2019=1160 * 2020=1399 * 2021=1619 (2020-21 cumulative avg. = 638.486) 2022 = 1,479 (634.777)
Newport News, VA: 2016=747 * 2017=791 * 2018=848 * 2019=969 * 2020=1030 * 2021=1080 (2020-21 cumulative avg. = 569.496 per 100,000) 2022 = 1,032 (559.938)
Portsmouth, VA: 2016=686 * 2017=624 * 2018=688 * 2019=838 * 2020=808 * 2021=663 (2020-21 cumulative avg. = 751.065) 2022 = 763 (786.362)
Suffolk, VA: 2016=209 * 2017=248 * 2018=219 * 2019=234 * 2020=348 * 2021=440 (2020-21 cumulative avg. = 412.826) 2022 = 420 (426.235)
Petersburg, VA: 2016=222 * 2017=228 * 2018=94 * 2019=216 * 2020=186 * 2021=208 (2020-21 cumulative avg. = 589.061) 2022 = 235 (703.719)
Fredericksburg, VA: 2016=94 * 2017=97 * 2018=93 * 2019=93 * 2020=97 * 2021=138 (2020-21 cumulative avg. = 416.947) 2022 = 112 (389.47)
Hopewell, VA: 2016=97 * 2017=75 * 2018=85 * 2019=67 * 2020=72 * 2021=64 (2020-21 avg. = 294.55) 2022 = 107 (465.987)
Franklin, VA: 2016=18 * 2017=25 * 2018=18 * 2019=11 * 2020=19 * 2021=35 (2020-21 avg. = 329.348) 2022 = 37 (448.647)
Roanoke City, VA: 2016=364 * 2017=345 * 2018=370 * 2019=332 * 2020=396 * 2021=374 (2020-21 avg. = 387.168) 2022 = 462 (472.165)
Charlottesville, VA: 2016=209 * 2017=154 * 2018=137 * 2019=120 * 2020=165 * 2021=201 * (2020-21 avg. = 396.851) 2022 = 206 (454.014)
Las Vegas, NV: 2016=12162 * 2017=8570 * 2018=8219 * 2019=7331 * 2020=7976 * 2021=6832 (2020-21 cumulative avg. = 1,147.834)
North Las Vegas, NV: 2016=2154 * 2017=2323 * 2018=2203 * 2019=2186 * 2020=1230 * 2021=951 (2020-21 cumulative avg. = 405.127)
Reno, NV: 2016=1569 * 2017=1513 * 2018=1456 * 2019=1239 * 2020=1292 * 2021=1301 (2020-21 cumulative avg. = 486.521)
Waterloo, Iowa: Aggravated Assault plus Robbery 2016-21: 2016=448 * 2017=303 * 2018=302 * 2019=353 * 2020=389 * 2021=318 (2020-21 cumulative avg. = 526.347) 2022 = 347 (521.318 per 100,000)
Des Moines, IA: 2016=1344 * 2017=1355 * 2018=445 (?) * 2019=1447 * 2020=1365 * 2021=1230 (2020-21 cumulative avg. = 609.541) I am NOT including the 2022 FBI data, because I seriously doubt that is accurate & will be adjusted later. https://www.dsm.city/2022%20Statistics.pdf?pdf=2022%20Statistical%20Report&t=1698025208839 If I use the 2022 figure from that, we have a grand total of 2,193 & a rate of 1,039.169 per 100,000. This will likely end up being adjusted downward, but crime is not dissipating in Crazy Town. There is a lot of variance between the DSM figured & FBI figures. I understand the disparity grows as the seriousness of the crime goes down, but it seems to be too large a variance.
Davenport, IA: 2016=655 * 2017=648 * 2018=557 * 2019=523 * 2020=673 * 2021=564 * (2020-21 cumulative avg. = 610.583) 2022 = 604 (601.078)
Fort Dodge, IA: 2016=124 * 2017=127 * 2018=137 * 2019=107 * 2020=166 * 2021=94 (2020-21 cumulative avg. = 523.771) 2022 = 113 (458.287)
Council Bluffs, IA: 2016=119 * 2017=125 * 2018=121 * 2019=454 * 2020=538 * 2021=198 (2020-21 cumulative avg. = 588.611) 2022 = 218 (349.33)
Sioux City, IA: 2016= 324 * 2017=302 * 2018=297 * 2019=337 * 2020=407 * 2021=394 (2020-21 cumulative average = 467.679) 2022 = 361 (422.237)
Burlington, IA: 2016=190 * 2017=219 * 2018=137 * 2019=160 * 2020=100 * 2021=121 (2020-21 cumulative average = 463.856) 2022 = 125 (529.414)
Los Angeles, CA: Aggravated Assault plus Robbery 2016-21: 2016 =26181 * 2017=27771 * 2018=27340 * 2019=26868 * 2020=26548 * 2021 = no data (2020 average = 680.933 per 100,000) 2022 = 29,302 (766.618 per 100,000)
Stockton, CA: 2016=4204 * 2017=4170 * 2018=4157 * 2019=4165 * 2020=3778 * 2021=2949 2020-21 cumulative average = 1,046.409) 2022 = 3,516 (1,092.539)
San Francisco, CA: 2016=5791 * 2017=5878 * 2018=5744 * 2019=5569 * 2020=4550 * 2021=no data (2020 average = 520.619) 2022 = 4960 (613.529)
Oakland, CA: 2016=5697 * 2017=5052 * 2018=4962 * 2019=5070 * 2020=5189 * 2021=no data (2020 average = 1,177.551) 2022 = 6065 (1,408.653)
Compton, CA: 2016=1056 * 2017=1110 * 2018=1114 * 2019=1046 *2020=1058 * 2021=no data (2020 average = 1,105.399) 2022 = 992 (1,078.401)
Long Beach, CA: 2016=2616 * 2017=2876 * 2018=3035 * 2019=2086 * 2020=2065 * 2021=no data (2020 average = 442.397) 2022 = 2,221 (492.126)
Lancaster, CA: 2016=1023 * 2017=1124 * 2018=1092 * 2019=1238 * 2020=1098 * 2021=no data (2020 average = 632.812) 2022 = 1357 (802.080)
Palmdale, CA: 2016=644 * 2017=640 * 2018=544 * 2019=595 * 2020=683 * 2021=no data (2020 average = 403.152) 2022 = 848 (518.771)
Pomona, CA: 2016=686 * 2017=747 * 2018=784 * 2019=827 * 2020=672 * 2021=no data (2020 average = 443.725) 2022 = 765 (523.911)
Inglewood, CA: 2016=758 * 2017=726 * 2018=617 * 2019=618 * 2020=622 * 2021=no data (2020 average = 577.213) 2022 = 613 (591.578)
Bellflower, CA: 2016=357 * 2017=342 * 2018=306 * 2019=297 * 2020=318 * 2021=no data (2020 average = 401.565) 2022 = 410 (536.614)
San Jose, CA: 2016=3389 * 2017=3585 * 2018=3801 * 2019=3856 * 2020=3769 * 2021=no data (2020 average = 371.982) 2022 = 4,117 (423.894)
Berkeley, CA: 2016=546 * 2017=582 * 2018=520 * 2019=544 * 2020=484 * 2021=no data (2020 average = 389.305) 2022 = 574 (482.555)
Carson, CA: 2016=472 * 2017=447 * 2018=416 * 2019=408 * 2020=363 * 2021=no data (2020 average = 379.893) 2022 = 414 (448.11)
Hawthorne, CA: 2016=607 * 2017=557 * 2018=580 * 2019=599 * 2020=645 * 2021=no data (2020 average = 732.313) 2022 = 576 (681.148)
Antioch, CA: 2016=696 * 2017=546 * 2018=539 * 2019=581 * 2020=542 * 2021=46 [this is obviously not correct] (2020 average = 470.057) 2022 = 656 (569.128)
Gardena, CA: 2016=311 * 2017=373 * 2018=303 * 2019=301 * 2020=246 * 2021=350 (2020-21 average = 493.688) 2022 = 359 (610.098)
California City, CA: 2016=81 * 2017=84 * 2018=41 * 2019=70 * 2020=81 * 2021=no data (2020 average = 541.118) 2022 = 74 (489.191)
Fairfield, CA: 2016=413 * 2017=496 * 2018=505 * 2019=389 * 2020=477 * 2021=no data (2020 average = 397.924) 2022 = 518 (434.061)
Sacramento, CA: 2016=3420 * 2017=3240 * 2018=3191 * 2019=3062 * 2020=3380 * 2021=no data (2020 average = 643.902) 2022 = 4,509 (853.975)
Rancho Cordova, CA: 2016=227 * 2017=287 * 2018=243 * 2019=208 * 2020=303 * 2021=no data (2020 average = 381.939) 2022 = 355 (440.457)
San Bernadino City, CA: 2016=2693 * 2017=2613 * 2018=2704 * 2019=2672 * 2020=2831 * 2021=no data (2020 average = 1,274.834) 2022 = 2456 (1,114.701)
Barstow, CA: 2016=334 * 2017=283 * 2018=269 * 2019=259 * 2020=261 * 2021=no data * (2020 average = 1,027.195) 2022 = 261 (1,034.441)
Victorville, CA: 2016=695 * 2017=794 * 2018=737 * 2019=938 * 2020=1010 * 2021=no data * (2020 avg. = 749.247) 2022 = 1,205 (878.145)
Pittsburg, CA: 2016=229 * 2017=300 * 2018=366 * 2019=398 * 2020=404 * 2021=no data (2020 avg. = 528.733) 2022 = 413 (532.408)
Richmond, CA: 2016=926 * 2017=955 * 2018=997 * 2019=982 * 2020=1021 * 2021=1134 (2020-21 average = 928.595) 2022 = 964 (843.387)
San Pablo, CA: 2016=189 * 2017=169 * 2018=166 * 2019=185 * 2020=157 * 2021=no data (2020 avg. = 488.761) 2022 = 220 (700.882)
El Cajon, CA: 2016=348 * 2017=380 * 2018=479 * 2019=511 * 2020=474 * 2021=500 (2020-21 avg. = 460.269) 2022 = 462 (442.469)
Lemon Grove, CA: 2016=133 * 2017=166 * 2018=147 * 2019=161 * 2020=137 * 2021=173 (2020-21 average = 563.144) 2022 = 159 (584.043)
Riverside, CA: 2016=1573 * 2017=1491 * 2018=1522 * 2019=1530 * 2020=1319 * 2021=no data (2020 avg. = 418.711) 2022 = 1,497 (466.698)
Fresno, CA: 2016=3009 * 2017=2744 * 2018=2751 * 2019=2293 * 2020=3335 * 2021=4562 (2020-21 avg. = 726.654) 2022 = 4429 (811.815)
San Leandro, CA: 2016=453 * 2017=501 * 2018=450 * 2019=436 * 2020=433 * 2021=no data (2020 avg. = 475.834) 2022 = 482 (555.542)
Bakersfield, CA: 2016=1722 * 2017=1694 * 2018=1751 * 2019=1616 * 2020=1857 * 2021=no data (2020 avg. = 459.153) 2022 = 2,083 (507.248)
Anaheim, CA: 2016=1079 * 2017=1128 * 2018=1043 * 2019=971 * 2020=1092 * 2021=860 * (2020-21 avg. = 281.769) 2022 = 2504 (726.932) Now that is a spike in crime & oddly, it was much lower during the Saint George Floyd, “Let’s Burn Down The City for a Career Criminal” riots.
Modesto, CA: 2016=1988 * 2017=1944 * 2018=1783 * 2019=1651 * 2020=1481 * 2021=no data (2020 average = 677.905) 2022 = 1,548 (709.867)
Downey, CA: 2016=350 * 2017=356 * 2018=348 * 2019=318 * 2020=276 * 2021=no data (2020 avg. = 241.347) 2022 = 460 (418.432)
Ukiah, CA: 2016=135 * 2017=107 * 2018=79 * 2019=100 * 2020=119 * 2021=no data (2020 avg. = 715.789) 2022 = 85 (526.511)
El Segundo, CA: 2016=49 * 2017=35 * 2018=51 * 2019=77 * 2020=103 * 2021=98 (2020-21 avg. = 588.355) 2022 = (649.741)
Philadelphia, PA: Aggravated Assault plus Robbery 2016-21: 2016=13853 * 2017=13432 * 2018=12974 * 2019=12673 * 2020=12979 * 2021=11165 (2020-21 avg. = 759.233) 2022 = 14,903 (950.896) It’s getting much worse in the City of Brotherly Love
Pittsburgh, PA: 2016=2209 * 2017=1863 * 2018=1573 * 2019=1416 * 2020=1387 * 2021=no data (2020 avg. = 457.819) 2022 = 1,390 (458.9)
Harrisburg, PA: 2016=459 * 2017=501 * 2018=444 * 2019=394 * 2020=419 * 2021=no data (2020 avg. = 836.527) 2022 = 217 (432.417)
Erie, PA: 2016 =297 * 2017=268 * 2018=249 * 2019=413 * 2020=804 * 2021=94 [??] (2020 avg. = 847.663) 2022 = 513 (548.598)
York, PA: 2016=396 * 2017=448 * 2018=423 * 2019=421 * 2020=318 * 2021=no data (2020 avg. = 709.868) 2022 = 282 (628.832)
Norristown, PA: 2016=144 * 2017=177 * 2018=124 * 2019=162 * 2020=134 * 2021=no data (2020 avg. = 374.385) 2022 = 147 (410.671)
Springfield, IL: 2016=1196 * 2017=1115 * 2018=853 * 2019=772 * 2020=966 * 2021=855 (2020-21 avg. = 799.357) 2022 = 764 (674.476)
Hazel Crest, IL: 2016=55 * 2017=69 * 2018=43 * 2019=50 * 2020=37 * 2021=no data (2020 avg. = 276.408) 2022 = 82 (635.806)
Joliet, IL: 2016=427 * 2017=458 * 2018=434 * 2019=680 * 2020=504 * 2021=218 (2020-21 avg. = 240.069) 2022 = 687 (457.899)
Carbondale, IL: 2016=103 * 2017=98 * 2018=91 * 2019=160 * 2020=203 * 2021=no data (2020 avg. = 928.254) 2022 = 133 (612.423)
Rockford, IL: 2016=2288 * 2017=2194 * 2018=1877 * 2019=1581 * 2020=1973 * 2021=2055 (2020-21 avg. = 1,359.098) 2022 = 1,954 (1,331.851)
Champaign, IL: 2016=615 * 2017=546 * 2018=546 * 2019=752 * 2020=758 * 2021=617 * (2020-21 avg. = 775.053) 2022 = 517 (579.33)
Danville, IL: 2016=455 * 2017=500 * 2018=494 * 2019=479 * 2020=487 * 2021=466 (2020-21 avg. = 1,643.273) 2022 = 454 (1,594.549)
Chicago Heights, IL: 2016=141 * 2017=241 * 2018=226 * 2019=197 * 2020=171 * 2021=292 * (2020-21 avg. = 851.322) 2022 = 477 (1,802.38)
I think I have proven my point (279 cities). Just because a metric of crime(s) is dropping, doesn’t mean it is still not a problem & like murder, assaults & robberies are concentrated largely on one demographic & a large handful of cities.
Some cities have always had issues on this, so making a big deal out of it will possibly wake some folk up. These crimes are largely performed in Democrat-run cities & blacks are doing the lion’s share of them. You can call me racist, but you can’t call me wrong.
If the bipolar Leninist Sam Seder whines that “conservatives” are finally making a big deal out of it, I will point out that’s bad logic. Just because they started complaining about it a lot during the Saint George Floyd Crime-A-Thon doesn’t mean it was not a problem many years ago & we should have a discussion about it now.
***Almost all the jurisdictions above had combined Robbery/Aggravated Assault rates (per 100,000) at least 16% HIGHER than the national average from 2020-21 (or in 2022). I fudged my baseline a bit just to show the spike in aggravated assault & robbery in California. I also did that because so many CA cities (and PA) reported no data for 2021 to the FBI***
Now let us look at some statewide data, where the data is good & because IL & CA omit a lot of cities, they will NOT be covered. Compare the statewide average of the jurisdictions below versus the cities inside it I covered & you will see what I am talking about.
Iowa: Robbery/Aggravated Assault: 2016=7819 * 2017=7635 * 2018=7107 * 2019=7651 * 2020=8201 * 2021=7809 (2020-21 avg. = 250.623 per 100,000) 2022 = 7,756 (242.335)
Missouri: 2016=28625 * 2017=29114 * 2018=27162 * 2019=27085 * 2020=30001 * 2021=28252 * (2020-21 avg. = 472.65) 2022 = 26,502 (428.976)
North Carolina: 2016=34242 * 2017=35477 * 2018=33773 * 2019=35756 * 2020=40677 *
2021=40038 (2020-21 avg. = 384.26) 2022 = 39,215 (366.53)
South Carolina: 2016=22288 * 2017=22456 * 2018=22402 * 2019=23324 * 2020=25056 * 2021=23788 (2020-21 avg. = 473.675) 2022 = 23,344 (441.9)
Wisconsin: 2016=15479 * 2017=16269 * 2018=14857 * 2019=14758 * 2020=16533 * 2021=16159 * (2020-21 avg. = 277.666) 2022 = 14,915 (253.116)
Minnesota: 2016=10915 * 2017=10826 * 2018=9821 * 2019=10769 * 2020=13297 * 2021=14838 (2020-21 avg. = 246.409) 2022 = 13,535 (236.742)
Michigan: 2016=37902 * 2017=37204 * 2018=36720 * 2019=35861 * 2020=40822 * 2021=41747 * (2020-21 avg. = 410.488) 2022 = 39,058 (389.252)
Tennessee: 2016=39161 * 2017=40374 * 2018=39168 * 2019=37450 * 2020=42987 * 2021=43087 (2020-21 avg. = 620.168) 2022 = 40,526 (574.727)
Texas: 2016=106140 * 2017=108043 * 2018=101772 * 2019=105528 * 2020=115644 *
2021=115541 (2020-21 avg. = 393.812) 2022 = 112,674 (375.21)
Nevada: 2016=17967 * 2017=14501 * 2018=14184 * 2019=13035 * 2020=12414 * 2021=11429 (2020-21 avg. = 381.425) 2022 = 12,340 (388.322)
Arkansas: 2016=14132 * 2017=14607 * 2018=14341 * 2019=14890 * 2020=17816 * 2021=18476 (2020-21 avg. = 600.893) 2022 = 17,027 (559.062)
Virginia: 2016=15183 * 2017=14315 * 2018=13868 * 2019=14554 * 2020=15122 * 2021=16102 (2020-21 avg. = 180.603) 2022 = 17,063 (196.496)
Washington: 2016=18773 * 2017=18957 * 2018=19873 * 2019=19393 * 2020=19618 * 2021=22551 (2020-21 avg. = 273.009) 2022 = 25,805 (331.437)
Delaware: 2016=4490 * 2017=3975 * 2018=3699 * 2019=3752 * 2020=3928 * 2021=3792 (2020-21 avg. = 387.013) 2022 = 3,633 (356.737)
Ohio: 2016=29322 * 2017=28047 * 2018=27978 * 2019=28184 * 2020=30232 * 2021=30809 (2020-21 avg. = 259.046) 2022 = 28,100 (239.025)
Pennsylvania: 2016=35256 * 2017=35072 * 2018=33825 * 2019=34139 * 2020=44556 * 2021=31268 (2020-21 avg. = 291.465) 2022 = 31,459 (242.514)
Georgia: 2016=36205 * 2017=33791 * 2018=32174 * 2019=31056 * 2020=38487 * 2021=33295 (2020-21 avg. = 333.87) 2022 = 35,178 (322.353) The Next Part of this at least 3-part series will focus on many of the cities above & the % of the crimes I covered that are committed w/ a firearm & then onto murder stats for Part III, comparing 2020-21 to 2022.
258
views

Creepy Sam Seder & Mark D. Langdon find out, biology is real #science
Creepy old man Sam Seder #samseder #majorityreport #scienceisreal #biologyisreal & a dunce from Florida named Mark D. Langdon (although, the latter is afraid to answer me on this query) are having difficulty w/ Middle School Science.
Here’s a helping hand.
I will ask Mark D. Langdon again; would you vote to allow Dylan Mulvaney access to dress in the same locker room as your niece?
https://rumble.com/vcj22f-face-bloat-stan-seder-i-mean-sam-seder-vs.-face-bloat-stan-seder.html
My previous refutations of Mark D. Langdon https://rumble.com/v3d43ic-mark-d.-langdon-facebook-idiots-on-parade.html https://rumble.com/v36edqs-creep-sam-seder-and-mark-d.-lang-flunked-biology-anatomy-and-physiology.html https://rumble.com/v2vn5na-utubekookdetector-vs-mark-lang-black-on-black-murder.html https://rumble.com/v2lnxy8-sam-seder-supporter-mdl61-gets-pwned-again.html https://rumble.com/v2bv0gy-sam-seder-supporter-mdl61-gets-pwned.html
135
views
Will Creepy Sam Seder flap his gums on the Maine Mass Shooting?
*****All screenshots related to this video can be found at https://www.facebook.com/permalink.php?story_fbid=pfbid0HLKGzMxd9SZHNYjNmbVdSJ7BoQSsd7UWYAXLLHWJEGcpS2eZ7WyA74irCmES6nrNl&id=100064869933577 & https://www.facebook.com/permalink.php?story_fbid=pfbid02dgSS7Aj5g3Wi4sX8uDXTUyvapsrn2EPVjLbYs7nhhDTCBu4hCq8tHp9SdvzeN9n9l&id=100004109170994 *****
Will the creepy Leninist & old man Sam Seder #samseder #majorityreport comment on the Maine mass shooting & use it as a proxy to disarm law-abiding rural Americans?
https://cde.ucr.cjis.gov/LATEST/webapp/#/pages/explorer/crime/query
https://www.census.gov/data/datasets/time-series/demo/popest/2020s-counties-total.html https://www.census.gov/data/datasets/time-series/demo/popest/2010s-counties-total.html
The divorcee Sam Seder will likely shriek like a mentally-ill child who was prohibited from getting a pony by an aloof father, but let us put this in a bit of context, something Sam is incapable of doing because he’s intellectually-lazy.
From 2011-2022, Maine had a combined population of 15,116,914 & 280 murders, which gives us a murder rate of 1.852 per 100,000.
From 2011-2022, these United States had a combined population of 3,879,940,255 & 206,895 incidences of murder, which equals a murder rate of 5.332 per 100,000. Maine’s murder rate is almost 300% lower than the national average during that time frame, so the uber-white state of Maine – which has been http://www.gun-nuttery.com/rtc.php shall-issue for Concealed Carry before it was cool & has been “Constitutional Carry” since 2015 – the uber-white state of Maine is not the problem.
So, this year will certainly be an outlier for The Pine Tree State. I doubt the divorcee & his underemployed listeners even understand what an outlier is, they’ll just shriek about guns.
In Iowa, we do not have universal background checks either & our murder rate according to the FBI from 2011-2022 was (combined population = 37,631,020 & 815 murders) 2.165 per 100,000.
There is a severe disagreement between the State of Iowa & FBI data on a few years, especially in 2020. The State of Iowa https://icrime.dps.state.ia.us/CrimeInIowa/Report/CrimeTrends https://icrime.dps.state.ia.us/CrimeInIowa/Report/AnnualTrendReport data indicates from 2016-2022 the Hawkeye State saw (59, 67, 47, 54, 74, 71, 55) 427 incidents of Murder/Non-Negligent Manslaughter. Using the Iowa Data for 2016-22, Iowa had a murder rate of (694 murders from 2011-2022) 1.844 per 100,000 from 2011-2022.
So, Iowa is not the problem either, but Leninists who seek to turn these United States into a dictatorship & prohibit regular citizens from defending themselves will always use people like Robert Card as a proxy. Dictators cannot start doing what dictators do (like Mao, Lenin, Stalin, PolPot, the corrupt regime in Cameroon) until they disarm everyone.
If the divorcee Sam Seder wants to whine about dead people, I have some cities he can whine about that have had major issues w/ murder for many decades.
The following cities (2011-2022): Detroit, (population 7,364,259 & 3,678 murders = 49.943 per 100,000), Philadelphia (population 18,871,973 & 4,118 murders = 21.82 per 100,000), Baltimore (9,969,780 population & 3,303 murders = 33.13 per 100,000), Wilmington (DE) (854,122 population & 312 murders = 36.528 per 100,000), Memphis (7,759,950 population & 2,290 murders = 29.51 per 100,000), St. Louis City (3,697,220 population & 2,129 murders = 57.583 per 100,000), Cleveland (4,589,694 population & 1,253 murders = 27.3 per 100,000), New Orleans/Orleans Parish (4,578,135 population & 2,147 murders = 46.896 per 100,000), Petersburg (VA) (388,597 population & 179 murders = 46.063 per 100,000) & lastly, Richmond City, Virginia (2,660,743 population & 649 murders = 24.391 per 100,000).
Those cities collectively had a murder rate of (combined 2011-2022 population 60,734,473 & 20,058 murders) 33.025 per 100,000 – effectively 620% HIGHER than the national average. Those jurisdictions had only 1.56% of the entire U.S. population for the time frame I covered yet had 9.69% of all its murders.
All those cities are dominated by Democrats, even though some are in lean GOP states, some in purple states & some in states where Democrats dominate. Those cities are also much more diverse than the U.S. average, but their murder offenders & victims are not diverse, if you know what I mean.
I did not include Chicago in that list because I did not want it to be a mile long & Chicago’s average is much lower than all those cities, believe it or not. If you want a large list, see the following https://web.archive.org/web/20230724234657/https://professor_enigma.webs.com/sam-seder-ilhan-omar-racism https://web.archive.org/web/20220608034416/https://professor_enigma.webs.com/sam-seder-ilhan-omar-racism2 https://web.archive.org/web/20220608034411/https://professor_enigma.webs.com/sam-seder-ilhan-omar-racism3
Criminals do not follow gun laws, people drive sans insurance all the time, the law doesn’t matter to them. In Iowa, as well as Maine, if you have an aggravated assault offense, you are not allowed to legally own a firearm or carry one.
The gang-bangers have never cared about that & neither do mentally-ill, disturbed folks like Robert Card.
https://cde.ucr.cjis.gov/LATEST/webapp/#/pages/explorer/crime/crime-trend On the national level, from 2013-2022, of the 69,051 KNOWN Murder weapons, 77.05% (53,205) were a “firearm/gun.” Of the 69,051 KNOWN murder weapons, 4.73% (3,273) were a “rifle” or “shotgun.” That’s even lower than previous data I covered.
https://web.archive.org/web/20231001192843/https://professor_enigma.webs.com/black-lives-do-not-matter “From 2004-2018, 68.882% of all homicides were committed where a firearm did the dirty deed. About a third of the time, the assailant uses a knife, crowbar, some other object or personal weapons to commit the crime. They did not need a gun. In the same time frame, 5.154% of all homicides were committed w/a rifle or shotgun.”
Maine has not been NIBRS friendly as long as places like Iowa, but from 2018-2022, of the 75 KNOWN murder weapons, 52% (39) were a “firearm/gun” & a whopping 4% (3) were a “rifle or shotgun.”
In Iowa, from 2013-2022, of the 625 KNOWN murder weapons, 61.6% (385) were a “firearm/gun” & a paltry 5.76% (36) were a “shotgun or rifle.” Since Democrats are so concerned about so-called “assault weapons”, I included that data.
Those are two jurisdictions that have murder rates way below the national average, guns aplenty & the % of murders committed w/ a firearm are much lower than the national average. Rifle & shotgun murders are also rare, as they are on a national level.
People like the creepy old man Sam Seder are going to use this mass shooting as a reason to disarm everyone, but I need my firearms in the unlikely event that a few hood rats on the lam from Waterloo, Iowa try to carjack me. It’s unlikely that will occur, but I need to be able to defend myself.
In the unlikely event my wife is home alone when some hood rats out on the lam from Waterloo try to kick in the door at 2 AM, she will need a firearm to repel them & repel them she will.
We don’t intend on calling the cops & hoping they arrive in 60 seconds because it won’t happen. They’re usually 5 minutes away.
If you are a subscriber to the Epoch Times (and you should be) there are several articles focusing on Robert Card https://www.theepochtimes.com/us/recycling-center-in-maine-where-body-of-mass-shooting-suspect-body-found-had-been-searched-before-5518751 https://www.theepochtimes.com/us/what-we-know-so-far-about-the-mass-shooting-in-maine-5518753
A previous mass shooter in Maine was NOT legally allowed to possess firearms, but that did not prevent it https://www.newscentermaine.com/article/news/crime/maine-shooting-bowdoin-suspect-guns-joseph-eaton-yarmouth-maine-shooting/97-5ba19156-2cc8-45b5-8805-15dddbf97575
I have an exit question for the divorcee Sam Seder – should someone who is diagnosed as bi-polar & thus, subject to crazy shifts in their mood; should they be barred from ever possessing a firearm or not? Just wondering old man.
One more thing bi-polar divorcee, if you are angry at Robert Card, just pretend he’s a member of Hamas, that should quell the crocodile tears you cry as you use him to *ATTEMPT* to strip me of my individual rights to possess arms.
Like Columbo, just one more thing creep. Was that bowling alley Mr. Card shot up a gun free zone or not?
***
If you want data on the % of murders that are committed w/ a firearm in numerous jurisdictions, see the following, which includes lots of years prior to even 2012 https://rumble.com/v3li00z-black-hawk-county-iowa-supervisor-chris-schwartz-debunked-again-waterloo.html https://rumble.com/v3lpnba-creepy-sam-seder-democrat-voters-and-universal-background-checks.html I also cover a bevy of jurisdictions run by Democrats & you will see in many of those, victims of murder are far more likely to be murdered outside & w/ a firearm than in much safer, less diverse, more sane places like Iowa, Montana, Idaho, etc.
****The Hub for all my data on violent crime, gun control, homicide, etc. https://rumble.com/v3mu0q4-brian-tyler-cohens-red-stateblue-state-homicide-pap-gets-nuked.html Any additions will be added at https://www.facebook.com/permalink.php?story_fbid=pfbid0nTTJ32hMh267uqx1LdTjoS3TmzcKZKmSngRJdqyUPZhfUmN1KkF4HAngC9xaxtpwl&id=100004109170994
199
views
MSNBC: The Walls Are Closing in... on Joe Biden
First clip is Greg Kelly 10/20/23 & 2nd clip is the Simon Conway Show 10/26/23. Over the next year, Kid Sniffer Joe Biden #samseder #majorityreport will be subjected to intolerable scrutiny & he may be a millstone around the necks of Congressional Democrats. Let's Hope So! 10% for The Big Guy!
BONUS: Sam Seder Supporter Mark D. Langdon gets squashed by moi https://rumble.com/v3d43ic-mark-d.-langdon-facebook-idiots-on-parade.html He challenged me & then retreated quickly
123
views
3
comments

Senator Rand Paul on foreign aid
Senator Rand Paul, in a recent appearance on the Clay Travis & Buck Sexton Show -- gave a really good answer on foreign aid. He was asked what should the U.S. government do for Israel in light of their never-ending war against Hamas. We need more folks like Rand Paul in the GOP. More Rand Paul, less Lindsay Graham & Mitch McConnell.
#endallforeignaid #ronpaulwasright
Creepy Sam Seder #samseder #majorityreport is afraid to debate James Patrick Holding on The Impossible Faith https://tektonics.org/lp/nowayjose.php
86
views

Brian Tyler Cohen's Red State/Blue State Homicide Pap Gets NUKED!!
****ANY & ALL UPDATES ON THIS WILL BE ADDED @ https://www.facebook.com/permalink.php?story_fbid=pfbid0nTTJ32hMh267uqx1LdTjoS3TmzcKZKmSngRJdqyUPZhfUmN1KkF4HAngC9xaxtpwl&id=100004109170994 https://www.facebook.com/permalink.php?story_fbid=pfbid026vNKpPdMHW9ftUpYPHKxko2aYLrEvTZVZrEGtybjW5stz7QSu356xUU8Lvb2j2n2l&id=100064869933577 ****
The following essays will consist of all my data pertain the Democrat Crime Wave. America does NOT have a “Red State Murder Problem” as vanilla midgets like Brian Tyler Cohen say (in the coming months, I will be quizzing his supporters on this & recording the results) or rather what vanilla midgets like Brian Tyler Cohen parrot from Google.
The most violent counties & cities in America have beaucoup black on black murder & typically vote Democrat. The real #INSURRECTION is a Democrat Insurrection. 1) Defund the police or thin their ranks to the point where they cannot do their job, cannot respond to stolen cars, robberies & other “minor” infractions 2) Let lunatics out of prison (child molesters, folks w/ numerous assault charges, murderers, etc.) so they can terrorize the general public 3) When folks like Kyle Rittenhouse push back on the fatherless terrorists & stop them from burning the town down, the Dems will try to put him away for murder 4) Take guns away from (primarily Rural) law-abiding gunowners (and universal background checks are the tactic used to compile lists of gunowners) so 5) the next time the fatherless terrorists from #blacklivesmatter riot, nobody will be there to oppose them
With that said & without further delay, here are all the essays I have done on this topic, from the newest to the oldest. The oldest essays (at my website, which has been discontinued – the owners decided to end the webs dot com venture & although it is still up at this point, it may disappear. Therefore, I will link to archived versions) are the foundation of everything above them.
*****************************************************
That’s all I have as of now (10/3/23) & when I add to it, you will be the first to know. It will be added to this page & should assist you (if you are uber-busy w/ kids & their activities or busy doing something else, I do it for you, so you do not have to) should you run into some moron copying talking points from Brian Tyler Cohen, who copies talking points from the guy who cleans the gas station bathroom, who copies talking points from Progressive Think Toilets.
America’s “Red State Murder Problem” is a “Blue County & Blue City Murder Problem.” It’s also – most of the time – a black on black murder problem.
***
https://rumble.com/v3lpnba-creepy-sam-seder-democrat-voters-and-universal-background-checks.html https://rumble.com/v3li00z-black-hawk-county-iowa-supervisor-chris-schwartz-debunked-again-waterloo.html Divorcee Sam Seder, Black Hawk County, Iowa Supervisor Chris Schwartz, low-IQ Hakeem Jeffries, Chuck Schumer, Elizabeth Warren, #AOC & a number of Leninist luminaries think Universal Background Checks will solve the problem of career criminals wreaking havoc. They don’t care about UBCs. I debunk their talking points w/a an Armada of data.
“Given the very low homicide rates that prevail throughout most of the US, it is clear that enormous swaths of the US population are able to obtain, own, and use firearms freely without turning their cities and towns into war zones.”
https://rumble.com/v3ix6fq-latifah-faisal-story-county-iowa-supervisor-and-murders-in-fort-dodge.html Story County, Iowa supervisor Latifah Faisal likes to comment on murders outside Iowa (because she thinks they’re politically-expedient), but has not commented on the alarming number of blacks murdered in Iowa & blacks committing murder in Iowa, usually against other blacks.
#saytheirnames #latifahfaisal #faisal4story Say Their Names! PS I found through a lot of internet sleuthing & some landline phone calls – since Latifah claims to be a lifelong resident of that County – there have been 3 altercations w/ police there, two of which resulted in the suspect meeting Jesus Christ of Nazareth & another where the suspect ended up in the hospital.
Why did she not comment on those? Not politically expedient? Maybe she didn’t want hordes of BLM lunatics descending on her turf & wrecking the place. But it’s fine if they burn Ferguson & the Twin Cities down, right dummy? She never commented on that carload of kids that murdered another kid in Des Moines recently either. https://rumble.com/vywcwl-latifah-faisal-knows-george-floyds-name-but-does-she-know-jose-david-lopezs.html But if a cop had gunned down a Hispanic kid after he committed a felony, that would be big news, eh?
https://rumble.com/v3fug5c-msnbc-and-mara-gay-are-dumb-columbus-ohio-vs.-new-york-city-democratcrimewa.html The vacuous Mara Gay & MSNBC thought they had a zinger on Congressman Jim Jordan.
“Uh, derp – Columbus, Ohio has a higher murder rate than NYC.” Yeah, who does Franklin County typically vote for & what are the demographics pertaining to murder there? Don’t worry, I supply all the answers.
https://rumble.com/v33rzdf-creepy-sam-seder-and-his-whitesupremacy-narrative-collapsing.html An examination of some of the most violent counties in America (and some states, such as MO, PA, CA, MN, IL), their demographics, the demographics of murder offenders & arrestees, as well as who these counties typically vote for. #whitesupremacy
https://rumble.com/v3255lu-chris-schwartz-black-hawk-county-iowa-supervisor-debunked-again-we-arent-sa.html Debunking Black Hawk County, Iowa supervisor Chris Schwartz again for his idiocy, “We are not safe anywhere.” Speak for Waterloo, not the majority of Iowa, which is not seeing a murder rate well above the national average.
https://rumble.com/v2s3mpk-charlie-kirk-subdues-blacklivesmatter-and-whitesupremacy.html A discussion of murder offender and victim demographics 2016-19 vs. 2020-21. Charlie Kirk posts pictures of the devastation the fatherless BLM lunatics caused in various cities across America. Black Lives Matter back in September of 2020 removed an anti-nuclear family screed from their website. Why do they want black children to grow up in single-parent households? Is it because they’re more likely to become Democrat voters?
https://rumble.com/v2pv2ga-sam-seder-aoc-and-joy-reid-are-worried-about-young-black-men-getting-murder.html Jordan Neely (even though he is not a child, but acted like a spoiled one) sparked a lot of crocodile tears from race hustlers, so I cover the number of children murdered in places like St. Louis City, Baltimore, Chicago, Flint, Milwaukee, Birmingham (AL), New Orleans, Indianapolis, Philadelphia, Nashville, Durham City (NC), Charlotte, Kansas City (MO) & Atlanta. All those cities lean or fall towards the Party of Lenin.
A discussion of the number of juveniles murdered in 2020 vs. 2021. #saytheirnames The yearly number of black murder victims & offenders 2016-19 is much smaller than the 2020-21 time frame. Remember, the Democrats were supporting these riots https://rumble.com/vhmkzl-latifah-faisal-vs.-utubekookdetector-stopthesteal-and-capitol-insurrection.html in the wake of George Floyd.
https://rumble.com/v2o1yoo-aoc-and-creepy-sam-seder-suddenly-worried-about-dead-black-folks-in-nyc.html The vacuous bartender #AOC & the divorcee Sam Seder are suddenly wringing their Vienna Sausage fingers over dead black folks in New York City. You’re a bit late ladies.
Counties in NY state that were uber-Republican vs uber-Democrat & their murder rates. NYC violent crime demographics. Uh-oh. NYC is a super-duper Democrat stronghold in a super-duper Democrat state. Must be #whitesupremacy causing all that violence there?
“In fact, a police officer is more than 18.5 times more likely to be killed by a black male, than an unarmed black male is to be killed by a police officer. If the police ended all use of lethal force tomorrow, it would have a negligible effect on the black homicide rate.”
https://rumble.com/v2n82kc-creepy-sam-seder-and-the-democrat-california-crime-wave.html Documenting the Democrat Crime Wave #DemocratCrimeWave in California.
Despite Universal Background Checks in CA, the LAPD confiscated >17,000 guns in 2021-22. I guess the rats did not get that memo, did they? Half of the murders in Los Angeles are “gang related.”
Discussion of murder arrestee demographics in various CA jurisdictions & CA statewide. Also included data on murder victims.
https://rumble.com/v2kb74s-divorcee-sam-seder-and-joy-reid-find-out-about-dead-people-in-kansas-city.html Democrats are suddenly concerned about dead black folks in Kansas City, Missouri, but they are a few decades late for that. A discussion of murder offenders & victims in KC, as well as MO statewide. Murder rates in Kansas City & St. Louis City versus the rest of MO.
Murder rates in MO counties that were uber-Donald Trump vs. Kansas City & St. Louis City. MO counties that had zero murders 2021 & 2022. Discussion of murder rates in uber-Republican MO counties vs. the uber-Democrat counties.
How many children are murdered in KC each year? Do the Democrats care? They would if a LEO were involved.
https://rumble.com/v2jcakg-sam-seder-is-brick-dumb-larry-elder-played-my-blm-call.html Educating the divorcee Sam Seder on the massive surge in crime post-George Floyd & reminding the old man that the most violent counties in America are usually “diverse,” usually vote Democrat & have lots of black on black murder.
I cover data related to homicide victimization rates for “non-white” people all the way back to 1910. Spoiler alert, the non-white homicide victimization rate has been well above the rate for “Whites.” Why is that?
Larry Elder plays my call to his show debunking Black Lives Matter.
https://rumble.com/v2ivlfk-if-divorcee-sam-seder-were-a-city-he-would-be-boston.html Rachael Rollins & the REAL Democrat #INSURRECTION
https://rumble.com/v2fyxgo-if-divorcee-sam-seder-were-a-city-he-would-be-portland.html Super-duper “Blue City” Portland (in “Blue” Oregon) is seeing murder, violent crime & vehicle thefts spike. This is what happens when you force kids into a government school system that is not interested in teaching them how to show up for a job & learn – but instead teaches them that white people are the reason their father abandoned them. Oh, and you have the right to do whatever drugs you want & my boss has the right to pay for your food & shelter when you’re a slobbering mess who couldn’t do a job a trained chimpanzee can do.
https://rumble.com/v2b2ea0-two-brian-tyler-cohen-supporters-red-stateblue-state-homicide-get-squashed.html Two Brian Tyler Cohen supporters parrot “Red State Murder Problem” talking points off Google & get squashed.
https://rumble.com/v2ahqta-divorcee-sam-seder-vs.-utubekookdetector-black-on-black-crime.html https://web.archive.org/web/20230223004456/https://professor_enigma.webs.com/archive Covering NUMEROUS cities (in “red states,” in “blue states”, cities that are “diverse” or not so “diverse”) that have a lot of black on black murder, usually several times their % of the population. You can call me racist, but you can’t call me wrong!
https://rumble.com/v27s610-divorcee-sam-seder-wont-undertake-this-analysis-of-minnesota-election.html Who do the most violent counties in Lilly-white Minnesota vote for? I wonder, counties in MN that have no murders (and there are a lot of them) – who do they vote for & what are their demographics? https://web.archive.org/web/20230801020040/https://professor_enigma.webs.com/covid-increase-homicides
https://rumble.com/v26w33y-divorcee-sam-seder-and-the-democrat-insurrection-burlington-vt.html Burlington, Vermont demonized their police (VT is uber-safe, but Burlington is an outlier) & the results are predictable. I also debunk an intellectually lazy article written by some idiot named Katya Schwenk.
https://rumble.com/v268b7a-divorcee-sam-seder-vs.-utubekookdetector-iowa-homicide.html A detailed discussion of the most violent cities in Iowa, the demographics of murder offenders & who they vote for. The most violent cities in Iowa tend to be more “diverse” than Iowa en masse & they tend to vote Democrat. Whoops!
https://rumble.com/v1z2nk8-divorcee-sam-seder-wont-conduct-this-analysis-of-missouri-arkansas-election.html Will the divorcee Sam Seder do an analysis of the uber-Democrat counties in Missouri & Arkansas, chronicling their murder rates? I doubt that. Will he compare the murder rates in the counties that were (≥60%) dominated by Republicans? Nope.
I also discuss the demographics of murder arrestees & counties in those states that had zero murders. They tend to lean Republican.
https://rumble.com/v1usbmw-divorcee-sam-seder-wont-conduct-this-analysis-of-michigan-election.html https://rumble.com/v1u66vk-divorcee-sam-seder-wont-have-this-analysis-of-pennsylvania-senate-race.html An analysis of the uber-Democrat & uber-Republican (≥60%) counties in Michigan & Pennsylvania, as well as their murder rates. I challenged the divorcee Sam Seder to do an analysis on those counties & he was too busy trying to find his ex-wife’s sunglasses.
https://rumble.com/v1tlfrq-hillary-clinton-parrots-divorcee-sam-seders-parroted-talking-point.html Hillary Clinton autistically repeats, “Red States have higher murder rates than blue states.” Hillary, “blue counties have higher murder rates than red counties & the safest counties in America tend to be Red & White (not blue).”
https://rumble.com/v1tfb1c-chris-schwartz-black-hawk-county-iowa-supervisor-says-were-not-safe-anywher.html Black Hawk County, Iowa Supervisor projects the violence in his backyard (Waterloo, Iowa) on the entire nation, saying “we’re not safe anywhere.”
I debunk that totally & completely. Chris needs to read a book without coloring areas.
https://rumble.com/v1q2eez-joe-scarborough-joy-hofmeister-and-the-democrat-crime-wave.html https://rumble.com/v1r0kf6-divorcee-sam-seder-parrots-fallacious-arguments-oklahoma-california-homicid.html A discussion of murder in Oklahoma & the demographics of it, including arrestees for murder. Creepy Sam Seder #samseder #majorityreport dutifully parroted talking points from some dingbat pretending to run for Governor in OK & I ran it through a wood chipper (metaphorically speaking).
Some data from John Lott on counties w/ no murders 1977-2000 – concentration of murders in these United States. Even back in the 1980s, when the murder rate was much, much higher than 2020-2022, >70% of U.S. counties had no murders. Large swaths of the U.S., even back then were as safe as a baby in its mother’s arms.
A discussion of OK counties that had no murders in 2019 & 2020.
https://rumble.com/v1oo1bb-divorcee-sam-seder-and-the-democrat-crime-wave-part-ii.html Various Democrat enclaves (Jackson (MS), St. Louis City, Newark, Richmond, Milwaukee, Pontiac, Kansas City (MO), Syracuse, Cincinnati), their sky-high murder rates & horrible government schools.
https://rumble.com/v1oh7ps-divorcee-sam-seder-just-in-case-he-talks-about-the-abrams-kemp-debate.html Another edition of counties in Georgia that are uber-Democrat vs. uber-Republican & a comparison of their murder rates from 2016-20. Demographics of arrestees for murder in the Peach state for the same time frame.
https://rumble.com/v1oaxm2-chris-schwartz-black-hawk-county-iowa-supervisor-debunked-on-gun-control-an.html Debunking Black Hawk County, Iowa Supervisor Chris Schwartz on gun control & crime. This clown is as smart as he is skinny.
https://rumble.com/v1nnmn0-divorcee-sam-seder-and-the-democrat-crime-wave.html A montage of Democrats wanting to “Defund the Police” & being surprised after the George Floyd riots that the murder rate went through the roof (again, usually in Democrat cities & counties) .
Data on various Democrat-run jurisdictions w/ high murders rates & the crummy state of their government school systems. We need School Choice folks to allow kids to get out of these dropout factories in Chicago, Detroit, Indianapolis, Washington D.C. & Lost Angeles. Chronic absenteeism is a YUUUGE problem too.
https://rumble.com/v1m31o6-aoc-and-the-democrat-insurrection.html Debunking the vacuous #AOC on the spike in violent crime & murder in NYC. Progressive policies that turned a blind eye to turnstile jumping, being drunk in public & pissing on the sidewalk are the main reasons urban mass transit in New York City is dangerous.
When one considers that the number of passengers on urban mass transit has declined markedly since the COVID-19 plandemic, the spike in violent crime on the subway is even more pronounced.
This is the Democrat #INSURRECTION
https://rumble.com/v1lo2z7-eric-bolling-the-democrat-insurrection-and-normalizing-pedophilia.html Grouping together a long list of Democrat enclaves & informing everyone that from 2018-20, that collective averaged >14 murders every…. Single…. Day. How many “mass shootings” is that?
Asians are arrested for violent crime & murder rarely. Why is that?
https://rumble.com/v1l6d65-brian-tyler-cohen-is-not-very-bright-part-vi.html A challenge I have not seen any Democrats take. Find me a state, any state where the whitest, most pro-Trump counties have homicide rates HIGHER than the national average, higher than the state average & homicide rates HIGHER than the most pro-Biden/Hillary counties.
The real #INSURRECTION is a Democrat #INSURRECTION
The most violent jurisdictions in America have lots of black on black homicide, lots of fatherless children, lots of working age folks taking a break from the labor force & they overwhelmingly vote Democrat.
More data added to https://web.archive.org/web/20230801020040/https://professor_enigma.webs.com/covid-increase-homicides covering various states & the demographics of their violent crime & murder offenders.
https://rumble.com/v1hde7n-brian-tyler-cohen-and-stacey-abrams-are-not-very-bright.html https://web.archive.org/web/20230801020040/https://professor_enigma.webs.com/covid-increase-homicides https://rumble.com/v1iyzvv-brian-tyler-cohen-and-the-real-democrat-insurrection.html Pitting Georgia counties that voted ≥60% for the obese Stacey Abrams, Hillary Clinton & Joe Biden vs. Georgia counties that voted ≥60% for Brian Kemp & Donald Trump twice. Which set do you think had a murder rate much higher than the GA average & much higher than the national average?
If I performed the same task for Missouri, what do you think the results would be?
https://rumble.com/v19hafa-brian-tyler-cohen-is-not-very-bright.html https://rumble.com/v1adwgn-brian-tyler-cohen-is-not-very-bright-part-ii.html https://rumble.com/v1by5bz-brian-tyler-cohen-is-not-very-bright-part-iii.html https://rumble.com/v1d1d7f-brian-tyler-cohen-is-not-very-bright-part-iv.html Brian Tyler Cohen’s cut-and-paste “Red State Murder Problem”, his blue state/red state homicide pap gets nuked. I cover numerous states (some GOP leaning, some not, some w/ high murder rates, some w/ low murder rates) & the jurisdictions where the murder is spiking tend to be “Blue” cities & counties.
I also cover numerous states & pit the uber-Republican counties (≥60% of the vote) vs. the uber-Dummycrat (≥60%) counties & give you their murder rates. Funny how the “red state murder problem” is a “Blue County Murder Problem.”
I also sprinkle in a lot of data from various states pertaining to the demographics of murder arrestees & murder victims.
https://rumble.com/v18hxxn-divorcees-sam-seder-and-old-fart-rants-are-suddenly-concerned-about-dead-pe.html Examining FBI arrest data & the arrestees (for murder & violent crime overall) tend to disproportionately be black males. You can call me racist, you cannot call me wrong. When ~6.6% of the population commits >40% of all murders, we have a cultural problem. Black men are also >40% of murder victims in any given year.
https://rumble.com/v171ssp-divorcees-sam-seder-and-old-fart-rants-are-suddenly-concerned-about-dead-pe.html Reading off the names of black children murdered in Baltimore & Chicago. Grab a Snickers, you will be here a while.
The vast majority of murder arrestees & murder victims in Virginia are black. VA has a high % of Asians, why aren’t they slaughtering each other in the streets?
Comparing murder rates in Democrat-leaning Richmond, Roanoke, Norfolk, Danville, Newport News, Petersburg, Hampton & Portsmouth versus the rest of the state. Arrests for various violent crimes in those cities seriously declined 2019-20, relative to the previous two years (and only 6 months of that was the George Floyd riots). Ferguson Effect?
Arrests in the District of Columbia for various violent offenses plummeted 2019-21, relative to the previous 3 years. Ferguson Effect?
I provide data for a few jurisdictions (such as Denver & Virginia) on the number of children murdered there. Were the troglodytes saying their names or does it only matter when it is politically-expedient?
https://rumble.com/v169x5s-divorcees-sam-seder-and-old-fart-rants-are-suddenly-concerned-about-dead-pe.html Arrests for (Murder/non-negligent manslaughter, rape, robbery & assault) Maryland statewide & Baltimore City declined 2018-2020, relative to the previous 3 years, but murder was up. Ferguson Effect? ~80% of MD’s murder victims & offenders are Black.
Murder victims & offenders in lily-white Minnesota tend to be young, black males.
Total Arrests for Murder/non-negligent manslaughter, Rape, Robbery & Aggravated Assault in Illinois declined 2019-20, relative to the previous 2 years.
I also compare murder rates in Detroit, Flint & Pontiac vs the rest of the state & the Twin Cities vs. the rest of Minnesota. >72% of the murder arrestees in Michigan are black.
https://rumble.com/v15vk83-divorcees-sam-seder-and-old-fart-rants-are-suddenly-concerned-about-dead-pe.html Most adult arrestees in New York City for “violent” offenses are black. The number of arrests for “violent” crimes in NYC declined 2019-21, relative to the 3 prior years. Sounds like a Ferguson Effect at work.
Several other Democrat-leaning jurisdictions in NY (including statewide) saw the same exact trend.
https://rumble.com/v15dy6b-sam-seder-and-old-fart-rants-are-suddenly-concerned-about-dead-people-in-bu.html A mass shooting in Buffalo suddenly triggered a lot of Progressive to be concerned about dead people in Buffalo. They are many decades late, the murder rate in this slowly dying city has been high for a very long time. Most of the murder & shooting victims in Buffalo are… Black. Surprise!
Buffalo has a lot of single-parent households & a public school district that is churning out dysfunctional people who will be well prepared… to slice the lunch meat years from now. Just the way the Democrats want it, more dysfunctional people = more Democrat voters. Don’t give those black parents school choice, that might result in some black children that are prepared to have a job when they finish high school. Democrats need young black folks to remain dependent on government or they may not win as many elections.
https://rumble.com/v137ctu-is-black-on-black-homicide-is-a-myth.html A lot of the autistics on the Progressive side of the aisle go bonkers when one talks about black on black murder, calling it a red herring, after saying blacks tend to kill blacks, whites tend to kill whites, etc.
True, whites do tend to kill whites & blacks tend to kill blacks, but blacks kill other blacks at a rate much, much higher than whites kill whites or any other ethnic group. Exit question: Why are Asians such a tiny % (much smaller than their % of the population) of those who perpetrate violent crime & murder? Maybe because there are fathers in those homes who will chasten Timmy when he misbehaves?
https://rumble.com/vfxji5-old-fart-rants-the-ferguson-effect-and-michael-brown.html https://www.facebook.com/permalink.php?story_fbid=1871735112973443&id=100004109170994 “Hands Up, Don’t Shoot” was a lie & some data on violent crime in Ferguson, Missouri. There was plenty of murder in that dunghole (which is inside the U.S.’ most dangerous metro area, St. Louis) for the BLM crew to screech about, but I guess they didn’t care until a white cop defended himself from a thug.
https://rumble.com/vfvmzh-story-county-iowa-supervisor-latifah-faisal-and-iowas-constitutional-carry-.html I challenged (and she blocked me) Story County, Iowa Board of Supervisors Hobbit Latifah Faisal #latifahfaisal #faisal4story on Iowa’s new “Constitutional Carry” Law back in 2021. No response of course.
I got data from an unconventional source & calculated Iowa’s murder rate from State Legislature documents, before & after “shall-issue.” If you’re curious as to what the FBI https://cde.ucr.cjis.gov/LATEST/webapp/#/pages/explorer/crime/crime-trend says for the same time frame, it was 1.64 per 100,000 in 2006-10 & it was 2.033 per 100,000 in 2011-2019 (post “shall-issue”).
https://rumble.com/vez32x-sam-seder-old-fart-rants-latifah-faisal-mccainisthroughx-just-in-case-they-.html https://crimeresearch.org/2021/03/the-false-narrative-of-white-supremacists-doing-mass-public-shootings-racial-gender-religious-and-political-views-of-these-killers-from-1998-through-january-2021/ I posted a response after a mass shooting in Boulder, just in case some of the interwebs’ greatest carnival barkers (the divorcee Sam Seder, the Chicago Janitor McCainisthorughX, the rat-faced Ilhan Omar) try to exploit it. A little data on those mass shooters, they’re not as white as the antique media portrays them.
https://rumble.com/vdvrgz-old-fart-rants-doesnt-know-what-an-assault-weapon-is.html Demonstrating that the Bill Clinton-era “assault weapon” ban did not have any sort of mitigating effect on murder rates in these United States. In addition, the ban focused on cosmetic features. It was a lot of fluff, not much stuff.
*** Above you will find numerous videos, which are either follow-ups or a supplement to the essays below
https://web.archive.org/web/20230801020040/https://professor_enigma.webs.com/covid-increase-homicides Loads of data here, focusing on numerous states & the problem areas. E.G. What is the murder rate in Illinois OUTSIDE of Chicago & East St. Louis? What is the murder rate in Iowa OUTSIDE of Fort Dodge, Waterloo, Cedar Rapids, Des Moines, Davenport & Ames? What is the murder rate in Michigan OUTSIDE of Detroit, Flint, Pontiac? I have lots of examples in that area.
I also cover NUMEROUS states (such as GA, MO, MI and on and on) & look at the counties that voted ≥60% for Donald Trump (or numerous GOP candidates, I choose 60% because those are outliers, that’s a high water mark) & chronicle their murder rates.
I also compare the counties that voted ≥60% for Dumbasscrat candidates (Dementia Biden, Shillary & statewide local candidates) & compare their murder rates to the uber-GOP counties. I did this for several time periods (2018-2020 & 2020-22, etc.) The results will not surprise you… unless your name is Sam Seder & you have an IQ around room temperature.
In many of those analyses, I posted state data on arrestee demographics. That might make your jaw drop.
More data on how violent crime & murder spiked in the wake of the George Floyd riots & how many municipalities took money away from their police and/or ended proactive policing, enabling the terrorists to wreak havoc on their communities.
If the bad guys know there is a good chance they will never get caught, they are more likely to go for the gusto.
Further buttressing this, I have data on arrests for violent crime & murder. In many of these jurisdictions violent crime overall was not moving, but the murder rate itself was spiking. However, arrests for those crimes plummeted.
Data on cities like Baltimore, which are letting violent people loose too early. This is causing more people to be murdered because dangerous people are out on the street & not behind bars, where they belong.
Democrat-dominated jurisdictions like New York City, San Francisco, etc. are having to lock up items like toothpaste & Spam (yes, Spam!) because hordes of lunatics are swarming in, stealing everything & running off.
This is not happening all over Rural, lily-white Iowa, Montana, Idaho, etc. It is happening most often in places run by Democrats. If you try that in rural Iowa, you may have a very, very bad day. We don’t tolerate smash-and-grabs.
I have a section on Democrats who want to “defund the police”, but they spend A LOT of $ on private security (or use LEOs at taxpayer expense) to keep themselves safe. They want to thin the ranks of the police, all while blockading your ability to defend yourself & your children from maniacs.
Police response times in many Democrat cities for “non-emergency” items has increased, making it harder to catch the bad guys that steal cars.
LOTS of data on counties in the U.S. that have no murders & <2 murders per year. I cover a lot of states, so many that I came to the same conclusion John Lott did – about 2/3 of U.S. counties in a given year have <2 murders. The real problems exist in a few hundred of all U.S. counties.
John Lott has data on WHERE murders in violent cities are occurring. It is usually segregated to a few neighborhoods in the city (such as Lost Angeles & D.C. to name a few), not “all over.”
More demographic data on statewide arrests for murder in various jurisdictions.
A detailed section debunking Black Hawk County, Iowa Supervisor Chris Schwartz & his “we’re not safe anywhere” proclamations. He is projecting the hood rat culture of Waterloo on the entire state of Iowa. In any given year, two-thirds to three-quarters of Iowa’s counties have zero murders.
I examine a boatload of states in this section, crime is not evenly distributed, whether it be a low or high murder rate state run by the Dums or the GOP. Chris’ statement is one of the dumbest I have ever encountered. He obviously does not read much (unless it’s a book with coloring areas).
Lots of data on the non-white & white homicide victimization rates going way back to the 1910s. Someone likely has the arrest or conviction data for the offenders, but it is not published. Blacks have always had a homicide victimization rate way above the national average, even after the Civil Rights Act.
I surmise that the offenders have always been the same, usually young black men.
The demographics of counties in America that have <2 murders tend to lean heavily Republican & heavily white. You can call me racist, but you cannot call me wrong.
More data on arrestee demographics in numerous states.
***
https://web.archive.org/web/20220608034412/https://professor_enigma.webs.com/old-fart-rants-5 https://web.archive.org/web/20230724234657/https://professor_enigma.webs.com/sam-seder-ilhan-omar-racism https://web.archive.org/web/20220608034416/https://professor_enigma.webs.com/sam-seder-ilhan-omar-racism2 https://web.archive.org/web/20220608034411/https://professor_enigma.webs.com/sam-seder-ilhan-omar-racism3 A rundown of numerous Democrat-leaning & Democrat-dominated cities, their murder rates & proof that they vote for Democrats the vast majority of the time. Their murder rates collectively are >4X the national average. #whitesupremacy #blacklivesmatter Another facet of most of these jurisdictions, they’re diverse & a lot of young black men are being sent to the morgue by…… other young black men. You can call me racist; you cannot call me wrong.
***
Black Lives Do Not Matter https://web.archive.org/web/20231001192843/https://professor_enigma.webs.com/black-lives-do-not-matter Covering the number of black on black vs. white on white murders, 2004-2018. If you are foreign to this subject matter & have heart problems, get the defibrillator ready. I also cover (FBI data) the number of white on black & black on white murders for that time frame. Also gives data on the black-on-black murder RATE vs. the white-on-white murder RATE.
Data on the % of murders in a selected time period that featured “multiple victims,” addressing the Progressive obsession w/ “mass shootings.” Unlike their data (which usually includes folks “injured”), this focuses on actual dead people.
Data on number of LEOs/police officers murdered & assaulted in the line of duty. Data on the # number of “justifiable homicides”, events where a person is in the process of committing a felony (aggravated assault, robbery, rape) & a “good guy w/ a gun” (LEO or private citizen) pulls a firearm & sends the perp off to a meeting w/ Jesus Christ of Nazareth.
The percentage of murders where a “firearm/gun” was used to commit the dirty deed. What % of murders were committed w/ a “rifle or shotgun.”
The relationship (or lack thereof) a murder offender had w/ their victim & data pertaining to how Black Lives Matter & their fatherless base used the George Floyd riots into prohibiting pro-active (“broken windows” policing) policing, allowing their base to burn buildings & intimidate the general public. This resulted in about 8 thousand extra murders over the 2020-21 period, relative to the 2016-19 average.
Data on what % of violent crime & murder arrestees are a given race (Black, Asian, White, Hispanic, etc.) Why do Asians behave so well?
754
views
1
comment

Black Hawk County, Iowa Supervisor Chris Schwartz debunked again (Waterloo)
Chris Schwartz (Black Hawk County, Iowa Supervisor) says, "We're not safe anywhere" & is using his own ignorance as an argument for Nazi-style & Leninist gun control
***Relevant screenshots for this essay can be found here https://www.facebook.com/permalink.php?story_fbid=pfbid0v1pVhRSocVnTdq9zfoZQ5NTVZ4K47BHsW72rK3GmiP7bDuUepgaKkQ1GnsS6teUSl&id=100064869933577 https://www.facebook.com/permalink.php?story_fbid=pfbid0Sn6Ws4qvaq82MrArqMmt7HQXHGr5jeTGWuzBna83JRYEktbFcxhUmm9GgJSAPvdel&id=100004109170994 ***
https://web.archive.org/web/20230000000000*/https://professor_enigma.webs.com/covid-increase-homicides I’ve debunked Chris Schwartz before https://rumble.com/v1oaxm2-chris-schwartz-black-hawk-county-iowa-supervisor-debunked-on-gun-control-an.html https://rumble.com/v3255lu-chris-schwartz-black-hawk-county-iowa-supervisor-debunked-again-we-arent-sa.html https://rumble.com/v1tfb1c-chris-schwartz-black-hawk-county-iowa-supervisor-says-were-not-safe-anywher.html for saying, “We’re not safe anywhere” so let us do it again.
Most of this will be review, but I will add a tidbit or two of new information. Democrats often repeat that same garbage over & over ala Goebbels, hoping to dupe people into becoming slaves to the state because slaves to the state are easier to control.
From 2016-22 (make sure you select 1/1/16 to 12/31/22) https://icrime.dps.state.ia.us/CrimeInIowa/Report/DrillDownReports according to the State of Iowa, there were 428 cases of Murder/Nonnegligent Manslaughter, which equals a murder rate of (Iowa’s population 2016-22 = 22,165,187 https://www.census.gov/data/datasets/time-series/demo/popest/2020s-counties-total.html https://www.census.gov/data/datasets/time-series/demo/popest/2010s-counties-total.html) 1.930 per 100,000. That is uber-low. Must be #whitesupremacy causing that, right?
Waterloo City during that time frame according to the State of Iowa had a whopping 40 murders. The city’s population from 2016-22 was 471,464 & that’s a murder rate of 8.484 per 100,000. For Chris Schwartz & his mouth-breathing zombies, that is 440% HIGHER than the Iowa average. I will again state that Waterloo is a Democrat-dominated “diverse” city.
https://web.archive.org/web/20230000000000*/https://www.biggestuscities.com/city/waterloo-iowa https://www.census.gov/quickfacts/fact/table/waterloocityiowa/PST045222
According to the Waterloo Police Dept. https://web.archive.org/web/20230000000000*/https://waterloopolice.com/images/recordsreports/ucrstats.pdf from 2016-22 there were 38 murders, which is a murder rate of 8.06 per 100,000.
The FBI https://cde.ucr.cjis.gov/LATEST/webapp/#/pages/explorer/crime/crime-trend pegs Waterloo’s murders from 2016-21 (2022 is NOT out yet) at 32. It is a very unsafe city is a state that has a lot of counties sans murder.
I find it amusing at best, evil at worst that a person from that area is complaining that we aren’t safe anywhere. Uh yeah, speak for yourself dummy.
Now let’s look at the demographics of these murders, shall we? According to the FBI, from 2016-21 there were 19 murder offenders in Waterloo, Iowa & 17 of them (89.47%) were Black. Of the 31 victims where the race of the victim was known, 25 (80.64%) were Black in a city that is ~17% Black.
https://icrime.dps.state.ia.us/CrimeInIowa/Report/ArrestDrillDown According to the State of Iowa, of the 14 arrestees for murder in Waterloo, 13 of the 14 (92.85%) were Black (2016-22).
The problem children in Iowa https://icrime.dps.state.ia.us/CrimeInIowa/Report/ArrestDrillDown (Fort Dodge, Ames, Waterloo, Cedar Rapids, Des Moines, Davenport) featured 76 arrestees (2016-22) for murder & 68.42% (52) of them were Black.
https://icrime.dps.state.ia.us/CrimeInIowa/Report/CrimeDistributionReport Concerning again the problem children in Iowa (2016-22, Fort Dodge, Ames, Waterloo, Cedar Rapids, Des Moines, Davenport) of the 155 weapons used (excluding “unknown”), 45 (29.03%) of them were not a firearm/gun.
https://icrime.dps.state.ia.us/CrimeInIowa/Report/CrimeDistributionReport Again, the same cities as above (Fort Dodge, Ames, Waterloo, Cedar Rapids, Des Moines, Davenport), the “location type” of murder victims – (excluding “unknown”) of the 163, 50.92% (83) were murdered outside a “residence/home.” 62 of the 163 (38.03%) were murdered in what could be considered “outside”, such as a gangbanger approaching you in the parking lot to rob & carjack you. Leaving your gun at home will do potential victims no good.
The percentage of folks murdered outside a “residence/home” is much higher in those cities than Iowa en masse as you will see.
https://icrime.dps.state.ia.us/CrimeInIowa/Report/CrimeDistributionReport For the entire state of Iowa (2016-22) pertaining to “Location Type” of the 420 victims (excluding “unknown”) 118 (28.09%) were killed in what could be categorized as “outside.” 166 victims (39.52%) were killed outside of a “residence/home.”
https://icrime.dps.state.ia.us/CrimeInIowa/Report/CrimeDistributionReport Concerning the preferred weapons of those who commit murder in Waterloo, 30 of the 38 (78.94%) featured some sort of “firearm” (firearm, handgun, shotgun), the other 8 were either burned by some incendiary device that is not a firearm, curbed stomped (personal weapons) or took a baseball bat or similar weapon to the cranium. I checked this https://icrime.dps.state.ia.us/CrimeInIowa/Report/MurderCrimeByORIReport to make sure the numbers jive (more sources, better data) & they did.
That same webpage allows you to take a gander at the “Location Type” so you can see where folks met their end. This is important, as Fascists like Black Hawk County, Iowa Supervisor Chris Schwartz want to disarm rural Iowans because lunatics (like his constituents in Waterloo) are indiscriminately killing.
I have a firearm (I utilized CCW even before Iowa enacted “Constitutional Carry”) to protect myself in the unlikely event that one of Chris Schwartz’s voters attempts to carjack me, mug me or assault me.
In Waterloo (2016-22) of the 40 murders, 17 of them (42.5%) took place *outside* a home/residence. I mention that because some of the Fascists are okay w/ me defending my home, but outside the home, not so much. As if none of Chris’ constituents in Waterloo are privy to attacking innocents (or other gangbangers who never give out a present on Father’s Day) outside of their home or apartment.
14 of the 40 (35%) took place in what could be considered “outdoors” (Highway/road/alley/street/sidewalk, gas station, field/woods, parking garage, or park/playground). In Waterloo, almost half the murders do not take place in a home or residence & over a third are outside. How is some old man or old lady supposed to protect herself from some knife-wielding lunatic, who could probably overpower them even if they were not armed?
What is Chris Schwartz’s plan if some clown strung out on meth & pills kicks his door in at 2 AM? Call the police & tell the perp to wait 10 minutes? What a dummy!
According to the FBI, 23 of the 30 (2016-21) weapons (76.66%) involved in murder in Waterloo were a “firearm” or “gun.” During the same time frame, 18 of the 32 victims were killed inside a home or residence, meaning 43.75% were not killed in a home or residence. During the same time frame, 10 of the 32 victims (31.25%) were killed “outside” (field/woods or Highway/Alley/Street/Sidewalk).
Sounds like you’re not safe outside your home in Waterloo, doesn’t it?
According to the FBI (2016-21) of the 454 victims (excluding “unknown” locales) in Iowa, 261 were killed inside a “residence/home”, meaning 42.51% were killed outside a “residence/home.” Of the 454 victims, 30.61% (139) were killed in what could be considered “outside” (park/playground, convenience store, beach, parking garage, etc). That jives pretty close to the data from Waterloo.
According to the FBI (2016-21 Iowa), the preferred weapon (excluding “unknown”) to commit murder was a “firearm” (263 of 417) 63.06% of the time, meaning 36.94% of the time, a gun was not needed.
https://icrime.dps.state.ia.us/CrimeInIowa/Report/CrimeDistributionReport For Iowa en masse (2016-22), of the 394 known weapons, 40.86% (161) of them did NOT involve a gun/firearm. Pretty close to FBI data, even though their 2022 data is not out yet.
You can see the problem children in Iowa have guns being used to commit murder more often than Iowa en masse & you have a higher % of murders being committed outside a “residence/home.”
We are going to keep going, but my point is this – it’s “rare” (unless YOU had a relative murdered at a gas station, walking down the sidewalk or hiking trail or at a beach minding their own business) that people get murdered while filling up for gas or parking their car at a garage & heading to work, but it happens & denying people their God-Given & Constitutional Right to defend themselves from lunatics basically ensured that every rapist, carjacker & gang-banger (especially if you are in Cook County, IL, Lost Angeles, Chicago, etc) will get their way, possibly kill you & never be caught.
Chris Schwartz & his cronies have a vision of Fascism for America & it involves disarming rural Iowans so they cannot defend themselves. I am certainly not looking for trouble, but in the *unlikely event* I am in Des Moines & someone attempts to steal one of my SUVs they will find trouble at the end of a barrel.
I have a dashcam to record any information I might need (but many criminals are affixing fake plates on their cars, so giving the police that info will do no good, they’ll have it replaced in an hour) & I have a firearm to protect myself.
I DO NOT advertise that, but I have it should I need it. Chris Schwartz screeches like a lunatic over murders in the most dangerous city in Iowa (Waterloo) & most of Iowa is as safe as a baby in its mothers’ arms.
Unless of course you’re carrying that baby into the pediatrician, your hands are full & some lunatic walks up to you, demanding money. If hubby is there, he pulls his revolver (because he’s strapped!) & tells the meth head to back off or he’s going to be pushing daisies!
Let us continue & examine Illinois https://ilucr.nibrs.com/ReportsIndex/List
https://ilucr.nibrs.com/Report/DrillDownReports From 2016-22 in the Land of Lincoln, of the 1,431 victims (Excluding “other/unknown”), only 30.88% (442) were murdered inside a “home/residence”. In IL, you are more likely to be murdered outside a home or residence than in Iowa & IL has a high homicide rate.
I counted 914 murders (63.87%) that could be categorized as “outside”, it sounds like you’re in great peril in IL. If you have followed my essays, you know most of this is likely Cook County & most of that is Chicago, so let us look at Chicago, shall we?
Same data as above, (2016-22) of the 941 victims (excluding “other/unknown”), 77.15% (726) were murdered outside a “residence/home.” That is an alarming number of folks (and I submit, some of it is gangland violence where a gang member gets a “receipt” for a murder some months ago) murdered outside of a home.
Of those 941 victims, 72.9% (686) were murdered in what could be considered “outside.” That is an alarmingly high percentage. Remember when Michelle Obongo said Barack Obama could be killed just filling up his car at a gas station?
Chicago has plenty of that, people getting snuffed out while they are not at home watching TV. They’re filling up their car, they’re watching their children play at the park, they’re parking their car at the parking garage & bang, they’re dead.
https://ilucr.nibrs.com/Report/CrimeDistributionReport Now let us look at the preferred weapons of assailants 2016-22, first for IL en masse. Of the 1,361 weapons (excluding “unknown”) 11.46% (156) were not a firearm or gun. IL residents use firearms to kill their targets much more often than Iowans or even the most violent areas of Iowa. YIKES!
Now let us run those numbers for Chicago. Of the 913 known weapons, 57 (6.24%) were NOT a firearm, meaning 856 (93.75%) of them were. That is statistically very, very high. In Chicago, one of the murder capitals of the U.S. there are a high % of firearm murders.
According to the FBI (2021; IL has not been NIBRS friendly for very long) in Illinois en masse there were 514 known weapons, 92.21% (474) were firearms. In 2021, of the 528 murder victims where the location of the murder was known, only 26.7% (141) were inside a “residence/home.” 358 of the 528 locations (67.8%) could be considered “outside.” That’s only one year of data though & disproportionately high, dovetailing w/ state data.
***
https://coloradocrimestats.state.co.us/public/View/dispview.aspx?Repo (Select “Violent Crime Weapons”) In Colorado from 2016-22 (excluding “unknown”), “firearms” were responsible for 1,361 of the 1,900 known weapons used to commit murder or 71.63%.
According to the FBI from 2016-21 (Colorado), of the 1,373 known weapons, 69.7% (957) of them were firearms. 416 of the weapons (30.29%) during the commission of a murder occurred where the assailant did NOT need a firearm.
https://coloradocrimestats.state.co.us/public/View/dispview.aspx?ReportId=39&MemberSelection_[Incident%20Date].[Incident%20Date%20Hierarchy]=2022&MemberSelection_[Jurisdiction].[Jurisdiction%20Hierarchy]=CO Pertaining to locations of murder in Colorado 2016-22 (excluding “other/unknown”), 954 of the 1,893 (50.39%) occurred in a “residence/home.”
According to the State of CO (adding the totals for “Road/Parking/Camps”), 36.34% (688) of the murders occurred in what would be categorized as “outside”.
https://cde.ucr.cjis.gov/LATEST/webapp/#/pages/explorer/crime/crime-trend According to the FBI 2016-21, the weapon of choice (excluding “unknown” weapons) for murderers in DENVER was firearms at 72.7% (309 of 425) of the time. That is actually pretty close to the CO statewide average. Denver has seen its murder rate skyrocket since career criminal & drug addict Saint George Floyd met his Creator.
According to the State of Colorado (2016-22), of the 526 known weapons in Denver, 75.66% (398) were firearms.
According to the FBI (2016-21), of the 428 KNOWN locations for murder in Denver County, 64.71% (277) took place outside a “home/residence.” Of the 428 KNOWN locations for murder, 56.77% (243) took place “outside.” Your gun sitting at home locked-up does you no good when you have a meth-addled lunatic shoving a knife in your face demanding money to feed his habit.
***I apologize, I was adding “Convenience Store” as “outside” when it likely is not because there is a “highway/street/alley/sidewalk” category, so the counts prior to this on that tabulation might differ slightly. I am still adding “park/playground”, “gas station”, “waterway/beach” & “parking garage/lot” to the “outside” category***
According to the State of Colorado (2016-22) of the 547 KNOWN locations for murder in Denver County, 66.91% (366) took place outside a “residence/home.” Of the 547 known locations, 54.29% (297) took place in what would be considered “outside.”
A disproportionate % of murders in Denver County (compared to CO or IA en masse) take place “outside” & not in a “residence/home.”
***
How about Missouri? https://showmecrime.mo.gov/public/ A “red state” that Dumbasscrats autistically-repeat as “proof” that GOP-dominated areas are petri dishes for violence, yet it is three jurisdictions (Jackson County & most of that is KC, St. Louis City & St. Louis County) where the violence is most prevalent.
According to the State of MO (2016-22, Select “Murder weapon type combined”), of the 4,717 known weapons in the Show Me State, 80.6% (3,802) were firearms.
According to the State of MO (2016-22, I selected “Murder weapon type” & then added “Location Type” & added all those individual “locations”) of the 2,224 known location types (excluding “other/unknown”), only 46.44% (1,033) took place inside a “residence/home.”
According to the State of MO, of the 2,224 known location types (2016-22), 44.01% (979, “road/parking/camps”) took place in what could be categorized as “outside.”
According to the FBI (2020-21, MO only recently became NIBRS friendly), of the 876 known weapons, 85.73% (751) were categorized as a “gun/firearm” in the commission of murder.
According to the FBI (2020-21), of the 924 known locations for murder, 48.05% (444) took place in a “residence/home.” Of the 924 known locations for murder, 44.58% (412) took place in a setting that could be categorized as “outside.” That is pretty close to state of MO data, even though the time frames do not jive.
In MO, there is a high probability if you are a victim of murder, you are murdered outside, perhaps in a place you do not spend a lot of time in.
Let’s drill this down to some of MO’s problem areas, mainly KC (Jackson County) & St. Louis County. I am not covering St. Louis City because there is not good data for it.
According to the State of MO (2016-22, “Murder Weapon Type”), of the 1,392 known weapons for Jackson County & St. Louis County, 89.36% (1,244) of them were a gun/firearm. *For St. Louis County, data only for 2020-22*
According to the State of MO (2016-22, selection “Location Type” & select each individual category) of the 1,393 known locations for murder in Jackson County & St. Louis County, 47.16% (657) occurred in a “residence/home.” Of the 1,393 known locations for murder, 44.43% (619) occurred (“road/parking/camps”) in what could be considered “outside.” Your gun at home in your dresser does you no good when you’re confronted w/a knife-wielding meth head at the parking garage.
https://cde.ucr.cjis.gov/LATEST/webapp/#/pages/explorer/crime/crime-trend According to the FBI (2016-21), of the 895 known locations for murder in Kansas City, 42.56% (381) were inside a “residence/home” & 51.39% (460) could be considered having occurred “outside.”
Same time frame for Kansas City: Of the 852 known weapons, 89.9% (766) were a firearm. You are much more likely to be murdered outside & with a gun in Kansas City than MO en masse. Golly, I wonder why that is?
Since it is difficult to get county-level data from the FBI (meaning I would have to look at numerous jurisdictions inside the county), I will not cover St. Louis County.
Instead, how about St. Louis City? For 2021 (they have not been submitting NIBRS data for very long) of the 177 known weapons, 97.17% (172) were a firearm & of the 180 known locations for murder, only 25% (45) were inside a “residence/home.” That is very, very disproportionate. Of the 180 known locations for murder, 68.88% (124) could be categorized as “outside.”
As you can see, in the most violent & incidentally Democrat-leaning areas of MO, you are far more likely to be murdered w/ a firearm than MO en masse & you are far more likely to be murdered “outside”, not within the safety of your home’s 4 walls.
***
Let us take a look at Ohio, using only FBI data. I can’t find good state data for what I want, so the FBI will supply it for us.
From 2017-21 in The Buckeye State, of the 2,963 known locations for murder, 49.74% (1,474) were inside a “residence/home.” Of the 2,963 known locations for murder, 43.26% (1,282) could be considered as having occurred “outside.”
Of the 2,846 known weapons to commit murder in OH (2017-21), 79.83% (2,272) were firearms.
Now, what about (this will be FBI data again) the most violent areas of Ohio, which lean Democrat?
Cleveland: From 2017-21 of the 549 known locations for murder, 31.32% (172) were inside a “residence/home.” Of the 549 known locations for murder, 63.57% (349) could be considered as having occurred “outside.”
Cleveland: From 2017-21 of the 491 known weapons, 91.03% (447) were a firearm/gun. On both accounts, they are much worse than the entire state of Ohio.
Toledo: From 2017-21 of the 200 known locations for murder, 47% (94) were inside a “residence/home” & of the 200 known locations for murder, 47.5% (95) were categorized as “outside.”
Toledo: From 2017-21 of the 206 known weapons, 84.46% (174) were a “firearm/gun.”
Akron: From 2017-21 of 166 known locations for murder, 55.42% (92) were inside a “residence/home.” Of the 166 known locations for murder, 40.96% (68) could be considered as having occurred “outside.”
Akron: From 2017-21 of the 174 known weapons, 82.75% (144) were a “Firearm/gun.”
Dayton: From 2017-21, of the 176 known locations for murder in this Democrat enclave, 48.86% (86) occurred inside a “residence/home.” Of the 176 known locations for murder, 50% (88) happened “outside.”
Dayton: From 2017-21, of the 174 known weapons, 85.63% (149) were a “firearm/gun.”
Cincinnati: From 2017-21, of the 324 known locations for murder, 30.55% (99) occurred in a “residence/home” & of the 324 known locations for murder, 65.43% (212) occurred in what could be considered “outside.”
Cincinnati: From 2017-21, of the 348 known weapons, 89.65% (312) were a firearm/gun.
Columbus: From 2017-21, of the 653 known locations for murder, 52.67% (344) were inside a “residence/home.” Of the 653 known locations for murder, 39.35% (257) took place “outside.”
Columbus: From 2017-21, of the 628 known weapons, 86.94% (546) were a firearm/gun.
You can see not all those Democrat jurisdictions had a higher % of murders “outside”, but they all had a much higher % of murders committed w/ a firearm than the OH statewide average.
***
Let’s look at Wisconsin & then Milwaukee City.
Wisconsin (FBI, 2017-21): Of the 1,046 known locations for murder, 39.19% were (410) inside a “home/residence.” Of the 1,046 known locations for murder, 54.87% occurred (574) in what would be considered “outside.”
Wisconsin (FBI, 2017-21): Of the 1,004 known murder weapons, 80.97% (813) of them were a firearm/gun. Remember, WI is typically a low-murder state, Milwaukee City – not so much.
Milwaukee City (FBI, 2017-21): Of the 680 known locations for murder, 28.67% (195) occurred in a “residence/home.” Of the 680 known locations for murder, 67.2% (457) occurred “outside.”
Milwaukee City (FBI, 2017-21): Of the 685 known murder weapons, 89.48% (613) were a firearm/gun. On both those categories, the war zone known as Milwaukee City is much worse than WI statewide. In Milwaukee, the murder rate is much higher & you are far more likely to be shot & killed there outside, where unarmed intended victims are easy prey for The Cream City’s most violent sleazeballs.
Kenosha (FBI, 2019-21) is also a problem child in WI. They do not have a lot of people, but they do have a lot of murders for such a small city. Of the 21 known locations for murder, 61.9% (13) were in a “home/residence” & of the 21 known locations for murder, 33.33% (7) were “outside.”
Kenosha: (FBI, 2019-21) Of the 17 known murder weapons, 88.23% (15) were a “firearm/gun.”
***
https://txucr.nibrs.com/ReportsIndex/List Let’s do Texas now!
https://txucr.nibrs.com/Report/CrimeDistributionReport From 2016-22 of the 7,452 known locations for murder in Texas en masse, 48.89% (3,644) occurred inside a “residence/home.” Of the 7,452 known locations for murder, 38.99% (2,906) occurred in an “outside” setting.
From 2016-22 in Texas en masse, of the 7,003 known weapons used to commit murder, 78.52% (5,499) were a “Firearm/Gun.”
Now for some of TX’s most dangerous areas. Some of these I know by heart, but I did look at Offense Density reports & cherry-picked some cities from some of the most dangerous counties to expand this list. I will do another w/ just the usual suspects. The counties bordering Harris are experiencing the “fruits” of being close to Houston.
From 2016-22 in Arlington, Austin, Brownsville, Dallas, Denton, Fort Worth, Galveston, Houston, Killeen, Laredo, League City, Lubbock, McAllen, San Antonio & Temple: Of the 4,086 known weapons to commit murder, 82.45% (3,369) were a “Firearm/Gun.”
From 2016-22 (Arlington, Austin, Brownsville, Dallas, Denton, Fort Worth, Galveston, Houston, Killeen, Laredo, League City, Lubbock, McAllen, San Antonio & Temple) those same cities – of the 4,270 known locations, 40.79% (1,742) occurred in a “residence/home” & of the 4,270 known locations, 45.33% (1,936) occurred “outside.”
Now let us isolate some of the big boys (Dallas, Fort Worth, Arlington, San Antonio, Austin, Corpus Christi, Houston): From 2016-22 of the 4,064 known locations for murder, 39.96% (1,624) were in a “residence/home” & of the 4,064 known locations, 46.06% (1,872) occurred “outside.”
I should’ve added Corpus Christi earlier, sue me. Of those big boys again (Dallas, Fort Worth, Arlington, San Antonio, Austin, Corpus Christi, Houston) 2016-22: Of the 3,904 known weapons for murder, 83.17% (3,247) were a “firearm/gun.”
In all those instances, you are more likely to be murdered “outside” & with a “firearm/gun” than TX statewide. Statistically higher? Not sure, I am not going to run the numbers for that many counties across Texas.
However, consider those jurisdictions are pulling up the average in TX & sans those jurisdictions the average in TX would be much lower.
Let us go a bit further & just isolate Houston, Dallas, San Antonio & Austin. From 2016-22 of the 3,275 known locations for murder in those places, 38.16% (1,250) were inside a “home/residence” & of those 3,275 known locations, 47.51% (1,556) occurred “outside.”
That is much higher than the TX statewide average.
From 2016-22 (Dallas, San Antonio, Austin, Houston) of the 3,131 known weapons to commit murder, 84.22% (2,637) of them were a “firearm/gun.” All TX data so far was State Data.
Let us take a gander at some FBI data, shall we?
For Texas 2017-21 (not many agencies reported prior to 2017) of the 4,902 known murder weapons, 80.78% (3,960) were a “firearm/gun.”
For Texas 2017-21 of the 5,256 known murder locations, 47.9% (2,518) were inside a “residence/home” & of the 5,256 known murder locations, 39.97% (2,101) were “outside.”
Dallas (FBI, 2018-21): Of the 742 known weapons, 86.79% (644) were a “firearm/gun.”
Dallas (FBI, 2018-21): Of the 753 known locations for murder, 28.28% (213) were a “residence/home” & of the 753 known locations for murder, 54.71% (412) were committed “outside.”
Austin (FBI, 2019-21): Of the 148 known weapons, 79.05% (117) were a firearm or gun.
Austin (FBI, 2019-21): of the 153 known locations for murder, 37.9% (58) were in a “home/residence” & of the 153 known locations, 49.67% (76) were “outside.”
Houston (FBI, 2018-21): Of the 1,267 known locations for murder, 37.72% (478) were a “residence/home” & of the 1,267 known locations, 50.11% (635) were “outside.”
Houston (FBI, 2018-21): Of the 1,225 known murder weapons, 86.12% (1,055) were a “firearm/gun.”
San Antonio (FBI, 2020 & 2021): Of the 187 known locations, 52.94% (99) were inside a “residence/home” & of the 187 known locations, 29.41% (55) were “outside.” Only 14 months of data from SA though.
Tossing out San Antonio because there is not much data, in the other 3 cities (except for Austin & that applies to murders w/ a gun) you are more likely to be murdered w/ a firearm & have it occur outside.
***
Let’s look at FBI data for Tennessee (2017-21): Of the 2,832 known locations for murder, 54.69% (1,549) were inside a “residence/home.” Of the 2,832 known locations for murder, 34.85% (987) were “outside.”
Of the (TN, FBI, 2017-21) 2,735 known murder weapons, 83.32% (2,279) were a “firearm/gun.”
Now let’s look at some of TN’s problem children, mainly Memphis & Nashville.
Memphis (2017-21, FBI): Of the 1,115 known murder locations, 51.3% (572) were a “residence/home” & of the 1,115 known murder locations, 35.24% (393) were “outside.”
Memphis (2017-21, FBI): Of the 1,089 known murder weapons, 90.9% (990) were a “firearm/gun.” That is disproportionate from TN statewide.
Nashville (FBI, 2017-21): Of the 491 known murder locations, 38.08% (187) occurred in a “residence/home.” Of the 491 known murder locations, 51.52% (253) happened “outside.” In Nashville, you are much more likely to be murdered outside than in TN en masse.
Nashville (FBI, 2017-21): Of the 465 known murder weapons, 87.52% (407) were a firearm. Those cities are by far, the worst in TN & the data speaks for itself. Sounds like two of the very few Democrat enclaves in TN have a violence problem that most of TN does not have.
Brownsville, TN (FBI, 2017-21): Of the 7 known murder locations, 57.14% (4) were a “residence/home” & 42.85% (3) were “outside.”
Brownsville, TN (FBI, 2017-21): Of the 10 known murder weapons, 90% (9) were a “firearm.”
Chattanooga, TN (FBI, 2017-21): Of the 147 known murder locales, 53.06% (78) were a “residence/home” & 36.05% (53) were “outside.”
Chattanooga, TN (FBI, 2017-21): Of the 144 known murder weapons, 90.97% (131) were a “firearm.”
***
https://riucr.nibrs.com/Report/CrimeDistributionReport Rhode Island (state data, 2017-22): Of the 144 known murder locations, 40.97% (59) were a “residence/home” & of the 144 known murder locations, 45.13% (65) were “outside.”
Rhode Island (State data, 2017-22): Of the 136 known weapons to commit murder, 47.05% (64) were a “firearm/gun.”
Now for Providence City, which is a problem child inside RI (State data, 2017-22): Of the 75 known murder locations, 22.66% (17) happened in a “residence/home” & of the 75 known locations for murder, 66.66% (50) occurred “outside.”
Providence City (State data, 2017-22): Of the 75 known murder weapons, 70.66% (53) were a “firearm/gun.” On both those metrics, Providence is an outlier. You are far more likely to be murdered w/ a gun & outside in Providence, relative to the entire state of RI. They are essentially the only violent jurisdiction in that state.
What does the FBI say?
Rhode Island (FBI, 2017-21): Of the 128 known murder locales, 40.62% (52) were a “residence/home” & of the 128 known murder locales, 46.87% (60) were “outside.”
Rhode Island (FBI, 2017-21): Of the 119 known murder weapons, 64.7% (77) were a “gun.”
Providence City (FBI, 2017-21): Of the 69 known murder locales, 21.73% (15) were a “residence/home” & of those 69, 68.11% (47) were “outside.”
Providence City (FBI, 2017-21): Of the 69 known murder weapons, 72.46% (50) were a “firearm.” You see what I am getting at kids? We’re not done yet!
***
Let’s look at Minnesota, this will all be FBI data.
Minnesota (FBI, 2020-21 because most agencies did not report prior to that): Of the 347 known murder locales, 36.88% (128) were inside a “residence/home” & of those 347, 54.75% (190) occurred “outside.”
Minnesota (FBI, 2020-21): Of the 319 known murder weapons, 78.99% (252) were a “firearm.”
Minneapolis (FBI, 2020-21): Of the 172 known murder locations, 20.34% (35) were a “residence/home” & of those 172, 73.83% (127) were “outside.”
Minneapolis (FBI, 2020-21): Of the 158 known murder weapons, 87.34% (138) were a “firearm.”
St. Paul (FBI, 2020-21): Of the 48 known places for murder, 33.33% (16) were a “residence/home” & of the 48 known places, 54.16% (26) were “outside.”
St. Paul (FBI, 2020-21): Of the 41 known weapons to commit murder, 82.92% (34) were a “firearm.” MN basically has 2 jurisdictions where murder is running rampant, both are controlled by Dumocrats, you are more likely to be murdered “outside” your home & w/ a gun. Surprised?
***
https://app.powerbigov.us/view?r=eyJrIjoiMjNhMTE2MTYtNDc2Ni00YTU1LWE4N2QtNjJmMTFiNzA1NTFmIiwidCI6ImFkZjY2ZWIyLWZjY2YtNDE3My1iZjQ0LTNmNzY3MzBhYTg5ZSJ9&pageName=ReportSectiona9709fc30e95d8951d46 (Scroll to #35 & select 1/16/18 to 12/31/22) https://bci.utah.gov/crime-in-utah-dashboards/ How about Utah?
From 2018-2022 of the 355 known weapons (Utah statewide), 63.38% (225) were a “firearm/gun.”
Same time frame, but for Salt Lake City: Of the 60 known weapons, 71.66% (43) were a “Firearm/Gun.”
The state website did NOT have data on murder victim locations.
From 2017-21 (FBI, Utah) of the 309 known weapons, 68.28% (211) were a “firearm/gun.”
From 2017-21 (FBI, Utah) of the 360 known murder locales, 53.88% (194) were a “residence/home.” Of the 360 known murder locations, 36.11% (130) were “outside.”
Salt Lake City (FBI, 2017-21): Of the 64 known murder locations, 42.18% (27) were a “residence/home” & of the 64 known murder locations, 42.18% (27) were “outside.”
Salt Lake City (FBI, 2017-21): Of the 53 known murder weapons, 73.58% (39) were a “Firearm/gun.” As you can see, in SLC you are more likely to be murdered “outside” the comfort of your own home & the assailant is using a firearm. As you probably also ascertained, SLC is one of the few problem areas in uber-white, uber-safe, uber-Republican Utah.
***
Let’s go to AR, a “red state” that a lot of autistics like to screech about, but as I have documented thoroughly, most of it is black-on-black & in jurisdictions run by Democrats.
Arkansas (FBI, 2017-21): Of the 1,182 known murder locations, 64.12% (758) were inside a “residence/home” & of the 1,182 known murder locations, 28.17% (333) were “outside.”
Arkansas (FBI, 2017-21): Of the 1,113 known murder weapons, 77.89% (867) were a “Firearm/gun.”
Little Rock, AR (FBI, 2017-21): Of the 202 known murder weapons, 88.11% (178) were a “firearm.”
Little Rock, AR (FBI, 2017-21): Of the 234 known murder locations, 55.55% (130) were a “residence/home” & of the 234 known murder locations, 37.6% (88) would be considered as having occurred “outside.”
North Little Rock, AR (FBI, 2017-21): Of the 66 known murder weapons, 81.81% (54) were a “firearm.”
North Little Rock, AR (FBI, 2017-21): Of the 70 known murder locations, 52.85% (37) were a “residence/home” & 38.57% (27) occurred “outside.”
West Memphis, AR (FBI, 2017-21): Of the 41 known murder weapons, 82.92% (34) were a “firearm/gun.”
West Memphis, AR, (FBI, 2017-21): Of the 45 known murder locations, 64.44% (29) were a “residence/home” & 22.22% (10) were “outside.”
Helena-West Helena, AR (FBI, 2017-21): Of the 37 known murder weapons, 97.29% (36) were a “firearm.”
Helena-West Helena, AR (FBI, 2017-21): Of the 26 known murder locations, 69.23% (18) were a “residence/home” & 23.07% were (6) “outside.”
Jacksonville, AR (FBI, 2017-21): Of the 16 known murder locations, 75% (12) were a “residence/home” & 18.75% (3) were “outside.”
Jacksonville, AR (FBI, 2017-21): Of the 15 known murder weapons, 86.66% (13) were a “firearm.”
Pine Bluff, AR (FBI, 2017-21): Of the 106 known murder locations, 47.16% (50) were a “residence/home” & 44.33% (47) were “outside.”
Pine Bluff, AR (FBI, 2017-21): Of the 93 known murder weapons, 94.62% (88) were a “firearm.”
Jonesboro, AR (FBI, 2017-21): Of the 47 known murder locations, 65.95% (31) were a “residence/home” & 17.02% (8) were “outside.”
Jonesboro, AR (FBI, 2017-21): Of the 39 known murder weapons, 82.05% (32) were a “firearm.”
Fort Smith, AR (FBI, 2017-21): Of the 36 known murder locations, 80.55% (29) were a “residence/home” & 13.88% (5) were “outside.”
Fort Smith, AR (FBI, 2017-21): Of the 30 known murder weapons, 60% (18) were a “firearm.”
You can see from that list of cities, you are far more likely to be murdered (and these are some of AR’s worst) w/ a handgun/firearm & cumulatively, you are more likely to be murdered “outside,” although some of the smaller problem cities in AR bucked that trend.
As is the case w/ some states, their NIBRS friendly data does not go back too far, so skipping Alabama. It would be a good one to do though. Skipping Pennsylvania too. How about Michigan?
***
Michigan (FBI, 2017-21): Of the 3,100 known murder locations, 50.54% (1,567) were a “residence/home” & 41.61% (1,290) could be considered having occurred “outside.”
Michigan (FBI, 2017-21): Of the 2,660 known murder weapons, 82.18% (2,186) were a “firearm/gun.”
Now for some of MI’s more dangerous (and Democrat-leaning) jurisdictions.
Detroit (FBI, 2017-21): Of the 1,381 known murder locations, 42.28% (584) were a “residence/home” & 50.39% (696) were “outside.”
Detroit (FBI, 2017-21): Of the 1,194 known murder weapons, 91.7% (1,095) were a “firearm/gun.” In Detroit, you are far more likely to be murdered outside & w/ a firearm than MI statewide. Surprised?
Flint (FBI, 2017-21): Of the 182 known murder locations, 54.39% (99) were in a “residence/home” & 38.46% (70) were “outside.”
Flint (FBI, 2017-21): Of the 165 known murder weapons, 87.27% (144) were a gun/firearm.
Grand Rapids (FBI, 2017-21): Of the 69 known murder locations, 43.7% (30) were a “residence/home” & 50.72% (35) were “outside.”
Grand Rapids (FBI, 2017-21): Of the 64 known murder weapons, 92.18% (59) were a “Firearm/gun.”
Pontiac (FBI, 2017-21): Of the 55 known murder locations, 43.63% (24) were inside a “residence/home” & 49.09% (27) were “outside.”
Pontiac (FBI, 2017-21): Of the 49 known murder weapons, 87.75% (43) were a “firearm/gun.” You see a trend yet?
Lansing (FBI, 2017-21): Of the 76 known murder locales, 56.57% (43) were a “residence/home” & 35.52% (27) were “outside.”
Lansing (FBI, 2017-21): Of the 58 known weapons, 82.75% (48) were a “firearm/gun.”
Inkster (FBI, 2017-21): Of the 44 known murder locales, 45.45% (20) were a “residence/home” & 40.9% (18) were “outside.”
Inkster (FBI, 2017-21): Of the 39 known murder weapons, 94.87% (37) were a “firearm/gun.”
Kalamazoo (FBI, 2017-21): Of the 53 known murder locales, 49.05% (26) were a “residence/home” & 47.16% (25) were “outside.”
Kalamazoo (FBI, 2017-21): Of the 51 known murder weapons, 82.35% (42) were a “gun/firearm.”
Saginaw (FBI, 2017-21): Of the 71 known locations, 45.07% (32) were inside a “residence/home” & 42.25% (30) were “outside.”
Saginaw (FBI, 2017-21): Of the 61 known murder weapons, 96.72% (59) were a “firearm/gun.”
Muskegon (FBI, 2017-21): Of the 27 known murder locations, 59.25% (16) were a “residence/home” & 40.74% (11) were “outside.”
Muskegon (FBI, 2017-21): Of the 25 known murder weapons, 76% (19) were a “firearm/gun.”
Romulus (FBI 2017-21): Of the 13 known murder weapons, 69.23% (9) were a “firearm/gun.”
Romulus (FBI 2017-21): Of the 14 known murder locales, 35.71% (5) were a “residence/home” & 21.42% (3) were “outside.”
Highland Park (FBI, 2017-21): Of the 27 known murder locations, 44.44% (12) were a “residence/home” & 48.14% (13) were “outside.”
Highland Park (FBI, 2017-21): Of the 19 known murder weapons, 84.21% (16) were a “firearm/gun.”
Warren, MI (FBI, 2017-21): Of the 36 known murder locations, 55.55% (20) were a “residence/home” & 33.33% (12) were “outside.”
Warren, MI (FBI, 2017-21): Of the 30 known weapons used for murder, 73.33% (22) were a “firearm/gun.”
Jackson, MI (FBI, 2017-21): Of the 29 known murder locales, 41.37% (12) were a “residence/home” & 58.62% (17) were “outside.”
Jackson, MI (FBI, 2017-21): Of the 31 known weapons, 83.87% (26) were a “firearm.”
https://www.michigan.gov/msp/divisions/cjic/micr/annual-reports I did some old school tallying using MI’s state reports (2016-21), just to see if it jives w/ FBI data. More sources equals better data!
Michigan (State data 2016-21): Of the 3,392 known murder weapons, 81.48% (2,764) were a “firearm.”
Michigan (State data 2016-21): Of the 3,558 known murder locations, 49.32% (1,755) were a “residence/home” & 41.09% (1,462) occurred “outside.”
Those Democrat-dominated or Democrat-leaning areas I covered are pulling the average up in Wolverine Land.
***
Delaware (FBI, 2017-21): Of the 305 known murder sites, 37.04% (113) were a “residence/home” & 56.39% (172) were “outside.”
Delaware (FBI, 2017-21): Of the 280 known weapons to commit murder, 84.28% (236) were a “firearm/gun.”
Wilmington, DE (The problem child in DE – FBI data 2017-21): Of the 147 known murder sites, 19.72% (29) were a “residence/home” & 79.59% (117) were “outside.”
Wilmington, DE (FBI, 2017-21): Of the 136 known murder weapons, 91.91% (125) were a “Firearm.” Seem like in Joe Biden’s hometown, there are a lot of fatherless hood rats using guns to murder other hood rats (and likely, many innocents) outside. Much worse there than in DE en masse. I wonder why?
https://news.delaware.gov/2016/06/22/governor-signs-bill-closing-gun-background-check-loophole/ https://web.archive.org/web/20230000000000*/https://giffords.org/lawcenter/state-laws/background-check-procedures-in-delaware/ Delaware has universal background checks & it is definitely keeping hood rats in Wilmington from running roughshod on each other. IMO, they probably don’t keep up w/ what the Governor & Legislature are doing to close “loopholes” they ignore wholesale.
DE’s murder rate (unfortunately, the FBI does not have the state rate for 2020-21) for 2020-21 was ~8.2 per 100,000, per the NIBRS data that is published. In DE, you are far more likely to be murdered w/ a firearm & outside, relative to the national average. I wonder why?
***
How about Kansas?
Kansas (FBI, 2017-21): Of the 430 known sites for murder, 60.69% (261) were a “residence/home” & 26.97% (116) were “outside.”
Kansas (FBI, 2017-21): Of the 394 known murder weapons, 70.81% (279) were a “firearm.” I cannot add Kansas City, KS because they don’t do NIBRS. Topeka’s data is so limited, giving that a pass too. Those two would give us a good illustration as to how bad Democrat-leaning, diverse areas of KS are, but that will have to be for another day.
Wichita, KS (FBI, 2017-21): Of the 168 known murder locations, 60.71% (102) were a “residence/home” & 20.23% (34) were “outside.”
Wichita, KS (FBI, 2017-21): Of the 164 known murder weapons, 78.04% (128) were a “firearm/gun.”
Leavenworth, KS (FBI, 2017-21): Of the 13 known murder locations, 61.53% (8) were a “residence/home” & 23.07% (3) were “outside.”
Leavenworth, KS (FBI, 2017-21): Of the 13 known murder weapons, 46.15% (6) were a “firearm/gun.”
That’s about it, I was hoping for more data from KS, but no dice. KS is another state that does not institute Nazi-style, Soviet-style gun control, much to the chagrin of the sociopaths at the Joyce Foundation, Giffords, mentally-ill Shannon Watts, etc.
***
How about Nevada? Limited data, but let’s go for it.
Nevada (FBI 2020-21): Of the 274 known weapons, 74.45% (204) were a “Firearm.”
Nevada (FBI, 2020-21): Of the 299 known murder locations, 42.8% (128) were a “residence/home” & 43.47% (130) were “outside.”
Las Vegas (FBI, 2020-21): Of the 175 known murder locations, 42.28% (74) were a “residence/home” & 42.85% (75) were “outside.”
Las Vegas (FBI, 2020-21): Of the 167 known weapons to commit murder, 73.65% (123) were a “firearm.”
North Las Vegas (FBI, 2020-21): Of the 32 known murder locales, 9.37% (3) were a “residence/home” & 84.37% (27) were “outside.”
North Las Vegas (FBI, 2020-21): Of the 27 known murder weapons, 85.18% (23) were a “Firearm/gun.”
Henderson, NV (FBI, 2020-21): Of the 21 known murder locales, 66.66% (14) were a “residence/home” & 28.57% (6) were “outside.”
Henderson, NV (FBI, 2020-21): Of the 17 known murder weapons, 76.48% (13) were a “firearm.”
Reno, NV (FBI, 2020-21): Of the 33 known murder places, 48.48% (16) were a “residence/home” & 30.3% (10) were “outside.”
Reno, NV (FBI, 2020-21): Of the 32 known weapons to commit murder, 71.87% (23) were a “gun or firearm.”
Sparks, NV (FBI, 2020-21): Of the 11 known murder places, 45.45% (5) were a “residence/home” & 45.45% (5) were “outside.”
Sparks, NV (FBI, 2020-21): Of the 7 known murder weapons, 100% (7) were a “firearm.”
Let’s look at Nevada state data, shall we? https://nevadacrimestats.nv.gov/public/ https://nevadacrimestats.nv.gov/public/Browse/browsetables.aspx https://nevadacrimestats.nv.gov/tops/report/violent-crimes/nevada/2022 https://nevadacrimestats.nv.gov/public/View/dispview.aspx?ReportId=42
Nevada (State Data 2016-22): Of the 1,385 known weapons, 65.27% (904) were a “firearm.”
Clark & Washoe counties combined (State Data, 2016-22): Of the 1,272 known weapons, 66.66% were (848) a “firearm.” This actually mimics statewide data almost exactly, much to my surprise.
“NIBRS Number of Crimes by Hour of Day by Location Type” (I removed the “Incident Hour by Day” section, selected “Murder/nonnegligent manslaughter” & selected 2016-22 to make this work
Nevada (State Data, 2020-22): Of the 825 known murder locations, 30.78% (254) were a “residence/home” & 52.12% (430) were categorized as occurring “outside.”
Clark & Washoe counties (State Data, 2020-22): Of the 757 known murder locations, 29.98% (227) were a “residence/home” & 53.23% (403) were “outside.” That perfectly dovetails w/ state data.
***
Kentucky is another state the groomers like to screech about, let us look at FBI data (2017-21) from the Bluegrass State:
Kentucky (FBI, 2017-21): Of the 1,405 known murder locations, 54.59% (767) were a “residence/home” & 39.92% (561) were “outside.”
Kentucky (FBI, 2017-21): Of the 1,329 murder weapons, 79.9% (1,062) were a “firearm.”
Now for some of KY’s most violent & most Democrat-leaning (and/or “diverse”) areas.
Louisville (FBI, 2017-21): Of the 615 known murder locations, 39.34% (242) were a “residence/home” & 56.42% (347) were “outside.”
Louisville (FBI, 2017-21): Of the 573 known murder weapons, 90.4% (518) were a “firearm.”
Lexington (FBI, 2017-21): Of the 139 known murder locations, 47.48% (66) were a “residence/home” & 39.56% (55) were “outside.”
Lexington (FBI, 2017-21): Of the 136 known murder weapons, 85.29% (116) were a “firearm.”
Frankfort (FBI, 2017-21): Of the 17 known murder locations, 47.05% (8) were a “residence/home” & 47.05% (8) were also “outside.”
Frankfort (FBI, 2017-21): Of the 16 known weapons, 56.25% (9) were a “firearm.”
Bowling Green (FBI, 2017-21): Of the 27 known murder locales, 51.85% (14) were a “residence/home” & 33.33% (9) were “outside.”
Bowling Green (FBI, 2017-21): Of the 26 known murder weapons, 73.07% (19) were a “Firearm.”
Covington (FBI, 2017-21): Of the 12 known locations, 25% (3) were a “home/residence” & 66.66% (8) were “outside.”
Covington (FBI, 2017-21): Of the 12 known murder weapons, 83.33% (10), were a “Firearm.”
Hopkinsville (FBI, 2017-21): Of the 17 known murder locations, 58.82% (10) were a “residence/home” & 35.29% (6) were “outside.”
Hopkinsville (FBI, 2017-21): Of the 18 known murder weapons, 88.88% (16) were a “firearm/gun.”
Elizabethtown & Radcliff (FBI, 2017-21): Of the 23 known locations, 69.56% (16) were a “residence/home” & 26.08% (6) were “outside.”
Elizabethtown & Radcliff (FBI, 2017-21): Of the 24 known murder weapons, 66.66% (16) were a “firearm or gun.”
Paducah (FBI, 2017-21): Of the 9 known locations, 77.77% (7) were a “residence/home” & 11.11% (1) were “outside.”
Paducah (FBI, 2017-21): Of the 10 known weapons, 80% (8) were a “firearm/gun.”
As you can tell, KY has a lot of smaller communities w/ some murder issues, but in Lexington & Louisville you are more likely overall to be murdered w/ a gun & outside.
https://apps.legislature.ky.gov/law/statutes/statute.aspx?id=43450 Kentucky became “shall-issue” in 1996 (first full year was 1997), became “constitutional carry” in June 2019 & does not require a background check on private gun sales. So, they’re not complying w/ Democrat efforts to compile lists of gunowners so they know who to assault or murder in the dead of night when they try to fully implement Fascism in these United States. Bummer!
Can I argue that KY’s law was the reason the murder rate declined massively post-1997? The GroomerCrats will argue that we started throwing violent folks in jail for long periods of time (1994 crime bill, it probably played a role) & many of the problem children were aborted post-Roe, so they did not get a chance to murder as many folks as they can.
The national murder rate also likely declined a lot 1990 to about 2019 because so many states started allowing law-abiding folks to carry a concealed weapon to protect themselves from fatherless terrorists who would likely be marching w/ BLM had they not been confronted by a potential victim that was armed.
You’ll never see them admit allowing free, law-abiding folks the chance to defend themselves had anything to do w/ it, that is for sure.
***
How about South Carolina? I will supplement this w/ some state data & this is another state that the groomers & Obamaphiles screech about. However, most of the murder there is black on black & that is because of #whitesupremacy https://beyond2020.sled.sc.gov/tops/ https://beyond2020.sled.sc.gov/public/View/dispview.aspx?ReportId=1138 https://beyond2020.sled.sc.gov/public/View/dispview.aspx?ReportId=1117 https://cde.ucr.cjis.gov/LATEST/webapp/#/pages/explorer/crime/crime-trend
South Carolina (FBI, 2017-21): Of the 2,279 known murder locations, 60.28% (1,374) were a “residence/home” & 29.74% (678) were “outside.”
South Carolina (FBI, 2017-21): Of the 2,020 known murder weapons, 84.7% (1,711) were a “firearm/gun.”
Columbia, SC (FBI, 2017-21): Of the 96 known locales for murder, 65.62% (63) were inside a “residence/home” & 29.16% (28) were “outside.”
Columbia, SC (FBI, 2017-21): Of the 89 known weapons, 79.77% (71) were a “Firearm.”
Charleston & North Charleston (FBI, 2017-21, same Democrat-leaning county): Of the 217 known locations, (107) were a “residence/home” & 38.24% (83) were “outside.”
Charleston & North Charleston (FBI, 2017-21): Of the 196 known weapons, 89.79% (176) were a “firearm.”
Orangeburg County Sheriff’s Office & Orangeburg Police Dept. (FBI, 2017-21): Of the 86 known murder locales, 58.13% (50) were a “residence/home” & 33.72% (29) were “outside.”
Orangeburg County Sheriff’s Office & Orangeburg Police Dept. (FBI, 2017-21): Of the 68 known murder weapons, 92.64% (63) were a “firearm.”
Goose Creek & Berkeley County Sheriff's Office (FBI, 2017-21): Of the 62 known locations, 67.74% (42) were a “residence/home” & 27.41% (17) were “outside.”
Goose Creek & Berkeley County Sheriff's Office (FBI, 2017-21): Of the 56 known weapons, 83.92% (47) were a “Firearm/gun.”
Jasper County Sheriff’s Office, Hardeeville & Ridgeland (FBI, 2017-21): Of the 21 locales, 66.66% (14) were a “residence/home” & 28.57% (6) were “outside.”
Jasper County Sheriff’s Office, Hardeeville & Ridgeland (FBI, 2017-21): Of the 17 known weapons, 88.23% (15) were a “firearm/gun.”
Marion County Sheriff's Office & Mullins (FBI, 2017-21, I wanted to add Marion City & they had a tally for murders, but no NIBRS data oddly): Of the 22 known locations, 68.18% (15) were a “residence/home” & 13.63% (3) were “outside.”
Marion County Sheriff's Office & Mullins (FBI, 2017-21): Of the 19 known weapons, 89.47% (17) were a “firearm.”
Marlboro County Sheriff’s Office & Bennettsville Police Department (FBI, 2017-21): Of the 30 known locations, 50% (15) were a “residence/home” & 36.66% (11) were “outside.”
Marlboro County Sheriff’s Office & Bennettsville Police Department (FBI, 2017-21): Of the 27 known murder weapons, 81.48% (22) were a “firearm/gun.”
Greenville County Sheriff's Office & Greenville City (FBI, 2017-21): Of the 135 murder locations, 51.85% (70) were a “residence/home” & 34.07% (46) were “outside.”
Greenville County Sheriff's Office & Greenville City (FBI, 2017-21): Of the 139 known murder weapons, 81.29% (113) were a “firearm.”
Fairfield County Sheriff's Office (FBI, 2017-21): Of the 13 locales, 53.84% (7) were a “residence/home” & 46.15% (6) were “outside.”
Fairfield County Sheriff's Office (FBI, 2017-21): Of the 13 known murder weapons, 76.92% (10) were a “firearm.”
Horry County Police Department (NOT Sheriff’s Office), Conway, Myrtle Beach & North Myrtle Beach (FBI, 2017-21): Of the 130 known locations for murder, 41.53% (54) were “residence/home” & 38.46% (50) were “outside.”
Horry County Police Department (NOT Sheriff’s Office), Conway, Myrtle Beach & North Myrtle Beach (FBI, 2017-21): Of the 113 murder weapons, 84.95% (96) were a “firearm/gun.”
Aiken County Sheriff's Office, Aiken City & North Augusta (FBI, 2017-21): Of the 81 murder locations, 64.19% (52) were a “residence/home” & 34.56% (28) were “outside.”
Aiken County Sheriff's Office, Aiken City & North Augusta (FBI, 2017-21): Of the 67 murder weapons, 89.55% (60) were a “firearm.”
Let us now look at some state data from SC (state data, 2016-21) Allendale, Bamberg, Fairfield, Hampton, Lee, Marion, Marlboro, Orangeburg & Williamsburg. Of the 269 known weapons, 90.33% (243) were a “firearm.” That is disproportionate folks! Those are a slew of Black-Majority counties in SC & the skew heavily towards the Communists/Democrats. All those counties have massive murder issues, I wonder why?
How about Richand & Charleston counties (state data 2016-21) combined? Of the 564 known murder weapons, 86.52% (488) were a “firearm/gun.” That’s also a bit disproportionate. Those eleven counties are pulling the % of murders in SC w/ a firearm upwards. Capiche?
Now for SC statewide data (state data, 2016-21): Of the 2,732 known murder weapons, 83.71% (2,287) were a “firearm/gun.”
Let us look at SC state data (2016-21) pertaining to murder (murder/nonnegligent manslaughter) locations. Of the 2,703 (excl. “other/unknown”) KNOWN LOCATIONS, 54.97% (1,486) of them were a “residence/home” & 25.97% (702) were “outside.”
Now let us lump (State data 2016-21) Allendale, Bamberg, Fairfield, Hampton, Lee, Marion, Marlboro, Orangeburg, Williamsburg, Richland & Charleston counties together. Of the 839 KNOWN murder locations, 46.48% (390) were a “residence/home” & () were “outside.”
I did not finish the “outside” tally as the SC TOPS website was constantly giving me an “unable to connect” message. I would check back in a few hours, start tallying & it would crash again. There’s a web administrator somewhere that needs to get their act together!
That’s enough of the land of Gamecocks, let’s look at Georgia, eh?
***
Georgia (FBI, 2020-21 – they have not been contributing to NIBRS at a statewide level very long): Of the 1,254 known murder locales, 53.11% (666) were a “residence/home” & 31.49% (395) were “outside.”
Georgia (FBI, 2020-21): Of the 1,163 known murder weapons, 85.29% (992) were a “firearm/gun.”
Atlanta, Sandy Springs, Alpharetta, South Fulton & East Point: (FBI, 2020-21): Of the 296 murder locales, 45.94% (136) were a “residence/home” & 35.13% (104) were “outside.”
Atlanta, Sandy Springs, Alpharetta, South Fulton & East Point: (FBI, 2020-21): Of the 273 known weapons, 89.01% (243) were a “firearm/gun.” That’s a signal there – you are more likely to be murdered w/ a firearm & outside in Fulton County than Georgia en masse.
DeKalb County Police Department, Decatur City & Chamblee (FBI, 2020-21): Of the 227 known murder locations, 51.54% (117) were a “residence/home” & 27.72% (63) were “outside.”
DeKalb County Police Department, Decatur City & Chamblee (FBI, 2020-21): Of the 222 known murder weapons, 90.99% (202) were a “firearm.” You are far more likely in DeKalb County to be murdered w/ a firearm than GA en masse. Notice a trend yet?
Wanted to cover Gwinnett County & Chatham County, but a lack of reporting kiboshed that.
Cobb County Police Department, Marietta, Smyrna & Acworth (FBI, 2020-21): Of the 72 murder locations, 48.61% (35) were a “residence/home” & 36.11% (26) were “outside.”
Cobb County Police Department, Marietta, Smyrna & Acworth (FBI, 2020-21): Of the 60 known murder weapons, 85% (51) were a “firearm.”
Clayton County Police Department, Forest Park, Riverdale & College Park (FBI, 2020-21): Of the 77 known locations, 57.14% (44) were a “residence/home” & 24.67% (19) were “outside.”
Clayton County Police Department, Forest Park, Riverdale & College Park (FBI, 2020-21): Of the 74 known weapons, 91.89% (68) were a “Firearm.”
Bibb County Sheriff's Office (FBI, 2020-21): Of the 82 locations, 46.34% (38) were a “residence/home” & 32.92% (27) were “outside.”
Bibb County Sheriff's Office (FBI, 2020-21): Of the 78 weapons, 84.61% (66) were a “firearm.”
Dougherty County Police Department (FBI, 2020-21): Of the 3 known murder locations, (2) were a “residence/home” & 0% (0) were “outside.”
Dougherty County Police Department (FBI, 2020-21): Of the 3 known murder weapons, 100% (3) were a “firearm.”
Douglas County Sheriff's Office & Douglasville (FBI, 2020-21): Of the 28 known locations, 67.85% (19) were a “residence/home” & 28.57% (8) were “outside.”
Douglas County Sheriff's Office & Douglasville (FBI, 2020-21): Of the 19 known weapons, 73.68% (14) were a “firearm/gun.”
That’s enough of the Peach State, let us do Virginia now.
***
Virginia (FBI, 2017-21): Of the 2,374 known murder locations, 51.85% (1,231) were a “residence/home” & 39.89% (947) were “outside.”
Virginia (FBI, 2017-21): Of the 2,167 known murder weapons, 80.2% (1,738) were a “Firearm.”
Now for a slew of cities from VA, most of them uber-Dumocrat.
Richmond City, Roanoke City, Norfolk, Danville, Newport News, Petersburg, Hampton, Portsmouth & Fredericksburg (FBI, 2017-21): Of the 1,166 known murder locations, 41.93% (489) were a “residence/home” & 51.2% (597) were “outside.”
Richmond City, Roanoke City, Norfolk, Danville, Newport News, Petersburg, Hampton, Portsmouth & Fredericksburg (FBI, 2017-21): Of the 1,091 known weapons, 89.27% (974) were a “firearm.”
On both those counts (and in retrospect, I should have done this for other states, lumping numerous cities together & tallying them, but too late now. I will tally many of them at the end of this) you are much more likely to be murdered “outside” & w/ a firearm than in VA en masse. Democrat voters, the most violent people you know!
***
Oregon (FBI, 2017-21): Of the 571 known murder locations, 44.83% (256) were a “residence/home” & 48.16% (275) were “outside.”
Oregon (FBI, 2017-21): Of the 525 known weapons to commit murder, 65.71% (345) were a “firearm.”
Portland (FBI, 2017-21): Of the 210 known murder locations, 28.57% (60) were a “residence/home” & 65.23% (137) occurred “outside.”
Portland (FBI, 2017-21): Of the 191 known weapons to commit murder, 75.91% (145) were a “Firearm.” In Portland, you are *FAR MORE LIKELY* to be murdered w/ a gun & outside than across OR statewide. And outside Portland, the state of OR is very safe.
So, it’s not the gun that is the problem, it’s the drug-addled lunatics wielding them & they scoff at universal background checks (which will be used to compile lists of gunowners so the Fascists know who has them when they *attempt* to round them up).
https://www.oregon.gov/osp/Pages/Uniform-Crime-Reporting-Data.aspx I was going to look at OR state data, but when I looked back from 1/1/16 to 12/31/22 I noticed as I increased the date range, the number of murder victims was not changing, so I do not believe I can expand on what the FBI has. Glitch?
***
Let us look at Washington State (FBI, 2017-21): Of the 1,131 known murder weapons, 64.98% (735) were a “firearm/gun.”
Washington (FBI, 2017-21): Of the 1,220 known murder locations, 49.42% (603) were a “residence/home” & 41.8% (510) were “outside.”
Seattle, WA (FBI, 2017-21): Of the 165 known murder locations, 23.03% (38) were a “residence/home” & 67.27% (111) were “outside.”
Seattle, WA (FBI, 2017-21): Of the 162 known murder weapons, 67.9% (110) were a “firearm/gun.”
Tacoma (FBI, 2017-21): Of the 102 known murder locales, (33) were a “residence/home” & 59.8% (61) were “outside.”
Tacoma (FBI, 2017-21): Of the 85 known murder weapons, 72.94% (62) were a “firearm/gun.”
SeaTac (limited data, only 2019-21), Fife, Kent, Auburn, Des Moines & Tukwila (FBI 2017-21): Of the 97 known murder locations, 35.05% (34) were a “residence/home” & 50.51% (49) were “outside.”
SeaTac (limited data, only 2019-21), Fife, Kent, Auburn, Des Moines & Tukwila (FBI 2017-21): Of the 83 known murder weapons, 75.9% (63) were a “firearm.”
On all counts in those jurisdictions, you are far more likely to be murdered outside & w/ a firearm than WA statewide.
***
North Carolina, come on down.
North Carolina (FBI, 2019-21): Of the 2,219 known murder locations, 54.12% (1,201) were a “residence/home” & 35.28% (783) were “outside.”
North Carolina (FBI, 2019-21): Of the 1,949 known murder weapons, 82.24% (1,603) were a “firearm/gun.”
Raleigh, Wake County Sheriff’s Office, Durham City & Chapel Hill (FBI, 2019-21): Of the 204 known murder locations, 34.8% (71) were a “residence/home” & 50% (102) were “outside.”
Raleigh, Wake County Sheriff’s Office, Durham City & Chapel Hill (FBI, 2019-21): Of the 195 known murder weapons, 83.07% (162) were a “firearm.” No signal there on the firearms, it was basically a wash. But you are far more likely in those jurisdictions to be murdered outside.
Charlotte-Mecklenburg Police Department (FBI, 2019-21): Of the 306 known murder locales, 49.01% (150) were a “residence/home” & 32.02% (98) were “outside.”
Charlotte-Mecklenburg Police Department (FBI, 2019-21): Of the 294 known murder weapons, 89.11% (262) were a “firearm.”
Fayetteville & Cumberland County Sheriff's Office (FBI, 2019-21): Of the 109 known locations, 53.21% (58) were a “residence/home” & 34.86% (38) were “outside.”
Fayetteville & Cumberland County Sheriff's Office (FBI, 2019-21): Of the 105 weapons, 88.57% (93) were a “Firearm.”
Guilford County Sheriff's Office, Greensboro, High Point, Burlington & Archdale (FBI, 2019-21): Of the 241 murder locations, 43.98% (106) were a “residence/home” & 43.15% (104) were “outside.”
Guilford County Sheriff's Office, Greensboro, High Point, Burlington & Archdale (FBI, 2019-21): Of the 214 murder weapons, 86.44% (185) were a “firearm/gun.”
Cumberland County Sheriff's Office & Fayetteville (FBI, 2019-21): Of the 109 murder locales, 53.21% (58) were a “residence/home” & 34.86% (38) were “outside.”
Cumberland County Sheriff's Office & Fayetteville (FBI, 2019-21): Of the 105 known weapons, 88.57% (93) were a “firearm.”
Forsyth County Sheriff's Office & Winston-Salem (FBI, 2019-21): Of the 79 known locales, 50.63% (40) were a “residence/home” & 44.3% (35) were “outside.”
Forsyth County Sheriff's Office & Winston-Salem (FBI, 2019-21): Of the 80 weapons, 77.5% (62) were a “firearm/gun.”
Buncombe County Sheriff's Office & Asheville (FBI, 2019-21): Of the 31 known murder locations, 48.38% (15) were a “residence/home” & 38.7% (12) were “outside.”
Buncombe County Sheriff's Office & Asheville (FBI, 2019-21): Of the 28 known murder weapons, 75% (21) were a “firearm.”
New Hanover County Sheriff's Office & Wilmington (FBI, 2019-21): Of the 51 known locations for murder, 45.09% (23) were a “residence/home” & 52.94% (27) were “outside.”
New Hanover County Sheriff's Office & Wilmington (FBI, 2019-21): Of the 4
273
views
3
comments

Creepy Sam Seder, Democrat Voters & Universal Background Checks
Creepy old man Sam Seder thinks hood rats will say, "I better not purchase from the black market because a Democrat groomer is requiring me to submit to a background check." Or he knows this & wants to do the same things Lenin did & you cannot do that w/ an armed populace
***Relevant screenshots for this essay can be found here https://www.facebook.com/permalink.php?story_fbid=pfbid0v1pVhRSocVnTdq9zfoZQ5NTVZ4K47BHsW72rK3GmiP7bDuUepgaKkQ1GnsS6teUSl&id=100064869933577 https://www.facebook.com/permalink.php?story_fbid=pfbid0Sn6Ws4qvaq82MrArqMmt7HQXHGr5jeTGWuzBna83JRYEktbFcxhUmm9GgJSAPvdel&id=100004109170994 https://archive.ph/MsqSt ***
Below you will find a continuation of the TRANSCRIPT that was cut off @ https://rumble.com/v3li00z-black-hawk-county-iowa-supervisor-chris-schwartz-debunked-again-waterloo.html
********
New Hanover County Sheriff's Office & Wilmington (FBI, 2019-21): Of the 51 known locations for murder, 45.09% (23) were a “residence/home” & 52.94% (27) were “outside.”
New Hanover County Sheriff's Office & Wilmington (FBI, 2019-21): Of the 46 murder weapons, 76.08% (35) were a “firearm/gun.”
Edgecombe County Sheriff’s Office, Rocky Mount, Halifax County Sheriff’s Office (2020-21), Roanoke Rapids, Vance County Sheriff’s Office, Henderson, Hertford County Sheriff's Office, Ahoskie, Murfreesboro, Bertie County Sheriff's Office, Windsor & Warren County Sheriff's Office (FBI, 2019-21): Of the 159 known murder locations, 49.68% (79) were a “residence/home” & 40.88% (65) were “outside.”
Edgecombe County Sheriff’s Office, Rocky Mount, Halifax County Sheriff’s Office (2020-21), Roanoke Rapids, Vance County Sheriff’s Office, Henderson, Hertford County Sheriff's Office, Ahoskie, Murfreesboro, Bertie County Sheriff's Office, Windsor & Warren County Sheriff's Office (FBI, 2019-21): Of the 138 known murder weapons, 89.13% (123) were a “Firearm/gun.”
Those are several of NC’s majority Black counties, they all have sky-high murder rates & you are more likely there to be murdered “outside” & far more likely to be murdered w/ a gun than NC en masse. #whitesupremacy
***
Before I cover national data, let me select some Democrat-leaning jurisdictions (or diverse cities in tossup counties that keep the County Coroner busy) & see what their numbers are. Keep in mind, I will not cover certain cities as they do not have much data, I prefer at least 3 years & love having 5 years.
Oklahoma City, OK (FBI, 2019-21): Of the 187 known murder locations, 61.49% (115) were a “residence/home” & 28.34% (53) were “outside.”
Oklahoma City, OK (FBI, 2019-21): Of the 183 KNOWN murder weapons, 82.51% (151) were a “firearm/gun.”
Albuquerque & Bernalillo County Sheriff's Office, NM (FBI, 2018-21): Of the 360 known murder locations, 40.83% (147) were a “residence/home” & 47.77% (172) were “outside.”
Albuquerque & Bernalillo County Sheriff's Office, NM (FBI, 2018-21): Of the 330 known murder weapons, 74.84% (247) were a “firearm/gun.”
Las Cruces & Dona Ana County Sheriff's Office, NM (FBI, 2018-21, the latter only 2019-21): Of the 41 known murder locales, 56.09% (23) were a “residence/home” & 39.02% (16) were “outside.”
Las Cruces & Dona Ana County Sheriff's Office, NM (FBI, 2018-21): Of the 41 known murder weapons, 63.41% (26) were a “firearm/gun.”
Indianapolis, IN (FBI, 2019-21): Of the 536 known murder locales, 42.91% (230) were a “residence/home” & 48.13% (258) were “outside.”
Indianapolis, IN (FBI, 2019-21): Of the 473 known murder weapons, 88.58% (419) were a “firearm/gun.”
Bridgeport, CT (FBI, 2018-21): Of the 66 known murder locations, 19.69% (13) were a “residence/home” & 71.21% (47) were “outside.”
Bridgeport, CT (FBI, 2018-21): Of the 63 known murder weapons, 87.3% (55) were a “firearm/gun.”
New Haven, CT (FBI, 2017-21): Of the 76 known murder locations, 30.26% (23) were a “residence/home” & 65.78% (50) were “outside.”
New Haven, CT (FBI, 2017-21): Of the 71 known murder weapons, 88.73% (63) were a “firearm/gun.”
Springfield, MA (FBI, 2017-21): Of the 81 known murder locales, 28.39% (23) were a “residence/home” & 69.13% (56) were “outside.”
Springfield, MA (FBI, 2017-21): Of the 84 known murder weapons, 89.28% (75) were a “firearm/gun.”
Brockton, MA (FBI, 2017-21): Of the 33 known murder locations, 45.45% (15) were a “residence/home” & 36.36% (12) were “outside.”
Brockton, MA (FBI, 2017-21): Of the 33 known murder weapons, 72.72% (24) were a “firearm.”
That wraps up this section, I would love to cover more cities & states, but some states are lacking in data & even the ones that have 3 years or more of data, some of their problem areas aren’t reporting much, so that makes it a fruitless task.
Being able to get more of the (usually) Democrat-run, “diverse” war zones would give us an even better picture into how the Democrat Party is purposely creating chaos, letting lunatics run loose in the streets, all while demonizing gunowners.
All Fascist regimes end up murdering their populations & the Democrats cannot achieve their Fascism unless they disarm rural America. Fat, bi-polar, divorced groomers like Sam Seder still wouldn’t step up to the plate in that event, but the people he’s agitating to go out & assault & harass normal citizens won’t succeed if the police are still around & if the law-abiding populace is armed.
I still have a lot of data & it’ll tell us what most of us already know. Unless your name is Sam Seder #samseder #majorityreport & you’re having a fantasy involving your own daughter & Roman Polanski. https://rumble.com/vcj22f-face-bloat-stan-seder-i-mean-sam-seder-vs.-face-bloat-stan-seder.html
***
Now for NATIONAL FBI DATA & we’ll compare it to the worst of the worst above as best we can because there are differences in the lengths of the data unfortunately! One must also note that as more violent jurisdictions report this data, it will start to skew it more.
FBI National Data 2012-2021: Of the 60,145 KNOWN murder locations, 52.66% (31,676) were a “residence/home” & 38.37% (23,078) occurred “outside.”
FBI National Data 2012-2021: Of the 55,368 KNOWN murder weapons, 75.84% (41,994) were a “Firearm or gun.”
(previous data for even more years prior to this can be found at https://web.archive.org/web/20220616053835/https://professor_enigma.webs.com/black-lives-do-not-matter I did that old school, long before the current FBI interactive site was born. NOTE: From 2004-2018, 68.882% of all homicides were committed where a firearm did the dirty deed. About a third of the time, the assailant uses a knife, crowbar, some other object or personal weapons to commit the crime. They did not need a gun. In the same time frame, 5.154% of all homicides were committed w/a rifle or shotgun.)
FBI National Data 2017-2021: Of the 40,957 KNOWN murder locales, 50.81% (20,811) were a “residence/home” & 39.99% (16,382) were “outside.” *This is the time frame that will be my baseline for a collective comparison of many of the cities listed above*
FBI National Data 2017-2021: Of the 37,722 known murder weapons, 78.58% (29,642) were a “Firearm or gun.” *This is the time frame that will be my baseline for a collective comparison of many of the cities listed above*
FBI NATIONAL DATA 2017-2019: Of the 16,752 KNOWN murder locations, 54.44% (9,121) were a “residence/home” & 36.83% (6,170) were “outside.”
FBI NATIONAL DATA 2017-2019: Of the 15,397 KNOWN murder weapons, 74.25% (11,433) were a “firearm/gun.” You can see a big difference in that last two time frames, the murder rate was much higher 2020-21, many more folks (primarily blacks) were being murdered outside & with a firearm.
FBI NATIONAL DATA 2020-21 (George Floyd Democrat Voter Riots): Of the 24,205 KNOWN murder locales, 48.29% (11,690) were a “residence/home” & 42.18% (10,212) were “outside.”
FBI NATIONAL DATA 2020-21 (George Floyd Democrat Voter Riots): Of the 22,325 KNOWN murder weapons, 81.56% (18,209) were a “firearm/gun.”
As the Democrat Party & Black Lives Matter agitated their unemployed base to go out & murder people, burn businesses down & assault folks in the street, you can see the % of people murdered outside the safety of their home spiked 2020-21 relative to the 3 previous years, as well as people murdered w/ a gun.
The hood rats that vote for groomers like Sam Seder & Joe Biden have never cared about universal background checks & never will. They used the George Floyd riots as the perfect storm to wreak havoc & try to intimidate America into doing their bidding.
“Do what we want or we riot” says the fatherless BLM activist. But well-armed, law-abiding Rural Iowans would push back against him & this is why Sam Seder & his ilk want you disarmed. They want you & your family defenseless (don’t forget, treat all police as criminals so their funding can be cut & their ranks thinned) so they can be murdered by these miscreants. All Fascist dictators wind up murdering (or attempting to) those who refuse to go along, so Sam Seder needs to disarm America first. I will mention again, Sam Seder doesn’t have the testosterone to be heavy, he’s merely a snitch. Had he lived in 1960s East Germany, he would’ve been a snitch for the Stasi. Being a heavy requires testosterone.
Now, let us look at some more statewide state in uber-white, uber-Republican areas that have NIBRS data going back quite a while. The sociopaths in the Black Lives Matter/Democrat camp complain about guns a lot, but it’s their supporters usually wielding them illegally. They really don’t care about that as I’ve said, they simply want their opponents disarmed so they can gin-up their “I have nothing to lose base” to go out & commit gratuitous acts of violence. Basically, do what they want or they burn the town down, the citizens are disarmed & there aren’t enough cops to stop them.
http://www.gun-nuttery.com/rtc.php Idaho has been contributing to NIBRS for a long time & became “Shall-Issue” way back in 1990 (no permit required since 2016). This is another reason the U.S. murder rate began dropping like a rock in the mid-1990s. We started tossing violent lunatics in prison & throwing away the key. A huge number of states over the past few decades have enacted laws that make it easier for law-abiding folks to carry firearms & protect themselves from people who listen to the Sam Seder Show while sitting around smoking cigarettes in their taxpayer-funded apartment.
From 1985 to the present, Idaho’s murder rate has never even come close to the U.S. average & is usually under 3 per 100,000 even though there are guns aplenty there. If you try to rob someone, rape someone, carjack someone in Idaho you may be gambling w/ your life. Mentally-ill people like Shannon Watts or Stacey Abrams would like you to be unarmed so your kids can be assaulted and/or killed.
Idaho (FBI, 1992-2001): Of the 311 KNOWN murder locations, 66.88% (208) were a “residence/home” & 24.11% (75) were “outside.”
Idaho (FBI, 1992-2001): Of the 291 KNOWN murder weapons, 51.89% (151) were a “firearm/gun.”
NATIONAL FBI DATA 1992-2001: Of the 9,083 KNOWN murder locations, (5,371) were a “residence/home” & 28.64% (2,602) were “outside.”
NATIONAL FBI DATA 1992-2001: Of the 8,832 KNOWN murder weapons, 63.34% (5,595) were a “firearm.”
Idaho (FBI, 2017-21): Of the 165 known murder locations, 66.06% (109) were a “residence/home” & 23.03% (38) were “outside.”
Idaho (FBI, 2017-21): Of the 153 known murder weapons, 64.05% (98) were a “firearm/gun.”
As you can see, uber-white, gun-laden, no universal background checks Idaho has a much smaller % of murders committed w/ a firearm, relative to the national average & you are less likely to be murdered outside.
Montana is another state that would likely have “loose gun laws” (and see the link above & all its archived versions to read about these decisions) & enacted “shall-issue” in 1991. However, MT did not contribute heavily to NIBRS until 2005. Montana also lacks universal background checks that will result in lists of gun owners, so the Nazis know who has them & that’s bad according to… Nazis.
MT (FBI, 2005-2014): Of the 109 KNOWN murder locations, 65.13% (71) were a “residence/home” & 30.27% (33) were “outside.”
MT (FBI, 2005-2014): Of the 189 KNOWN murder weapons, 51.85% (98) were a “firearm.”
Montana (FBI, 2017-21): Of the 181 KNOWN murder locations, (118) were a “residence/home” & 24.3% (44) were “outside.”
Montana (FBI, 2017-21): Of the 163 KNOWN murder weapons, 47.85% (78) were a “firearm.”
FBI NATIONAL DATA 2005-14: 17,168 KNOWN murder locations, 57.92% (9,945) are a “residence/home” & 28.1% (4,825) were “outside.”
FBI NATIONAL DATA 2005-14: 30,703 KNOWN murder weapons, 67.62% (20,763) are a “firearm.” No signal on the murders outside (MT was slightly higher), but much more likely nationwide to be murdered w/ a firearm in MT. Perhaps it could be because would-be Democrat terrorists are met by an armed populace?
Sam Seder & his groomer ilk do not like an armed citizenry because they tend to push back against Nazis.
Iowa became “shall-issue” in 2011 (FBI, 2012-21, I already covered this nationally above, compare & discuss!): 670 known murder locales, 58.95% (395) are a “residence/home” & 31.04% (208) are “outside.”
Iowa (FBI, 2012-21): 614 KNOWN murder weapons, 61.07% (375) are a “Firearm/gun.” In both those cases, in the low-murder rate, plenty of guns Hawkeye State you are far less likely to be murdered outside & w/ a firearm than nationally. Is Iowa too, ummm “White” for you groomerCrats?
Utah became “shall-issue” in 1995 but did not begin contributing extensively to NIBRS until much later. UT has a murder rate that is typically much lower than the national rate. #blacklivesmatter
UTAH (FBI, 2005-14): 236 known murder locales, 65.25% (154) are a “residence/home” & 25.84% (61) were “outside.”
UTAH (FBI, 2005-14): 388 KNOWN murder weapons, 50.77% (197) are a “Firearm.” You are far less likely in uber-white, uber-safe, gun-toting UT to be murdered outside & w/ a firearm than nationally. Gee, I wonder why?
I would like to ask the Kiddie Groomers a question: If Utah had a “high murder rate”, but only say, 35% of murders were committed w/ a firearm, would that be bad or good, considering your obsession w/ guns?
If Utah’s % of murders w/ a firearm go up every year for the next decade, but their murder rate falls each of those years slightly, is that bad or good? Utah also shuns universal background checks & by golly, their murder rate is nothing like what we see in Democrat-run dungholes across this country.
West Virginia became “shall-issue” in 1989 but did not begin contributing extensively to NIBRS until much later. Unlike Iowa, they have seen massive fluctuations in their murder rate since 1985. https://web.archive.org/web/20220608034412/http://professor_enigma.webs.com/america-has-a-drug-problem Part of that might be their massive drug overdose death rate. Yes West Virginia, there is a massive drug problem in your state.
WV (FBI, 2000-2009. NO LOCATION data for this time frame): Of the 575 known murder weapons, 59.13% (340) were a “firearm/gun.”
FBI NATIONAL DATA 2000-2009: 23,677 KNOWN murder weapons, 65.75% (15,569) are a “firearm/gun.”
WV (became Constitutional Carry in 2016 – FBI 2017-21): Of the 454 KNOWN murder locations, 64.75% (294) were a “residence/home” & 27.31% (124) were “outside.”
WV (became Constitutional Carry in 2016 – FBI 2017-21): Of the 403 KNOWN murder weapons, 67.74% (273) were a “firearm/gun.” On both those metrics, WV was lower (lower % of murders w/ a gun & lower % of murders outside) than the national average.
West Virginia is another state that is naughty according to the Nazis, they do not have universal background checks.
https://web.archive.org/web/20080606170357/http://overlawyered.com/2006/03/licensed-handgun-carry-wins-in-kansas/ https://web.archive.org/web/20150404223230/https://m.cjonline.com/news/2015-04-01/gov-sam-brownback-sign-bill-allowing-unlicensed-conceal-carry Kansas became “shall-issue” in 2006 & “constitutional carry” in 2015 (FBI, 2007-2016): Of the 448 known murder locations, 68.52% (307) were a “residence/home” & 20.08% (90) were “outside.”
Kansas (FBI, 2007-16): Of the 619 KNOWN murder locales, 59.61% (369) were a “firearm/gun.”
NATIONAL DATA 2007-16: Of the 25,849 KNOWN murder locations, 57.03% (14,743) were a “residence/home” & 34.65% (8,958) were “outside.”
National Data 2007-16: Of the 32,805 KNOWN murder weapons, 68.56% (22,494) were a “firearm/gun.” On both counts, you are less likely in KS to be murdered w/ a firearm & less likely to be murdered outside than nationally. KS’ murder rate was much lower in that time frame than the US average. Is KS too white to be put in that contest Demoncrats? Too white & too many law-abiding rural folks carrying guns?
Kansas (FBI, 2017-21, This is their “constitutional carry” period): Of the 430 known murder locations, 60.69% (261) were a “residence/home” & 26.97% (116) were “outside.”
Kansas (FBI, 2017-21): Of the 394 known murder weapons, 70.81% (279) were a “firearm.” On both those counts, you are less likely to be murdered outside & w/ a firearm in KS than nationally. And remember that KS typically has a murder rate much lower than the national average. Hey Pedocrats, is KS too white? Maybe too full of guns to compare?
Let’s cover Ohio, shall we? (FBI 2005-14, OH became “shall-issue” in 2004): Of the 1,783 known murder locales, 54.29% (968) were a “residence/home” & 39.09% (697) were “outside.”
Ohio (FBI 2005-14): Of the 3,335 known murder weapons, 74.84% (2,496) were a “firearm/gun.” On those metrics, OH was actually worse than the national average & likely because of those diverse, Democrat-leaning jurisdictions where murder is common (Akron, Cleveland, Dayton, Toledo, etc. I covered OH & those jurisdictions from 2017-21 above).
https://web.archive.org/web/20150712002921/https://www.reuters.com/article/2015/07/08/us-usa-maine-guns-idUSKCN0PI2QX20150708
Maine (FBI, 2017-21) became “constitutional carry” in 2015 & it might be too darn white for Democrats, let us run the numbers anyways. We all know that after “constitutional carry” was passed in ME, the streets ran red. Wait, they didn’t. Maybe it’s because ME is largely rural, largely white & does not have inner-cities full of fatherless kids slaying each other on a daily basis.
Maine (FBI, 2017-21): Of the 50 known murder locations, 76% (38) were a “residence/home” & 16% (8) were “outside.”
Maine (FBI, 2017-21): Of the 46 known murder weapons, 60.86% (28) were a “firearm/gun.” ME’s murder rate is much lower than the national average & you are far, far less likely to be murdered w/ a firearm & have it occur “outside” than you are nationally.
https://crimestats.dos.nh.gov/public/Browse/browsetables.aspx How about New Hampshire? They were “shall-issue” before it was cool & have been “constitutional carry” since 2017. First, state data.
NH (State Data 2012-2021, “Murder, Weapon Type”): Of the 185 KNOWN murder weapons, 47.56% (88) were a “Firearm/gun.”
NH (State Data 2012-2021): Of the 194 KNOWN murder locales, 64.94% (126) were a “residence/home” & 25.25% (49) were “outside.”
NH (FBI, 2012-21): Of the 178 KNOWN murder locations, 71.91% (128) were a “residence/home” & 18.53% (33) were “outside.”
NH (FBI, 2012-21): Of the 167 KNOWN murder weapons, 49.7% (83) were a “firearm/gun.” In gun-laden, uber-white NH, you are far less likely (relative to the national avg.) to be murdered outside & w/ a firearm. State data jives well w/ FBI data, except the latter has a much higher % of murders taking place in a “residence.”
Maybe it’s not the guns, it’s the culture & the lunatics wielding them. Either Sam Seder is retarded (he is mentally-ill by his own admission, despite that he was handed a lot of white privilege from daddy) & thinks confiscating firearms from everyone means hood rats will no longer acquire black market firearms or maybe he’s Soviet sleazeball who realizes we can’t institute a Soviet-style government w/ all these gunowners around.
In NH & nationally, it’s harder for Soviets & fatherless BLM terrorists to murder “the sheep” when the sheep are armed. Sam Seder won’t do anything, he’s just a carnival-barker sitting on his fat ass doing nothing productive. He’s just trying to gin-up the pawns to try to intimidate rural gunowners into doing what they want.
https://data-openjustice.doj.ca.gov/sites/default/files/2023-06/Crime%20In%20CA%202022f.pdf https://www.gov.ca.gov/2022/06/02/fact-sheet-californias-gun-safety-policies-save-lives-provide-model-for-a-nation-seeking-solutions/ https://web.archive.org/web/20171218213928/https://openjustice.doj.ca.gov/downloads/pdfs/cd16.pdf https://web.archive.org/web/20111026042358/http://ag.ca.gov/cjsc/publications/candd/cd10/preface.pdf [Table 4 on all documents] Let’s take a gander at California & they have NOT been NIBRS friendly for long, so I will utilize state data exclusively.
From 2020-2022 of the 6,609 KNOWN murder weapons, 74.29% (4,910) were a “firearm.” From 2020-22, CA’s murder rate skyrocketed relative to the previous decade, remember that. Thanks BLM!
From 2011-2019 of the 15,824 KNOWN murder weapons, 70.53% (11,161) were a “Firearm.” Hells bells folks, California, the land of gun safety, a paragon of gun control saw their murder rate in the latter time frame spike & somehow, there was a much higher % of murders committed w/ a firearm.
From 2005-2010 of the 12,964 KNOWN murder weapons, 72.33% (9,378) were a “Firearm.” The murder rate for this time frame is close to the 2020-22 rate.
These morons are obsessed w/ gun deaths, so I ask again. If California’s murder rate shot up, but the % of firearm murders went down, would that be good? Hello? I wonder if they’ll figure out that scumbags NEVER obey universal background checks or any other nonsense employed by the Stasi to hamstring regular folks from defending themselves.
I know they’ll say California needs more gun laws; they just haven’t gone far enough. Just like when Socialism fails, it wasn’t real socialism, let us try again. The CA reports had no data on murder locations, but did for other crimes, which I am not interested in at this point.
A quick word on the “fact sheet” from Governor Newsom demonstrating that CA’s gun laws are uber-effective. They brag about “mass shootings” being lower in CA.
However, in the graph they supply (and their definition of “mass shooting” includes folks that are merely injured, NOT multiple fatalities) there are several states below CA that have what would be considered “loose gun laws” (ME, IA, ID, KS) & their murder rates are typically on the very low end. ME, KS & ID were also “constitutional carry” for that entire time frame. Yes, their logic is flawed.
There are a few states that have high murder rates (relative to the national average) below California in the graph (OK, KY), so I don’t think that tells us much. If you live in a state where mass shootings are much more common than in California, but the overall murder rate is much lower (and has been for some time, such as WI, WY, SD or MT) is that bad? Again, their logic is flawed.
They also mention CA’s murder rate falling dramatically from 1993-2017. That happened pretty much everywhere as many states moved to “shall-issue” & later “constitutional carry.” We also began in 1994 to lock up lunatics & throw the key away.
Assault weapon bans (whether it be CA’s or the one-size-fits-all Bill Clinton era ban) had virtually nothing to do w/ it. https://web.archive.org/web/20220608034411/https://professor_enigma.webs.com/sam-seder-ilhan-omar-racism3 https://rumble.com/vdvrgz-old-fart-rants-doesnt-know-what-an-assault-weapon-is.html
More people kill themselves w/ a gun than https://www.cdc.gov/violenceprevention/firearms/firearm-suicide-trends.html they kill other people, so do we restrict my ability to protect myself from mentally-ill people because someone might use a gun to kill themselves?
No, we should not. Let’s restrict the ownership of cars because people asphyxiate themselves or rope because people hang themselves. Pretending to care about people committing suicide (all while screeching like a banshee over a lack of third trimester abortions & brainwashing little boys into mutilating their genitals) isn’t a good enough reason to allow Leviathan to begin compiling gunowner lists.
I would cover Wyoming, but there’s a dearth of NIBRS data, too bad. I will further demonstrate that Newsom’s graph is silly. North Dakota & South Dakota (the latter having a lot more “mass shootings” than California) are very naughty. They are uber-white, uber-Republican states with “loose gun laws” & you’re all in danger.
https://cde.ucr.cjis.gov/LATEST/webapp/#/pages/explorer/crime/crime-trend North Dakota (FBI 2012-21): Of the 159 known murder locations, 66.03% (105) were a “residence/home” & 15.72% (25) were “outside.”
ND (FBI, 2012-21): Of the 154 KNOWN murder weapons, 45.45% (70) were a “firearm.”
South Dakota (FBI, 2012-2021): Of the 203 KNOWN murder locations, 62.06% (126) were a “residence/home” & 28.57% (58) were “outside.”
SD (FBI, 2012-21): Of the 184 KNOWN murder weapons, 41.3% (76) were a “firearm.”
On both of those counts, you are far less likely (Relative to the national avg.) to be murdered w/ a firearm & outside in the Dakotas.
***
I actually plan on wrapping this up. For the drove of cities that I listed above (and even some states), here are the ones (usually Democrat jurisdictions & usually “diverse”) that had 81% or more of their murders committed w/ a firearm. That is historically high & was likely the main driver to the spike in murders nationally 2020-21.
Chicago, Kansas City, St. Louis City, Jackson County (MO), St. Louis County (MO), Cleveland, Toledo, Dayton, Akron, Cincinnati, Columbus (OH), Milwaukee, Kenosha, Dallas, San Antonio, Austin, Houston (previous 4 lumped en masse), Memphis, Nashville, Brownsville, Chattanooga, Little Rock, North Little Rock, West Memphis, Helena-West Helena (AR), Jacksonville (AR), Pine Bluff, Jonesboro, Detroit, Flint, Grand Rapids, Pontiac, Lansing, Inkster, Kalamazoo, Saginaw, Highland Park, Jackson (MI), Wilmington (DE), Louisville, Lexington (KY), Covington (KY), Paducah, Charleston & North Charleston (including Charleston County), Orangeburg, Berkeley, Jasper, Marion, Marlboro, Greenville, Fairfield, Horry & Aiken Counties (all SC), Richmond City, Roanoke City, Norfolk, Danville, Newport News, Petersburg, Hampton, Portsmouth, Fredericksburg (previous 9 VA), Wake County (NC), Charlotte, Guilford County (NC), Cumberland County (NC), Edgecombe County, Rocky Mount, Halifax County, Roanoke Rapids, Vance County, Henderson, Hertford County, Ahoskie, Murfreesboro, Bertie County, Windsor & Warren County (previous 12 all NC), Oklahoma City, Indianapolis, Bridgeport & New Haven (CT) & Springfield (MA).
If FBI data were more plentiful, this list would be much, much larger.
Entire states that could be added to the list: Illinois, Missouri, Tennessee, Michigan, Delaware, South Carolina, Georgia (only 2 years of data) & North Carolina.
Minneapolis, St. Paul, North Las Vegas, Atlanta, Sandy Springs, Alpharetta, South Fulton, East Point, DeKalb County, Cobb County, Clayton County, & Bibb County (GA) could be added, but less than 3 years of data.
***
And now to close this. The bi-polar divorcee Sam Seder & the overweight Black Hawk County, Iowa Supervisor Chris Schwartz (among many others, such as Chuck Schumer, Hakeem Jeffries, #AOC ) want your firearms so you cannot defend yourself from the Black Lives Matter terrorists.
https://mises.org/wire/brief-history-repressive-regimes-and-their-gun-laws https://mises.org/library/gun-control-nazi-germany https://mises.org/library/nazi-gun-control https://mises.org/library/gun-control-third-reich-disarming-jews-and-enemies-state-stephen-p-halbrook https://mises.org/power-market/incrementalism-and-gun-control Most dictatorial regimes, like the Nazis, like Soviet Russia – engaged in efforts to strip the populace (Karl Marx is often cited as being pro-gun, but only to bring about a revolution for the collective, for “the workers”) of their firearms because dictatorships don’t fare well when the general public is able to defend themselves.
They also compiled lists, which is prohibited here, so they could murder, torture, imprison & harass their political opponents, much like the Democrat Party of today.
“However, well-meaning clauses in the [gun] laws were subsequently used to provide the government with complete control over gun ownership, creating registries of gun and ammunition ownership, which ultimately fell into the hands of the Nazis.”
Black Lives Matter & their terrorists don’t fare well when the general public has the ability to stop their rioting, especially if the (local) police are able to assist them.
The goal of the Democrats is either shoehorn some Executive Order into law that will curtail private ownership for normal folks & use that to compile lists or disarm you, if they can. If that does not work, their intention is to stack the Supreme Court w/ lunatics who will say, “You know what, that 2nd Amendment never really applied to ‘We The People’, so turn them in folks.”
If that doesn’t happen, they’re in a pickle & if it does, they’re in a pickle too, but the latter would be far more damaging to America (and maybe the Democrats, I don’t think they want to sign a new Treaty of Paris acknowledging defeat).
https://www.theepochtimes.com/opinion/the-biggest-killing-machine-in-human-history-5484667 All these collectivist regimes of yesteryear, once they disarmed the general public (aside from the elitists, who will always have security) then the killing began. The Founders realized this, which is why they want a free people armed. If you are disarmed, you are not free.
The Dumocrats fail to realize (or maybe they know this, but need us disarmed to institute Fascism) as I have documented over & over, the problem is not guns, it’s the fatherless HS dropouts on drugs that wield them.
Each state is different, some of them have massive murder issues overall, but those are confined to a few jurisdictions. Some of them, like Iowa – have a very low murder rate, but a few jurisdictions are struggling.
https://mises.org/wire/majority-virginia-homicides-come-only-two-metro-areas https://mises.org/wire/theres-no-such-thing-american-homicide-rate Ryan McMaken realizes this & has obviously read a lot of the same data I have.
This is why I have covered so many states in individual videos on my Rumble channel. Minnesota has a murder rate typically lower than the national average & a boatload of counties (as does Iowa) that have <2 murders a year. The problem areas are run by Democrats, Hennepin & Ramsey counties.
Missouri has a boatload of counties that have <2 murders each year. The problem areas are a few counties where Democrats get a lot of votes. Same goes for Virginia & Michigan. Tennessee is rather safe outside a few cities, Memphis & Nashville. Wisconsin is a safe state, so long as you stay out of Milwaukee County. New Jersey is uber-safe, outside of Camden City & Newark. Arkansas has numerous counties with <2 murders each year, but a few “diverse” cities (Pine Bluff, North Little Rock, Little Rock) make it spike. Georgia has a lot of counties that have <2 murders in a given year, but there are a handful of counties where most of the violence is taking place. Most of these places are “diverse” & vote Democrat. The biggest problem in IL is Cook County, the rest of the state, not so much. The list goes on & on.
“Given the very low homicide rates that prevail throughout most of the US, it is clear that enormous swaths of the US population are able to obtain, own, and use firearms freely without turning their cities and towns into war zones.”
I could not have said it better Ryan. Democrats, quit treating every county in Iowa, Idaho, Montana, Maine, New Hampshire, Wisconsin, the Dakotas, Nebraska like the lunatics in Baltimore, Detroit, Chicago, Milwaukee, Houston, Dallas, Memphis, St. Louis, New Orleans, Jackson (MS), Cleveland, Wilmington (DE), Philadelphia, Buffalo, Richmond, Portland, etc.
https://www.americas1stfreedom.org/content/murder-zones/ Gunowners in Iowa, Idaho, Montana, etc. are not the problem Democrats, your voters are & you are using that as an excuse to institute Nazi-style gun control. #notonmywatch
Read that article by Mark Chesnut, it covers data I have elucidated many times & also debunks (as I have) the so-called “Red State Murder Problem”, parroted by androgynous folks like Brian Tyler Cohen & his gaggle of underemployed lunch meat slicers.
https://rumble.com/v268b7a-divorcee-sam-seder-vs.-utubekookdetector-iowa-homicide.html https://rumble.com/v19hafa-brian-tyler-cohen-is-not-very-bright.html https://rumble.com/v1usbmw-divorcee-sam-seder-wont-conduct-this-analysis-of-michigan-election.html https://rumble.com/v1z2nk8-divorcee-sam-seder-wont-conduct-this-analysis-of-missouri-arkansas-election.html https://rumble.com/v27s610-divorcee-sam-seder-wont-undertake-this-analysis-of-minnesota-election.html https://rumble.com/v1u66vk-divorcee-sam-seder-wont-have-this-analysis-of-pennsylvania-senate-race.html
https://rumble.com/v1oh7ps-divorcee-sam-seder-just-in-case-he-talks-about-the-abrams-kemp-debate.html https://web.archive.org/web/20230801020040/https://professor_enigma.webs.com/covid-increase-homicides
***
https://www.thetrace.org/2023/06/background-check-buy-a-gun-america-map/ https://giffords.org/lawcenter/gun-laws/policy-areas/background-checks/universal-background-checks/#footnote_21_4119 Here’s some data on which states do & which states do & do not conduct “universal background checks” & the breadth of those checks, which will do nothing to deter hood rats hell-bent on destruction from purchasing handguns on the black market.
Last time I checked, meth was illegal as the day is long, yet we have people dropping dead & selling that all over this country.
https://personalliberty.com/atf-forgot-comply-policy-accidently-creating-gun-database/ Obama’s ATF was compiling gunowner lists
116
views

Latifah Faisal (Story County, Iowa Supervisor) & murders in Fort Dodge
Latifah Faisal (Story County, Iowa Supervisor) didn't comment on these Fort Dodge murders
Iowa’s answer to Bilbo Baggins & Story County, Iowa Supervisor Latifah Faisal likes to comment on ordeals far outside the state of Iowa (such as the George Floyd fiasco) but doesn’t say much about events in Iowa.
For example, I asked her some months ago https://rumble.com/vywcwl-latifah-faisal-knows-george-floyds-name-but-does-she-know-jose-david-lopezs.html if she knew Jose David Lopez’s name, the young man who was murdered by a carload of lunatics down in Des Moines. Latifah Faisal didn’t say anything about Kyle Rittenhouse either, but if he had been convicted, she likely would’ve. She is not very bright.
I had to do a lot of digging but found 3 instances in Story County, Iowa (and it’s not like this redneck, Podunk county has its events featured on the front page of the Washington Compost or even the Des Moines Red Star) where people either died or were seriously injured in confrontations w/ the police. I asked Latifah to comment on those confrontations w/ police, that happened in her county. I guess she’s only concerned w/ items that the MSM tells her to be concerned about, she is a Muppet indeed.
Latifah Faisal blocked me from her campaign account when I challenged her as to why she wanted illegal alien migrant camps in Ames https://rumble.com/vmrrcf-latifah-faisal-story-county-iowa-supervisor-blocked-me-when-i-challenged-he.html & eventually blocked me from her personal account because she is incapable of defending her views on…. Well, anything.
These murders aren’t in Story County, Iowa, but one of Iowa’s very few dangerous cities, https://rumble.com/v268b7a-divorcee-sam-seder-vs.-utubekookdetector-iowa-homicide.html https://web.archive.org/web/20230801020040/https://professor_enigma.webs.com/covid-increase-homicides https://rumble.com/v1tfb1c-chris-schwartz-black-hawk-county-iowa-supervisor-says-were-not-safe-anywher.html https://rumble.com/v3255lu-chris-schwartz-black-hawk-county-iowa-supervisor-debunked-again-we-arent-sa.html Fort Dodge. I wonder if Latifah Faisal is wringing her Vienna sausage fingers over these acts of violence in her state? Or does she only care when it’s outside Iowa & involved the police?
The most dangerous counties in Iowa (and pretty much across America) tend to be “diverse” & vote Democrat.
https://www.messengernews.net/news/local-news/2023/05/fatal-shooting-in-fort-dodge/ https://www.weareiowa.com/article/news/crime/fort-dodge-homicide-suspect-davonquae-pettigrew-arrested-davenport-iowa-police-updates/524-8e4d8f1e-f478-4303-9352-6f926a2f190c https://www.kcci.com/article/report-one-dead-in-shooting-fort-dodge/43776025 https://www.radioiowa.com/2023/03/31/police-searching-for-suspect-in-thursday-night-murder-in-fort-dodge/ https://www.radioiowa.com/2023/05/03/arrest-warrant-issued-for-teen-in-fatal-fort-dodge-shooting/ https://www.radioiowa.com/2023/07/06/man-sought-in-shooting-death-of-teen-in-fort-dodge/ https://www.radioiowa.com/2023/07/06/police-arrest-suspect-wanted-for-july-4th-murder-in-fort-dodge/ If my Internet Sleuth activities are correct, Fort Dodge has had 3 murders this year, which means they will likely win the Iowa Sweepstakes for the most dangerous city in the Hawkeye State, unless Waterloo has a surge in the fall, but don’t count that cesspool out, right Black Hawk County, Iowa Supervisor Chris Schwartz? #blacklivesmatter
Fort Dodge is not a very large city, so it need not have a lot of murders before its rate starts going through the stratosphere. Hey Latifah Faisal (Story County, Iowa Board of Supervisors), do the black lives that are murdering black lives in Fort Dodge matter or not?
https://icrime.dps.state.ia.us/CrimeInIowa/Report/ArrestDistribution From 2016-22 of the 18 people arrested in Fort Dodge for Murder, 66.66% (12) of them were Black. Fort Dodge is only about 6% Black. https://web.archive.org/web/20230000000000*/https://www.census.gov/quickfacts/fact/table/fortdodgecityiowa/PST045222
From 2016-22, https://icrime.dps.state.ia.us/CrimeInIowa/Report/CrimeTrends Fort Dodge had 13 murders, which almost 2 per year for you Dumocrats watching this.
https://icrime.dps.state.ia.us/CrimeInIowa/Report/CrimeDistributionReport Of those 13 murder victims in Fort Dodge, 53.84% (7) of them were Black.
Why aren’t you yammering endlessly & posting intelligence-insulting emoticons over that Latifah Faisal? Is it because it does not fit your narrative, just like that teenage shot at a high school in Des Moines? Were the assailants’ skin color in that event in Des Moines & the assailants in Fort Dodge not dark enough little fella?
Let’s look at Ames, Iowa, Latifah Faisal’s backyard. Keep in mind, Ames is only 3.1% Black https://www.census.gov/quickfacts/fact/table/amescityiowa/PST045222
https://icrime.dps.state.ia.us/CrimeInIowa/Report/CrimeDistributionReport Of the ten murder victims in the land of Cyclowns from 2016-22, three of them or 30% were Black.
https://icrime.dps.state.ia.us/CrimeInIowa/Report/ArrestDistribution Of the five arrestees in Ames for murder 2016-22, only one (20%) was Black. Not as disproportionate as Fort Dodge.
https://icrime.dps.state.ia.us/CrimeInIowa/Report/CrimeDistributionReport We’ve been here before, let us do it again. For the *entire state of Iowa* from 2016-2022, of the 420 murder victims where the race of the victim is known, 37.14% (156) of them were Black. Of the 494 offenders where we KNOW the race of the offender, 47.57% (235) of them were Black. That’s extremely disproportionate.
Now, why does Story County, Iowa Supervisor Latifah Faisal not talk about this? Is it because she’s an ignoramus that does not know much or is it because it does not fit her narrative?
Black folks have a great opportunity to succeed in lily-white Iowa, a place where you are safe, so long as you stay out of certain areas of Fort Dodge, Des Moines, Cedar Rapids, Davenport & Waterloo is a train wreck.
Yet, despite this safety, a segment of the population that is far less than 5% is committing almost half the murders & most of those murders are other black folks. You can call me racist, but you cannot call me wrong.
Latifah Faisal was bragging about attending a Black Lives Matter rally in Des Moines some years ago, I asked her if she cares about the black lives that grow up without a daddy. Latifah Faisal, are you concerned about “people of color” who grow up with no daddy in the home or do you shrink from making that point because it is counterproductive to your warped narrative and/or is it because you yourself have a difficult time cultivating a relationship that doesn’t go down in flames?
It's funny how people often criticize the shortcomings of others & their warped moral compass often excludes their own inequities. Isn’t that right Latifah?
Black Lives Matter has the ultimate goal of eradicating the police https://web.archive.org/web/20230000000000*/https://blacklivesmatter.com/defundthepolice/ or thinning their ranks to the point where they are ineffective. Latifah Faisal can sit on her duff in her ivory tower among the corn of Lilly-white Iowa, but if she lived in the hood in Minneapolis, Chicago or Baltimore, perhaps her outlook would change?
Latifah Faisal feigns concern for drug addicts & career criminals like George Floyd, but nary a peep when young Hispanic kids get shot up on school grounds by fatherless lunatics or primarily young black men murder other young black men in places like Waterloo & Fort Dodge.
That doesn’t fit her narrative. BTW, according to the FBI (and Iowa has been reporting NIBRS data for some time, this is great data) from 2012-2021, of the 755 murder offenders where we know the race of the assailant, 45.29% (342) of them were Black. Of the 677 victims where we know their race, 38.1% (258) of them were Black. Iowa was 4.1% Black in 2021.
https://cde.ucr.cjis.gov/LATEST/webapp/#/pages/explorer/crime/crime-trend Same FBI data, but for 2002-2011: Of the 550 murder offenders where the race is known, 33.09% (182) were Black. Of the 223 murder victims where the race is known, 18.38% (41) were Black. Iowa was only 2.9% Black in 2010.
If the government mismanages the Social Security so-called “Trust Fund” do we abolish that or reallocate that money? Uh, no. Democrats say, “Uh, that’s a safety net, we need to steal 12.4% of your income so we can reallocate that to folks who are on disability for mood disorders. We also need to steal your money so we can inflate the living hell out of it when you’re 70 & screw you over.”
So, how come so many Democrats & Black Lives Matter looked at the George Floyd fiasco & suddenly wanted to take all that money from police departments & give it to low-income house & other community slush funds?
Do you really think defunding the police in Philly, Chicago, Wilmington, Waterloo (Iowa), Detroit or Baltimore & reallocating that money to social workers, community centers & low-income housing will suddenly cause those dangerous “diverse” cities to become shining cities on a hill?
For every George Floyd who gets wronged by a police officer, there are hundreds of George Floyds that are snuffed out by other George Floyds & throw in a few dozen innocent bystanders who take a bullet in the brain while minding their own business.
This is a dangerous game folks & Latifah Faisal is on board w/ this. She ultimately wants to, if she gets her way – she & her ilk want to use funds for the police department & turn it into a social engineering slush fund.
BLM wants to disarm (especially) rural Americans & hamstring, if not eliminate the police department so the next time they riot, nobody can stop them.
If you do not believe me, look at the demographics of FBI murders from 2016-19 compared to 2020-21. https://rumble.com/v2s3mpk-charlie-kirk-subdues-blacklivesmatter-and-whitesupremacy.html Over 8 thousand extra black folks murdered, many of them for simply being in the wrong place at the wrong time. Look at what they’ve done to Philly, the Twin Cities, Chicago, Seattle, Portland & a host of cities across America.
This is what Latifah Faisal wants, even if she is not bright enough to convey that message. Keep in mind, Black Lives Matter also railed against the nuclear family, https://rumble.com/v2s3ci2-blacklivesmatter-sam-seder-and-the-rock-have-something-in-common.html which is much of the reason so many young black men are dysfunctional.
Think about that, they were poo-pooing nuclear households, which are very good for children. It’s as if they want a dysfunctional society, which I guess in their mind is easier to carry a strong-arm. That may work in drug-addled Portland, that might work in the hoods of Wilmington or Milwaukee, but it will not work & will not happen in Iowa.
Latifah Faisal & all her policies must be opposed, I urge Story County, Iowa voters to jettison this clown from office next year & replace her w/ someone who has held a real job in the private sector.
Mr. Chairman, I Yield Back!
Some of my previous responses to this Hobbit can be found here https://www.youtube.com/playlist?list=PLoA9J0G6s-6okgJo3_2AYSVjpEFgtYbYF https://rumble.com/user/UTubekookdetector?q=latifah%20faisal https://web.archive.org/web/20230830001619/https://professor_enigma.webs.com/latifah-faisal-story-county https://web.archive.org/web/20230830001607/https://professor_enigma.webs.com/steve-orourke-story-county
PS If a police officer in Fort Dodge had an altercation w/ a black person; the MSM determined that the police officer was wrong & the black person was harmed, Latifah Faisal would suddenly become concerned about violence in Fort Dodge. The same goes for Des Moines or anywhere else in Iowa, even though Blacks are very disproportionately perpetrators of murder in Iowa, as well as being victims.
She doesn’t care about truth, she only cares about pushing a narrative. Iowa maintains a very low murder rate relative to the national average, it has been this way as far back as I can get data. But, in Iowa black on black murder is far too common. Latifah Faisal says nothing about this, it does not help her #whitesupremacy #blacklivesmatter narrative.
If Iowa had a George Floyd style confrontation w/ the police, then she would likely start caring & use that event to push for defunding/thinning the ranks of the police.
She also likely favors gun control, but refused to answer my questions about it. That probably would not play well in Iowa & I doubt she knows enough about guns to even argue it, aside from “they’re scary & they can kill people.”
Reject this lunatic in 2024. #latifahfaisal #faisal4storycounty #faisal4story
*** BONUS: Sam Seder is a creepy old man https://rumble.com/vcj22f-face-bloat-stan-seder-i-mean-sam-seder-vs.-face-bloat-stan-seder.html Creepy old man Sam Seder debunked on "Republican Voter Suppression" https://rumble.com/v24tyd2-divorcee-sam-seder-debunked-on-republican-voter-suppression.html
366
views
1
comment

Tim Stinsen (Facebook Idiots on Parade)
Refuting Tim Stinsen https://www.facebook.com/profile.php?id=100094906419953 https://archive.ph/g01d2
He used to say he was from Minneapolis, Minnesota, I think he’s ashamed.
Here’s where he was posting https://www.facebook.com/TheMarieOakes/posts/pfbid02skK8nvgQKMMiEgRjGRppCv7SJvnHNrHg6tYGFbSmdv5Wj3Dm8KnWAn3hpVS11Tdhl?comment_id=1461947057940040&reply_comment_id=666210855435733¬if_id=1692882621179936¬if_t=comment_mention&ref=notif (Douglas M. Scalzo originated the thread)
I have the screenshots & challenged him https://www.facebook.com/permalink.php?story_fbid=pfbid0nCN1kgcxuxUuqSCJNmxAfX7iCsKAhQMYKGy1vegcWMUpwzYa4jHqvnmG97FJdWSxl&id=100004109170994
Archived screencaps of his refusal to debate, he lacks knowledge (all those screenshots are still up on my post where I challenged him as well) https://archive.ph/T6iHe https://archive.ph/jR6Ud https://archive.ph/CD06H https://archive.ph/IBf6v https://archive.ph/cxImg https://archive.ph/mYktc https://archive.ph/hjsZT https://archive.ph/j8IXC https://archive.ph/HLGc1 https://archive.ph/CUhCf (clicking “Open Image in new tab” will give you a better look too) I go to these extremes to keep these bottom-feeders from saying “I posted this & you deleted it” or “I said this & I won.” No, you did not.
I challenged him on his page, he continued posting memes
https://www.facebook.com/permalink.php?story_fbid=pfbid033bfW2UeBip5Eqp1v8eb2f6RuEz4qdh7GZrJ3B2BEjG87UHpEyRg6zY1kA2Y49mal&id=100094906419953
Tim Stinsen did not put up much of a fight, if this were a hypothetical UFC encounter, he would have stayed on the bus eating donuts. He’s from Minneapolis, so my condolences. He lives in a city that is deteriorating rapidly.
When you lack an education & you're a low IQ moron who is the smartest moron at the Blue Oyster Bar, all you do is post memes. Memes are funny, but they are not an argument.
Tim Stinsen, the board has received your concession & I graciously accept it
PS Brian Tyler Cohen's red state/blue state murder bile gets nuked https://rumble.com/v19hafa-brian-tyler-cohen-is-not-very-bright.html
182
views
3
comments

Election Deniers Wonkette vs Donald John Trump
Election Deniers Wonkette vs Donald John Trump
Don’t look now folks, the mouth-breathers at the “Wonkette” political rag are denying elections, having delusions of Russian Collusion grandeur, trying to intimidate the Electoral College into denying Donald Trump a victory, proclaiming that “Russia, which is Not A Ally, hacking our election in order to help its puppet win.” Yeah, they said that. Sound familiar?
https://www.wonkette.com/p/electoral-college-officially-as-dumb-as-typical-trump-supporter https://archive.ph/j3oUe
Should all the “Russia hacked the 2016 election” nutcases be brought into rural Idaho kangaroo courts & indicted for treason? https://rumble.com/v14jscv-gab-user-logiconly-gets-pwned-by-utubekookdetector.html [I debunked a user on Gab named “LogicOnly” on a number of items, one of them being “Russia used bots on Facebook”]
The Wonkette thinks they have a great point when they mention that Trump said in 2012 that the Electoral College was bad for democracy. It doesn’t mean much. Yes, we are NOT a democracy, Trump was wrong to say that & the Electoral College is very anti-democracy. Trump should know that & the fact that he did not also does NOT detract from his victory over washed-up pizza maker & warmonger Hillary Clinton.
Bad logic Wonkette, bad logic. E.G. Just because Donald Trump poo-pooed the Electoral College at one time & uses the word “democracy” does not detract from his victory. FDR declared that education was not a federal task, but only a state task. Does that mean Democrats will vote tomorrow to end the unconstitutional Federal Dept. of Education? https://www.youtube.com/watch?v=vsTPvxHKjPw
The Federal Dept. of Education is unconstitutional, whether FDR says it is or not, my point being FDR’s disagreements on that issue w/ the Demoncrat Party today would not sway them, just as Donald Trump’s apparent ignorance of America as a “democracy”, instead of a “constitutional Republic” & anger at the Electoral College does not taint his victory in 2016.
Other than that, the treasonous hacks at Wonkette were right & where are the indictments for people who called & read off pre-canned ham DNC rants to the Electoral College. Where are the indictments for those who wrote (in crayon) pre-canned ham DNC letters to the Electoral College telling them to stop Donald Trump. Fake electors? Where are the indictments for those who e-mailed DNC talking points to the Electoral College, telling them to select Hillary Clinton?
I guess Wonkette does believe in “faithless electors.”
Remember folks, when the Democrats cry about something, it’s usually because they did it first & are likely still doing it.
*** https://web.archive.org/web/20230000000000*/https://professor_enigma.webs.com/end-the-electoral-college https://rumble.com/v1isntx-david-miss-pakman-debunked-vol.-i.html Debunking the Wonkette’s “point” about Hillary Clinton’s “victory” in the popular vote.
*** Yes, the 2020 election was one of the most corrupt elections ever & I have the receipts https://web.archive.org/web/20230000000000*/https://professor_enigma.webs.com/democrat-election-fraud
188
views
1
comment

IconoclastTruthbearer (Facebook Idiots on Parade)
Refuting Facebook clown Iconoclast Truthbearer
This is where I ran into him & he posts a flurry of messages on a flurry of topics. He will spam memes & does a lot of “Google research”. That did not work w/ me https://www.facebook.com/TheMarieOakes/posts/pfbid0omDudtirH9FiNyyvobsdJZHdb1aRqQb5PuKNRxhrxsFAQJtXvmyUG7SXpygzMx38l Iconoclast Truthbearer https://www.facebook.com/permalink.php?story_fbid=pfbid02ywcV3XZRTM4QgTHJSwNJv5ZgCL9QaumR3enbuTAg6R1BUb1iiGVd6BpALTTRVZaNl&id=100094225292570&comment_id=311134224759886 He deleted my comments on that post & blocked me
Here is his account https://www.facebook.com/profile.php?id=100094225292570 https://archive.ph/https://www.facebook.com/people/IconoclastTruthbearer/100094225292570/
I responded to him several times on Marie’s page
I challenged him & tagged him on my own page, it did not take him long to block me. When I began challenging him on specific states & the counties within those states, their voting preferences & the demographics of murder, he turned tail & ran away. https://www.facebook.com/permalink.php?story_fbid=pfbid02VLPC6PsWjbspwNnb6G3PqRtv1P8AXtp4znMJaNfRjaVjiYZ4D15bE9RHtZWXxK2bl&id=100004109170994 https://archive.is/YRiXU
https://archive.is/mK7e8
https://archive.ph/hGhZi
This is why I challenged him https://www.facebook.com/permalink.php?story_fbid=pfbid0CZKmx2HFbLTZUxGc3LoNazvUbzSqqWHbUjEHF1oUPyNSjASaphr9f1zg5AtywUbNl&id=100094225292570 https://archive.ph/mHCB4 The most violent counties in America have loads of black on black murder & typically vote Democrat. The safest counties in America tend to be uber-White & uber-Republican. https://web.archive.org/web/20230000000000*/https://professor_enigma.webs.com/covid-increase-homicides You can autistically repeat “RACIST”, but you cannot call me wrong.
I reviewed him & I think this is ultimately what triggered the block https://www.facebook.com/permalink.php?story_fbid=pfbid0FsRcJWrpbSNzAVTBfWaVQvKp7t1EVAFRzL9z3AkJJNZYBTACE62kH5mQV9ayCNdKl&id=100064869933577
https://www.facebook.com/permalink.php?story_fbid=pfbid02x5wXAsTrYwwGuGyPxJpQVeaHLvKE1CLaTMhXrtrU4uc5gjxYkzW9rrAbeLAxq48jl&id=100094225292570 https://archive.ph/UxLjl He thinks “trans kids” can actually “change” their gender, they cannot. He wouldn’t even get out of a HS science class (unless it was a government school in Flint, they pass almost everyone there). He doesn’t believe biology is real. https://rumble.com/v36edqs-creep-sam-seder-and-mark-d.-lang-flunked-biology-anatomy-and-physiology.html Asking someone’s opinion about “transgender” folks is just as silly as asking their opinion about aliens from the planet Glarnak. They don’t exist.
Here is a prime example of why a LOT OF CHRISTIANS & certainly MOST ATHEISTS are confused about the Bible. https://www.facebook.com/permalink.php?story_fbid=pfbid0242wJMZDAYYF6fw3APVjxsa6B8SVNZ9cD21FiQuYbfQi9Mgjedaq3ac2h4z3ktDaxl&id=100094225292570 Iconclast tries to use this ignorance (and exposes his own) to refute the Bible, but he just exposes his own lack of knowledge. He says, “If you believe God helped you find your keys, but He allowed a child to be raped by a priest. Go to hell.” I believe this is one of the reasons Dan Barker became apostate & one of the reasons he was a pretty dumb person even when he was a preacher. I will let my friend James Patrick Holding handle this one.
See this https://www.tektonics.org/TK-B.php & scroll down to “Dan Barker.” The most important article https://www.tektonics.org/af/barkerd02.php was unfortunately NOT on that list. Holding ties Dan Barker’s confused theology (which is likely why he is now apostate) into some of Charles Stanley’s (yes, that Charles Stanley) confused theology. https://www.tektonics.org/qt/stanley2.php Here is the relevant passage [Parking Space Theology]:
[Begin Quote] The final issue for discussion will require me to again quote from our earlier article on Osteen, particularly for readers who have not seen that.
[Osteen’s] system too easily redefines problems out of existence. Thus in YBL [Your Best Life Now] (41-2) he gives the example of searching for a parking spot in a crowded lot. Osteen thanks God for a good space when he finds one, but what if you do not find one? Then, he says, "....you get out and walk, and with every step, you thank God that you are strong and healthy and have the ability to walk." And he explains further of a time when he didn't find a parking space close by (43):
"...God has my best interests at heart...He is working for my good. A delay may spare me from an accident. Or a delay may cause me to bump into somebody that needs to be encouraged, somebody that needs to see a smile."
There is good reason for this methodology to disturb us. Atheist Dan Barker, in his original book Losing Faith in Faith tells much the same story of his quests for parking spaces - even having used the same Scripture that Osteen does, Romans 8:28: "All things work together for good to them that love the Lord." Before long, the logical strain becomes apparent: What of the person whose delay in finding a space caused them to get into an accident? To be sure, we are counseled to always be thankful to God, and we should be. Nevertheless, if we persist in a vision of God as a micromanager to this extent, then inevitably, we are compelled to rationalization as Barker was, ending up as he did, driving in random directions under the prompting of an inner voice, and ending up in the middle of a vacant lot thinking it was a test of our faith.
I am not saying of course that God cannot by His power arrange for a good parking space! However, I do find it presumptuous to think that He does such things on the microscopic scale that Osteen envisions. To claim this is to leave the system open to rationalization at the crux point of failures. [end quote]
This is the type of silly rationalization (and that’s being generous) that led to Barker’s demise & Iconoclast Mouth-Breather is going down the same road. He doesn’t know much.
Dan Barker is an idiot, copying his arguments makes you a bigger idiot.
That’s it for now, I doubt I’ll check in on his page anytime soon, he doesn’t have much detailed material (his magnum opus was written on the back of a square of used toilet paper, w/ space to spare) & just tries to yell over everyone. Anyone can spam memes all day, it takes time to learn something.
He has a lot of time, why isn’t he learning? You know the answer to that. So, if you see him on Facebook, perhaps ask him what I asked him (and if you try to corner him on an issue in a detailed fashion, you will likely be blocked quickly): “Why are the most violent counties in America full of black-on-black murder & usually vote overwhelmingly for Democrats? Why do states w/ high murder rates – whether they are GOP-dominated or GOP-leaning (MO, AR, TN), purple (MI) or Democrat-leaning (DE, IL) – why are the most violent counties typically Democrat & have very disproportionate amounts of black on black murder? Why do low murder rate states (IA, WI, MN) also have this same issue?” https://rumble.com/v137ctu-is-black-on-black-homicide-is-a-myth.html https://rumble.com/v2s3mpk-charlie-kirk-subdues-blacklivesmatter-and-whitesupremacy.html https://web.archive.org/web/20230000000000*/https://professor_enigma.webs.com/covid-increase-homicides (not sure how much longer the latter link will still be live, so showing an archived version)
Watch him block you when his “google research” does not deter you. What he aims to do is throw a bunch of links at you & you’re supposed to give up at that point. I didn’t do that & the result was predictable.
Anytime he wants to unblock me & come over to my channel again – we will debate this & I will be the lawnmower. Period!
PS I was told by another user that Iconoclast Truthbearer was hawking the COVID-19 “vaccines” & predictably coming out w/ stories of numerous “people they know” who died after refusing the COVID-19 “vaccines.” “Objection your Honor! Argument is hearsay! Objection Sustained!”
No little man, the COVID-19 “vaccines” were basically a big fail & I have the receipts. These are all my videos, unlike you I do not do Google “research” https://rumble.com/v2s125y-the-covid-19-vaccines-are-going-to-save-us-maybe-not-really-part-v.html https://rumble.com/vra04h-the-covid-19-vaccines-will-save-us-maybe-not-really.html https://rumble.com/vwvczy-the-covid-19-vaccines-are-going-to-save-us-maybe-not-really-part-iii.html https://rumble.com/vuf6u0-the-covid-19-vaccines-are-going-to-save-us-maybe-not-really-part-ii.html https://rumble.com/v1g5lw5-the-covid-19-vaccines-are-going-to-save-us-maybe-not-really-part-iv.html https://rumble.com/vp8g4f-stephen-colbert-is-dumber-than-sam-seder-covid-19-case-rates-and-vaccinatio.html https://rumble.com/vr360z-stephen-colbert-is-fake-news-covid-19-vaccination-rates-and-cases-per-week.html
https://web.archive.org/web/20230000000000*/https://professor_enigma.webs.com/facebook-idiots-on-parade
98
views
2
comments

Election Denier Fani Willis vs. Donald John Trump
Will Fani Willis indict Georgia’s answer to Jabba The Hut – Stacey Abrams? Will Fani Willis indict herself for being an election denier, for questioning elections? Hello?
The relevant material
https://www.frontpagemag.com/fani-willis-who-indicted-trump-for-questioning-election-tweets-questioned-election-in-tweets/
https://twitter.com/bennyjohnson/status/1694811429101035530
Other items for your perusal
https://rumble.com/v35f4z4-donald-trump-vs-election-deniers-hillary-clinton-obama-nancy-pelosi-kamala-.html
https://rumble.com/v2nux2c-election-deniers-cnn-and-divorcee-sam-seder-get-wrecked-by-donald-trump-vot.html https://rumble.com/v2sc8kw-election-denier-sam-seder-vs-scott-walker.html https://rumble.com/v2slknk-election-denier-jen-psaki-vs-chris-sununu.html https://rumble.com/v2lxv0y-election-denier-sam-seder-vs-rudy-giuliani.html https://rumble.com/v1ou9vw-kari-lake-decimates-the-democrat-media-on-the-big-lie.html https://rumble.com/vhmkzl-latifah-faisal-vs.-utubekookdetector-stopthesteal-and-capitol-insurrection.html
Creepy bipolar divorcee Sam Seder #samseder #majorityreport debunked on "Republican Voter Suppression" aka being an election denier https://rumble.com/v24tyd2-divorcee-sam-seder-debunked-on-republican-voter-suppression.html
122
views
1
comment

Mark D. Langdon (Facebook Idiots on Parade)
Mark D. Langdon (Facebook Idiots on Parade)
Mark's account if you want to ask him why the most violent counties in America typically vote Demoncrat & have lots of black on black murder https://www.facebook.com/profile.php?id=1598664829 archived https://archive.is/3N7Tn https://archive.is/3N7Tn/907393157c36591217334a364cf474429d8343cc.jpg http://web.archive.org/web/20230821022117/https://scontent.fdsm1-1.fna.fbcdn.net/v/t39.30808-6/368678090_698627278976264_1514128868142806956_n.jpg?_nc_cat=106&ccb=1-7&_nc_sid=730e14&_nc_ohc=0PxbL_YTK-UAX_qQmfO&_nc_ht=scontent.fdsm1-1.fna&oh=00_AfDmwN_IfKJb6k8YlI1-udS1hHFWt9NpRYLuMZYWKHiNAw&oe=64E782BA
He made some changes to his page https://archive.ph/WOtxh https://archive.ph/WOtxh/b48a2629d7e510f602c9f4e0a4cf3d9e95f2edd2.jpg https://web.archive.org/web/20230821231157/https://scontent.fdsm1-1.fna.fbcdn.net/v/t39.30808-6/368930463_699129042259421_5289990477683026137_n.jpg?_nc_cat=108&ccb=1-7&_nc_sid=dbeb18&_nc_ohc=3p1aADy-LScAX-tIeZJ&_nc_ht=scontent.fdsm1-1.fna&oh=00_AfBiE20nUUK8iorvplVGzwgtdJXJitZScodYds3g0gqzPA&oe=64E812D9
I challenged him publicly https://www.facebook.com/permalink.php?story_fbid=pfbid02YJ4PFaUd6TigVBnRswgn4qy8x5eL1sTAQZW3h42Hu6T7QNy4uvSWs344ZbokejG4l&id=100004109170994 https://www.facebook.com/permalink.php?story_fbid=pfbid0MpJirBv5zFNtDLWuyaGTz2ioatVwn7D5MKfDo5PHvKhwUhP7cnV1Rr3FwDJDG193l&id=100064869933577 and privately
Ran into a moron named Mark D. Langdon on Facebook, he had been checking my profile over there constantly, so I decided to ask him about it. I decided to challenge him & he immediately blocked me.
What’s the matter Mark D. Langdon, you lack a proper education & cannot defend your inane views?
https://web.archive.org/web/20230000000000*/https://professor_enigma.webs.com/facebook-idiots-on-parade
***
BONUS: Sam Seder supporter MDL61 gets PWNED https://rumble.com/v2bv0gy-sam-seder-supporter-mdl61-gets-pwned.html https://rumble.com/v2lnxy8-sam-seder-supporter-mdl61-gets-pwned-again.html (wink wink)
215
views
5
comments