
Election Denier Sam Seder vs Rudy Giuliani
Election Denier Sam Seder vs Rudy Giuliani
Recently, Divorcee & Election Denier Sam Seder was whining about Rudy Giuliani employing “trickery” in the form of telling illegal aliens & legal resident aliens that were not official, legal U.S. citizens that they would be required to show proof of citizenship before voting.
Is the divorcee Sam Seder engaging in election denialism? His party is full of election deniers – such luminaries as Maxine “make a crowd around Trump Cabinet members when you see them” Waters, Reverend “Love Child” Jesse Jackson & his mentally ill son, Barack “It’s clear not every vote was counted in 2004” Obama, Robert “Sheets” Byrd, Barbara Boxer, Hillary “Russia Hacked the Vote” Clinton, the overweight, Looking Like the Crypt Keeper Stephanie Tubbs Jones, “Ferret Face” Jamie Raskin, Sheila Jackson Lee, Cynthia McKinney, John Conyers (who wanted an FBI investigation), Eddie Bernice Johnson, “The Swimmer” Ted Kennedy who drove off a bridge in 1969 resulting in the death of Mary Jo, Elijah Cummings & many others. Uh-oh, the divorcee Sam Seder is perpetuating The Big Lie!
All that has been catalogued here https://rumble.com/v1ou9vw-kari-lake-decimates-the-democrat-media-on-the-big-lie.html
What if Rudy Giuliani said, “I don’t regret that at all, they can call it what they want, Dinkins didn’t win did he?” You may remember “Dingy” Harry Reid saying that after admitting he lied about Mitt Romney’s tax returns on the Senate floor during the 2012 Presidential campaign.
When the divorcee Sam Seder whines about people showing proof of citizenship or an ID, he tips his hand as a vote fraudster. Why do you think Ohio had to go all the way to the SCOTUS for the right to clean their voter rolls? If you fail to vote in 3 federal elections, you are removed from the voter rolls.
The Democrats do not want voter roll maintenance done, this way if they can mail out ballots to every registered voter willy-nilly, they have a pool of inactive voters to utilize for fraud in the event of a close election.
http://freewebs.com/professor_enigma/democrat-vote-fraud Why do you think Democrats like Keith Ellison sponsored legislation that would have allowed anyone to walk into any precinct & cast a ballot sans identification that would not be provisional. Because he wants fraud to be easy.
Why do you think Republicans in Iowa had to go to court to fight for a Photo ID requirement? Because the Democrats want fraud in the event of a close election. Voter fraud in many cases does not have to be widespread, many races would require only one in one-thousand votes to be fictitious to sway an election.
The divorcee Sam Seder has tipped his hand. Iowa has a Photo ID requirement, but if you DO NOT have your ID (and I am working to change that) you have to sign a sworn affidavit that you are who you say you are & if you’re found guilty of false information you can be charged w/ a felony.
I want a Photo ID required or your ballot is provisional & you have the Tuesday after the election to provide the relevant information to your County Auditor.
Is Sam Seder engaging in the Big Lie, is the old man an election denier? Sounds like it, the pot & the kettle have now tendered their resignations.
Here’s some sobering information courtesy of New York City Department of Investigation 2013 Report on the New York City Board of Elections’ Employment Practices, Operations, and Election Administration
[Begin Report Quote] ***[Progressives] who oppose efforts to prevent voter fraud claim that there is no fraud - or at least not any that involves voting in person at the polls. But New York City's watchdog Department of Investigations [see p. 12-24 here] has just provided the latest evidence of how easy it is to commit voter fraud that is almost undetectable. DOI undercover agents showed up at 63 polling places last fall and pretended to be voters who should have been turned away by election officials; the agents assumed the names of individuals who had died or moved out of town, or who were sitting in jail. In 61 instances, or 97 percent of the time, the testers were allowed to vote. Those who did vote cast only a write-in vote for a "John Test" so as to not affect the outcome of any contest. DOI published its findings two weeks ago in a searing 70-page report accusing the city's Board of Elections of incompetence, waste, nepotism, and lax procedures...
You'd think more media outlets would have been interested, because the sloppiness revealed in the DOI report is mind-boggling. Young undercover agents were able to vote using the names of people three times their age, people who in fact were dead. In one example, a 24-year female agent gave the name of someone who had died in 2012 at age 87; the workers at the Manhattan polling site gave her a ballot, no questions asked. Even the two cases where poll workers turned away an investigator raise eyebrows. In the first case, a poll worker on Staten Island walked outside with the undercover investigator who had just been refused a ballot; the "voter" was advised to go to the polling place near where he used to live and "play dumb" in order to vote. In the second case, the investigator was stopped from voting only because the felon whose name he was using was the son of the election official at the polling place.
Here are some highlights, er, lowlights from the DOI report:
DOI also found that the BOE’s Personnel Guidelines do not advise employees about their whistleblower protection rights. The New York City Whistleblower Law protects employees of City agencies, including the BOE, from retaliation for reporting to DOI or to a member of the City Council, the Public Advocate or the Comptroller, each of whom must refer the complaints to DOI, conduct that employees reasonably believe involve corruption, criminal activity, conflicts of interest, gross mismanagement or abuse of authority…
DOI interviewed a former BOE employee who reported that the BOE maintains active voter registrations for people who are not eligible to vote, including deceased individuals, felons, and nonresidents of New York City, and duplicate registrations for some voters. The former employee also stated that people easily could vote as ineligible voters remaining on the rolls because those individuals would appear in the registration books on Election Day and poll workers do not scrutinize the signatures of voters to determine that they that are similar to the pre-printed digitized signatures in the poll book. In light of these statements, DOI sought to test whether ineligible individuals are present on the voter rolls. Thus, using various database searches, DOI identified 176 individuals who at one time were registered voters in New York City: 86 deceased persons, 42 incarcerated felons, and 48 former City residents. During DOI’s Citywide 2013 Election Day investigative operations, DOI sought to determine whether any of them remained in BOE’s registration books and to test whether investigators using the names of those ineligible individuals would be permitted to vote. In sum, DOI investigators found that 63 out of 176 (36%) of the ineligible individuals were still listed as eligible voters in the registration books at poll sites. The majority of those 63 ineligible individuals remained on the rolls nearly two years, and some as long as four years, since a death, felony conviction, or move outside of New York City.
In total, DOI investigators were able to “cast a vote” as 61 of the 63 (97%) ineligible voters who were listed in the registration books – 39 deceased persons, 14 felons, and 8 nonresidents – although no vote was cast for any actual candidate. In lieu of voting for any actual candidate, investigators cast a vote for a fictitious candidate named “John Test.” During the September 2013 primary and October 2013 runoff elections using lever voting machines, investigators signed the registration book as the ineligible individuals, entered the lever voting machine, and cast a vote either by doing a write-in vote for “John Test” or gaining access to the lever machine without doing a write-in vote. During the November 2013 general election using electronic scanner machines, investigators signed the registration books as the ineligible individuals and then cast a vote by doing a write-in vote for “John Test” in the Mayor’s race and scanning the paper ballot through the scanner.
In the 61 out of 63 instances when the ineligible individuals were in the registration books, DOI investigators reported that poll workers did not meaningfully review the signatures provided by investigators for similarity with the pre-printed signatures in the registration books. DOI investigators also found that poll workers did not check the dates of birth listed in the registration books as they were required to do…
In five instances, DOI investigators in their twenties and thirties posed as individuals whose ages as recorded in the registration books, ranged from 82 to 92, and despite the obvious disparity, the investigators were given ballots or access to lever booths without question by the BOE poll workers…
DOI identified 86 deceased individuals who at one time were registered voters. During DOI’s Citywide Election Day investigative operations, DOI investigators went to poll sites where the deceased individuals would have voted based on their previous home addresses. DOI investigators found that 39 of the 86 deceased individuals were listed in the registration books. The majority of the 39 deceased individuals who were listed in the registration books died before January 2012. In all 39 instances, DOI investigators were able to cast a vote as the deceased persons who were listed in the registration books. DOI investigators cast those 39 votes as deceased individuals in all five Boroughs including 11 votes in Manhattan, 7 votes in Brooklyn, 7 votes in Queens, 9 votes in the Bronx, and 5 votes in Staten Island…*** [End Report Quote]
Now that we have that out of the way, I’ve challenged the divorcee Sam Seder numerous times to a debate on why the most violent jurisdictions in America have loads of black on black murder & they tend to vote Democrat. For every cop that shoots a black person, whether it is justified or not, I have a truckload of young black males slain by other young black males. http://freewebs.com/professor_enigma/sam-seder-ilhan-omar-racism3
The divorcee has continued to run away from this & if I challenge him, he is required to answer immediately or he forfeits. I’ve had a number of his autistics (probably offended someone there) tell me to call into his little internet show & joust w/ him on this.
Do they really think I can cover that several hundred plus pages of data I have in a 20-minute phone call w/ the bi-polaroid, when I have a real job & no time to listen to internet shows?
I’ve informed them to tell the divorcee to dedicate tomorrow’s show attempting to refute my data & I will respond in kind. I’ve yet to see this challenge met, apparently Sam has conceded. Why are his voters so violent & so mentally ill.
The most dangerous adversary to a young black male is not the police, not a Confederate Flag-Waving Redneck, not a white militia member – but other young black males & I have the data to prove it.
It’s not trickery, it’s not sorcery, it’s not ambiguous – it’s the real deal & I didn’t set on my laptop during the break of an obscure internet show named after an obscure show on a failed network like Err America.
I collated it myself & nobody “googled some facts” during the break & fed me talking points.
Sam Seder has privately acknowledged this, but he’s going to say it publicly, period.
https://spectator.org/harry-reid-i-lied-about-romney-but-he-didnt-win-did-he/ Harry Reid admits he lied about Mitt Romney’s tax returns & says, “I don’t regret that at all… They can call it whatever they want, Romney didn’t win did he.”
One last thing old man, did Joe Biden ever engage in election trickery where fat women from out of state were stuffing ballots in drop boxes in Georgia at 3AM w/ rubber gloves on? Just wondering. http://freewebs.com/professor_enigma/democrat-election-fraud
I debunked the creep Sam Seder #samseder #majorityreport on so-called “Republican Voter Suppression” https://rumble.com/v24tyd2-divorcee-sam-seder-debunked-on-republican-voter-suppression.html
Sam Seder is afraid to debate James Patrick Holding #samsederwontdebateJPH on The Impossible Faith. https://tektonics.org/lp/nowayjose.php Methinks the divorcee lacks confidence in that religion degree from a diploma mill
432
views
Creepy Sam Seder & Dylan Mulvaney EMBARRASSED by James O'Keefe
Dylan Mulvaney was recently confronted by the incomparable James O'Keefe & seemed as uncomfortable as women feel when "females" that have a penis enter their locker room.
If Dylan Mulvaney *attempts* to enter the women's rest room in Iowa, he will be arrested.
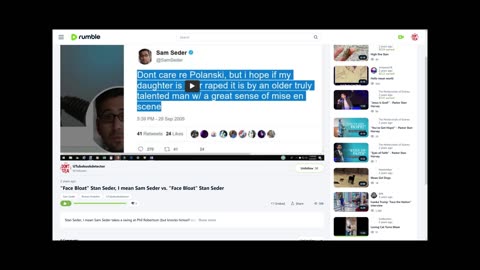
Sam Seder #samseder #majorityreport is likely angry at this, but he would get arrested to (this is contingent upon him *attempting* this) if he tried it. Would Sam Seder like it if Roman Polanski was wandering around his daughter's locker room?
No wonder his wife left him. YIKES!
https://okeefemediagroup.com/ <<< If you want to support James O'Keefe
35
views

Sam Seder supporter MDL61 gets PWNED again!
Sam Seder supporter MDL61 gets PWNED again!
His comment https://rumble.com/v28rvib-mrlive-the-2023-state-of-the-union-and-analysis-2723.html#comment-208388660
My rebuttal https://rumble.com/v28rvib-mrlive-the-2023-state-of-the-union-and-analysis-2723.html#comment-211550952
Informing him he needs to put up or shut up on my challenge https://rumble.com/v28rvib-mrlive-the-2023-state-of-the-union-and-analysis-2723.html#comment-223678332
Apparently, this guy has thrown in the towel, his silence speaks volumes https://rumble.com/v28rvib-mrlive-the-2023-state-of-the-union-and-analysis-2723.html#comment-224147268
All these comments are archived, just in case he deletes them later. Just plug any of the above links into either of the two following & you will see the relevant comments. These are the comments for this video, but feel free to peruse all the comments on that video as they are archived as well 😉 https://web.archive.org/ https://archive.ph/
This concludes my second & final tussle w/ a social media vegetable named MDL61, a very vacuous supporter of the divorcee Sam Seder. Since he called me a “racist” for suggesting that Asians were defeating Blacks in government schools, I challenged the old man to find for me as many government school districts (and you cannot use a school that has 10 Black students & 6 Asian students from a majority white District, your sample has to be much bigger, I informed him of that) that he could where Asians were being outperformed by Blacks in graduation rates (use a 3-year block of data too, so we can avoid outliers) and/or reading & math comprehension.
I found a scant few where Whites were defeating Asians, http://freewebs.com/professor_enigma/sam-seder-ilhan-omar-racism3 but not many. Asian men are out-earning every other demographic in America, despite being a helpless minority. It must be their culture.
If you have a father in the home, a good male role model in the home the child is far, far, far more likely (prisons are full of fatherless children that never finished High School) to finish school & thus far less likely to partake in recreational drug use, which makes it far less likely they will become a criminal.
https://rumble.com/v1mt84s-more-information-on-out-of-wedlock-births-2010-2017.html
https://rumble.com/v1mtkci-divorcee-sam-seder-suddenly-concerned-about-fatherless-black-children.html https://www.youtube.com/playlist?list=PLoA9J0G6s-6owc0S5klji-hEBtbAzbloB
http://freewebs.com/professor_enigma/black-lives-do-not-matter https://www.youtube.com/watch?v=p5pWdKMB4mE https://www.youtube.com/watch?v=Aq3n4CsMx8k Most young black children do NOT live w/ both parents, many of them have no positive male role model in the homes & as Denzel Washington says, “If they don’t find a father in the home, they’ll find one in the streets & prison will become their home.”
Denzel’s parents were divorced, but his father was always a part of his life, which is likely why he is successful & not dysfunctional. My father has always been there for me, which is why I am successful & not dysfunctional.
Back in the 1940s & 1950s, most Black children had both biological parents living in the home & by the mid-1960s, we had seen a seismic downturn, which has been dwarfed by the seismic downturn in Black kids living w/ both parents over the past 50 years. It is sad, it is disheartening.
Democrats refuse to acknowledge this & play to the lowest common denominator, fuming over conspiracies like the police are hunting them (in jurisdictions where the City Council is overwhelmingly Democrat too, hmmm) & Confederate militias, White Supremacy – every imaginary boogeyman but the truth.
The soft bigotry of low expectations is an effort to keep Black people poor & trapped in government schools that are a wreck. And you get to pay for it.
On the flip side, Asians are doing the opposite. The vast majority of them are born to parents (see this data from California, it explains A LOT! https://rumble.com/v2lnikg-ever-wonder-why-california-is-a-mess-part-ii.html) who have degrees or at least finished high school & daddy is in the home, he doesn’t spare the rod.
Junior does his homework every single night, like it or not. Eventually, he learns to like it & ends up another one of the many Asian men who have done nothing but succeed in this country. Some were born here & some came here under the auspices of a meritorious immigration system, a system that was damaged by LBJ & his Democrat Congress in the 1960s, a system that Barack Hussein Obama tried to damage even further (but failed for the most part due to a GOP House) & a system that Joe Biden & his treasonous cronies have effectively neutered in a plot to bring in more riff-raff, merit need not apply.
Meritorious Hispanics (such as those who went to Florida from Cuba) & Asians are less likely to vote Democrat, which is why Joe Biden wants a tsunami of people, many of which are illiterate in their own language, to fill the vacuum & destroy this country.
These meritorious Asians are doing well in government, charter & private schools, but Black children (especially in places like California & New York and especially in government schools) are not doing well.
https://rumble.com/v1dmq69-brian-tyler-cohen-is-not-very-bright-part-v.html BONUS: Look at the demographics & voting preferences of some of the states w/ the highest % of residents that did not finish 9th grade, as well as the % of the population that did not finish High School. This is what the Democrats want & states ravaged by illegal immigration tend to fare worse.
Enough of that, MDL61 balked when challenged at debating something specific, something detailed, something a meme or a 2-sentence snarky reply where he tries to be funny would not cut it because he cannot do that.
Even *IF* he could refute my data (and he cannot), he is too lazy to put the necessary work into it, he does videos where he cuts-and-pastes the content of others or does some silly meme.
But he cannot refute my data & he goes to the same well every other underemployed troglodyte in the Dumocrat Party does – he goes to the race card. “You’re RACIST!” You can call me racist, but you can’t call me wrong Mark.
MDL61 also whined that I prohibited him from posting on my channel because he has a lot of free time & while I am at work (unless I am taking some well-deserved vacation, such as today) he would be posting 2-sentence responses on all my videos, none of which even remotely answered anything I brought up, so he would be a waste of time in that regard. He just wants to get his name up there & he is not going to debate anything specific, period. He can see the last 3 paragraphs as to why I will give the old man no attention on my channel.
I would ask him to put up a point-by-point, detailed response to one of my videos, but he won’t do that, he’ll just post 35-word “replies” instead. I do these detailed videos as a hedge against folks like him who have no facts & no intelligence, but they do have gobs of free time to try & yell over everyone on the interwebs.
I already challenged him to upload a detailed response & you all saw the results of that, he is a waste of time.
In closing, the board has received MDL61’s concession and I have graciously accepted it. Unless he uploads an actual response that does not consist of a meme (and I doubt he will) this will likely be the final time I give him any attention.
As soon as I give him some attention, he runs away, but he wants to yammer about Donald Trump, who has not a clue who he is. It’s as if he only “debates” people who don’t know who he is or cares what he posts. He loves debating opponents that do not even know there’s a debate going on. Funny, isn’t it?
PS This guy loved repeating “John Andrew from Iowa” as if he had found it hidden in some cryptic Gnostic Gospel. He simply went to my website & looked at my social media links. I go by “John Andrew” & a few other monikers (I chose “John Andrew” because an unemployed Janitor from Chicago named McCainisthroughX thought I was some other person named who went by “John Andrew” & started falsely accusing him of being me. This was not true, but I ran w/ it), he can repeat them all he wants & look for “John Andrew” in the phonebook, I doubt he’ll find me, in fact I am quite certain of it as that is not my name, but by all means, repeat it as if you are some super-sleuth.
My previous response to this clown https://rumble.com/v2bv0gy-sam-seder-supporter-mdl61-gets-pwned.html
409
views
1
comment

Ever Wonder Why California Is A Mess? Part II
Ever Wonder Why California Is A Mess? Part II
An influx of illegal immigrants, along w/ a Progressive ideology has doomed California. If the U.S. doesn’t switch gears, I think the entire nation will be like California. An influx of low-skilled labor isn’t going to increase our labor force participation rate.
Progressives are having hissy fits over merit-based immigration (which is actually a good Donald Trump idea) because it’s harder to bribe successful folks w/ welfare benefits. What are they going to do? Tell them that if they’re successful we’ll take more of your money to finance an extravagant welfare state?
Broken link? Find it archived https://archive.ph/ https://archive.org/
The background material
https://nces.ed.gov/pubs2016/2016014.pdf
https://nces.ed.gov/pubs2017/2017094.pdf
https://nces.ed.gov/pubs2018/2018070.pdf
https://nces.ed.gov/pubs2015/2015011.pdf
https://nces.ed.gov/pubs2016/2016006.pdf
https://nces.ed.gov/pubsearch/getpubcats.asp?sid=091#061
https://www.cnsnews.com/news/article/terence-p-jeffrey/least-educated-state-california-no-1-percentage-residents-25-and [NOTE: see NCES Table 219.50 in conjunction w/ this]
https://factfinder.census.gov/faces/tableservices/jsf/pages/productview.xhtml?pid=DEC_10_DP_DPDP1&prodType=table
https://www.census.gov/quickfacts/fact/table/nj,co,fl,US/PST045218 (Race and Hispanic Origin)
https://www.census.gov/quickfacts/fact/table/az,nv,tx,nm,ca,US/PST045218 (Race and Hispanic Origin)
For data on out-of-wedlock births & other source data, see one of my previous videos on California. https://www.youtube.com/watch?v=sVBxOUm54Qg
Table 401.60. U.S. Department of Education appropriations for major programs, by state or jurisdiction: Fiscal years 2012-2016 (language assistance or English language acquisition)
From FY2012-16, California received $759 million for language assistance or English language acquisition classes from federal taxpayers.
Table 107. Percent of high school dropouts (status dropouts) among persons 16 to 24 years old, by sex and race/ethnicity [NOTE: For years 1998-2001]
1998 US avg all races 11.8
1999 US avg all races 11.2
2000 US avg all races 10.9
2001 US avg all races 10.7
1998-2001 Cumulative avg 11.2
1998 Hispanic origin 29.5
1999 Hispanic origin 28.6
2000 Hispanic origin 27.8
2001 Hispanic origin 27
1998-2001 Cumulative avg 28.2
Table 219.80. Percentage of high school dropouts among persons 16 through 24 years old (status dropout rate) and number of status dropouts, by noninstitutionalized or institutionalized status,
birth in or outside of the United States, and selected characteristics. [NOTE: For years 2010-16]
You are far, far more likely to not be in the labor force if you dropped out of high school [e.g. table 504.20].
2010 US avg all races 8.3
2011 US avg all races 7.7
2012 US avg all races 7.0
2013 US avg all races 6.8
2014 US avg all races 6.3
2015 US avg all races 6.0
2016 US avg all races 5.8
2010-16 cumulative avg 6.8
2010 Hispanic 16.7
2011 Hispanic 14.5
2012 Hispanic 12.8
2013 Hispanic 11.8
2014 Hispanic 10.7
2015 Hispanic 9.9
2016 Hispanic 9.1
2010-16 cumulative avg 12.2
2011 “For those born outside of the United States”, “Hispanic” 27.9
2012 “For those born outside of the United States”, “Hispanic” 24.2
2014 “For those born outside of the United States”, “Hispanic” 20.8
2015 “For those born outside of the United States”, “Hispanic” 18.7
2016 “For those born outside of the United States”, “Hispanic” 16.1
Cumulative avg for selected years (not all were available) = 21.5
California ranks No. 1 among the 50 states for the percentage of its residents 25 and older who have never completed ninth grade and 50th for the percentage who have graduated from high school, according to new data from the Census Bureau… 9.7 percent of California residents 25 and older, the Census Bureau says, never completed ninth grade. Only 82.5 percent graduated from high school… California and Texas—while having the highest percentages of residents 25 and older who never finished ninth grade and the lowest percentages who graduated from high school—are the nation’s two most populous states.
In fact, the 2,510,370 California residents 25 and older who, according to the Census Bureau, never finished ninth grade outnumber the entire populations of 15 other states. In California, children are required to attend school from six years of age until they are 18… The Census Bureau’s American Community Survey queries a random sample of more than 3.5 million U.S. households each year and publishes a one-year estimate for each year. The five-year estimate, the bureau says, “is a weighted average of the five one-year estimates.” The newly released five-year estimates are for the period from 2013 through 2017.
Nationwide, 5.4 percent of residents 25 and older have never finished ninth grade, according to the latest five-year estimates.
Turning to Table 104.70: Number and percentage distribution of 6- to 18-year-olds, by parent’s highest level of educational attainment, household type, and child’s race/ethnicity & in the *older literature* it is Table 12: Percentage distribution of 6- to 18-year-olds, by parent’s highest level of educational attainment, household type, and child’s race/ethnicity.
2006, Both household types, (single-parent & two-parent household) all ethnic groups (White, Black, Hispanic, Asian, etc.) “Less than high school completion” = 11.2%
2006, Two-parent household, all ethnic groups (White, Black, Hispanic, Asian, etc.) “Less than high school completion” = 7.4%
2006, Single-parent household, all ethnic groups (White, Black, Hispanic, Asian, etc.) “Less than high school completion” = 19.2%
2006, Two-parent household, Hispanic, “Less than high school completion” = 29.5%
2006, Single-parent household, Hispanic, “Less than high school completion” = 39.1%
------------------------------------------
2008, Both household types, (single-parent & two-parent household) all ethnic groups (White, Black, Hispanic, Asian, etc.) “Less than high school completion” = 10.9%
2008, Two-parent household, all ethnic groups (White, Black, Hispanic, Asian, etc.) “Less than high school completion” = 7.4%
2008, Single-parent household, all ethnic groups (White, Black, Hispanic, Asian, etc.) “Less than high school completion” = 18.3%
2008, Two-parent household, Hispanic, “Less than high school completion” = 28.7%
2008, Single-parent household, Hispanic, “Less than high school completion” = 38%
--------------------------------------------------------------------
2010, Both household types, (single-parent & two-parent household) all ethnic groups (White, Black, Hispanic, Asian, etc.) “Less than high school completion” = 11.6%
2010, Two-parent household, all ethnic groups, (White, Black, Hispanic, Asian, etc.) “Less than high school completion” = 7.1%
2010, Single-parent household, all ethnic groups, (White, Black, Hispanic, Asian, etc.) “Less than high school completion” = 20.3%
2010, Two-parent household, Hispanic, “Less than high school completion” = 25%
2010, Single-parent household, Hispanic, “Less than high school completion” = 37.4%
---------------------------------------------------
2011, Both household types, (single-parent & two-parent household) all ethnic groups, (White, Black, Hispanic, Asian, etc.) “Less than high school completion” = 11.2%
2011, Two-parent household, all ethnic groups (White, Black, Hispanic, Asian, etc.) “Less than high school completion” = 7.5%
2011, Single-parent, all ethnic groups (White, Black, Hispanic, Asian, etc.) “Less than high school completion” = 18.3%
2011, Two-parent household, Hispanic, “Less than high school completion” = 26.8%
2011, Single-parent household, Hispanic, “Less than high school completion” = 36.9%
---------------------------------------------------------------
2013, Both household types, (single-parent & two-parent household) all ethnic groups, (White, Black, Hispanic, Asian, etc.) “Less than high school completion” = 10.8%
2013, Two-parent household, all ethnic groups (White, Black, Hispanic, Asian, etc.) “Less than high school completion” = 7.2%
2013, Single-parent, all ethnic groups (White, Black, Hispanic, Asian, etc.) “Less than high school completion” = 17.6%
2013, Two-parent household, Hispanic, “Less than high school completion” = 24.9%
2013, Single-parent household, Hispanic, “Less than high school completion” = 35.2%
---------------------------------------------
2016, Both household types, (single-parent & two-parent household) all ethnic groups, (White, Black, Hispanic, Asian, etc.) “Less than high school completion” = 10.4%
2016, Two-parent household, all ethnic groups (White, Black, Hispanic, Asian, etc.) “Less than high school completion” = 6.4%
2016, Single-parent, all ethnic groups (White, Black, Hispanic, Asian, etc.) “Less than high school completion” = 17.8%
2016, Two-parent household, Hispanic, “Less than high school completion” = 20.8%
2016, Single-parent household, Hispanic, “Less than high school completion” = 32.3%
-------------------------------------------
Both household types, all ethnicities cumulative avg. (2006, 2008, 2010-11, 2013, 2016) = 11%
Two-parent households, all ethnicities cumulative avg. (2006, 2008, 2010-11, 2013, 2016) = 7.2%
Single-parent households, all ethnicities cumulative avg. (2006, 2008, 2010-11, 2013, 2016) = 18.6%
Two-parent household Hispanic cumulative avg. (2006, 2008, 2010-11, 2013, 2016) = 26%
Single-parent household Hispanic cumulative avg. (2006, 2008, 2010-11, 2013, 2016) = 36.5%
------------------------------------------------
More uncomfortable data, out-of-wedlock birth rates in states w/ higher-than-average “Hispanic” populations. I covered this previously for California & New Mexico, it’s worth revisiting.
Births to unmarried women, by race and Hispanic origin of mother: United States, each state and territory
California average, all races 2010-17 = 39.25%
California Hispanic 2010-17 = 52.8%
California Black 2010-17 = 66.85%
California White 2010-17 = 23.58%
New Mexico average, all races 2010-17 = 51.73%
New Mexico Hispanic 2010-17 = 57.95%
New Mexico Black 2010-17 = 55.41%
New Mexico White 2010-17 = 30.56%
Texas average, all races 2010-17 = 41.8%
Texas Hispanic 2010-17 = 50.6%
Texas Black 2010-17 = 63.6%
Texas White 2010-17 = 26.8%
Arizona average, all races 2010-17 = 45.1%
Arizona Hispanic 2010-17 = 56.6%
Arizona White 2010-17 = 30.5%
Arizona Black 2010-17 = 62.4%
Nevada average, all races 2010-17 = 46%
Nevada Hispanic 2010-17 = 54.2%
Nevada White 2010-17 = 34%
Nevada Black 2010-17 = 72.8%
Florida average, all races 2010-17 = 47.6%
Florida Hispanic 2010-17 = 50.9%
Florida White 2010-17 = 36.9%
Florida Black 2010-17 = 69.2%
Colorado average, all races 2010-17 = 23%
Colorado Hispanic 2010-17 = 34%
Colorado Black = 40.4%
Colorado White = 17.1%
New Jersey, all races 2010-17 = 35.3%
New Jersey Hispanic 2010-17 = 59.2%
New Jersey Black 2010-17 = 67.7%
New Jersey White 2010-17 = 18.5%
Dishonorable Mention: District of Columbia, all races 2010-17 = 50.8%
District of Columbia Hispanic 2010-17 = 61.2%
District of Columbia Black 2010-17 = 78.1%
District of Columbia White 2010-17 = 5.7%
Dishonorable Mention II: Mississippi average, all races 2010-17 = 54.07%
Mississippi Hispanic 2010-17 = 54.52%
Mississippi Black 2010-17 = 80.6%
Mississippi White 2010-17 = 32.35%
USA average all races 2010-17 = 40.36%
USA average Hispanic 2010-17 = 53%
USA average White 2010-17 = 29%
USA average Black 2010-17 = 71.1%
In the states that I covered that have a much larger than average “Hispanic” population [NOTE: Make sure you take a gander at all the Census “race/ethnicity” designations] – California, New Mexico, Texas, Arizona, Nevada, Florida, Colorado & New Jersey – the Hispanic out-of-wedlock birth rate was 52%. The only state that was any sort of outlier was Colorado.
The overall average for all races in those states was 41.2%.
Sans Colorado the average was 54.6% for “Hispanic.” For all races in those states sans Colorado it was 43.8%. America has a problem—we have a lot of unskilled (or at least very irresponsible) immigrants failing to finish high school, dropping out of the labor force & having children who don’t finish high school, drop out of the labor force & Bernie Sanders is there w/ your wallet to save the day.
A merit-based immigration system is something I’ve been in favor of for a long time. Jobs are merit-based, always have been. A meritocracy in the workplace dictates that the best employees get “better” schedules, better pay & promotions.
If you can’t run the forklift, if you can’t drive the truck, if you can’t get enough units/hour then guess what? They will find something else for you to do or let you go. If you can’t manage the production floor effectively & it’s organized chaos, someone else will do it for you.
Immigration should be no different, there’s nothing wrong w/ a meritocracy because the business of America is business, not global or domestic handouts.
I’ve said it many times before, I will say it again—America’s people were voting for crazy people (like FDR & Truman) back in the 1940s & 1950s, w/ one important caveat—those people themselves weren’t crazy & they practiced that lost craft called “personal responsibility.”
Many of those folks were those who emigrated to these United States from Europe in the 1910s & 1920s. Those folks didn’t have a welfare state to take advantage of, even if they were privy to doing so. They learned English, they integrated, they built families & most important—the family unit was largely intact.
Many of those folks were part of “The Greatest Generation” that helped us win World War II & turned America into an economic powerhouse (these folks also unfortunately voted in pols like FDR, Truman & LBJ—socialists who started this grand welfare state).
That ALL started to change in the 1960s & here we are seeing the nuclear family crumbling & a lot of emasculated soyboys like Bernie Sanders, Stan Seder, Bill Maher, Bruce Jenner & Beta-male O’ Rourke.
I blame “We The People” as much as I blame the cockroaches in Washington, there are a lot of folks in this country that need some tough love, some personal responsibility & probably a lifetime supply of condoms & IUDs.
If you’re in a single-parent household you are not doomed, nobody is saying that. However, those in single-parent households are more likely to have an absentee father or mother (as opposed to regular visits or shared living arrangements) & those in single-parent households (especially those who were NOT born here) are more likely to be drop out of high school, far more likely to live w/ a parent who has no education & far, far more likely to NOT be in the labor force.
This is a huge problem. It’s also become an expensive problem as taxpayers are held hostage by those who seek to buy Peter’s vote w/ Paul’s money.
Ergo, we do need to shift from a family & refugee immigration program to an economic & merit-based immigration system. Nancy Pelosi says, “nobody is without merit.” Uh, no. Folks who have HIV/AIDS, tuberculosis, STDs, gang-affiliations, lack of a family structure—have no business being here.
If we didn’t have an extravagant welfare state/cradle-to-grave entitlement structure this would be less of a problem. But we do have those obstacles to deal with & bringing in more unskilled labor that isn’t participating in the labor force isn’t going so solve our oncoming economic problems—it will exacerbate them.
It’s not racist to point out that California has a lot of unskilled Hispanics in single-parent households that aren’t participating in the labor force (merit-based immigration would solve much of that). It’s not racist to point out many of them are on welfare. It’s not racist to point out that California’s public education system is failing all ethnic groups there, especially Hispanics & Blacks.
Just as it’s not racist to point out that Mississippi has a lot of white trash that have kids out of wedlock, no family structure, dropping out of high school, high-illiteracy rates & lots of STDs.
Just as it’s not racist to point out that Mississippi’s black residents are usually poor because daddy isn’t around. It’s not racist to point out the truth, but some in this age of massive political correctness want to make it that way & shout-down anyone who dares oppose them.
I guess if “white privilege” (and maybe “Asian privilege” too) means I had two parents that were always around, always worked, always gave me more love than I deserved & always provided for me—then I am guilty as charged.
Bill Maher is right about one thing (although I disagree to how he arrives at this conclusion & I will amend his quote slightly), many Americans (including Bill Maher) are ignorant & very irresponsible.
It’s not my fault whites in Mississippi are failing & it’s certainly not my fault that California bringing-in droves of unskilled Hispanics is failing. Our current immigration system is failing Asian & Hispanic immigrants who are educated, who do have two-parent households, who are practicing that lost art called “personal responsibility.”
As far as most Progressives go who disagree with me, void of facts—it’s easy to conspicuously compassionate when you do not pay the cost. Have a nice day & you have been warned!
This video originally uploaded on YouTube back in 2019
203
views

Donald Trump's bad logic (contra Ron DeSantis)
Donald Trump's recent ad contra Ron DeSantis was not a home run, he was struck out looking (to use a sportsball analogy) IMO
The most violent jurisdictions in America have lots of black on black murder & they typically vote Democrat. Why is that? https://rumble.com/v2ahqta-divorcee-sam-seder-vs.-utubekookdetector-black-on-black-crime.html
25
views
1
comment

Sam Seder’s favorite argument debunked
Sam Seder’s favorite argument debunked
https://www.theepochtimes.com/i-will-not-be-bullied-north-carolina-democrat-representative-switches-to-republican_5173621.html https://www.theepochtimes.com/democratic-west-virginia-state-senator-switches-to-republican-party_4901307.html https://www.theepochtimes.com/west-virginia-lawmaker-leaves-democrat-party-for-gop_5203379.html
One of the divorcee Sam Seder’s favorite arguments & an argument that is overused by a lot of folks is to find “someone on ‘the other side’ that agrees with me, where’s my Risperdal, I win” argument.
The divorcee will employ some very flexible & speedy moving goalposts to get around this argument. The divorcee will trot out a few Republicans that disagree with “X” & by golly, that means something, even though Republicans are liars.
David Brock admitting to knowingly & willfully lying for years, but the only thing that changed was his political affiliation, he still has a lot of mental issues & he still needs his head examined.
When Tulsi Gabbard shed the fetters of the Demoncrat Party, the divorcee brushed that away by declaring her a Fox News Pundit, so that doesn’t count. I would presume the 2 state lawmakers in West Virginia & one in North Carolina that switched from Dumocrat to GOP over the past several months do not count either, but they weren’t Fox News Pundit.
Was Juan Williams a Fox News Pundit? Was Bob Beckel a Fox New Pundit?
I made this point in a video: Even FDR believed that education was a state task, ergo the Federal Dept. of Education is unconstitutional. Is my argument more true because FDR agreed? Not really. The Federal Dept. of Education is unconstitutional, whether every Democrat POTUS or no Democrat POTUS ever agreed with me & I made that point in the video. https://www.youtube.com/watch?v=vsTPvxHKjPw
Democrats regularly decry “Dark Money in Politics”, while spending loads of dark money to end the Senate filibuster – usually excreted by fly-by-night, we’ll be gone in a year “concerned citizen” groups. https://rumble.com/v24p838-senator-rand-paul-raises-the-alarm-on-our-coming-fiscal-calamity.html Reminds me of the roofers from out-of-state that show up in a town after a massive hail storm damages hundreds of homes & they’re here to fix it for you & then never show up again.
Some of us realize the limitations of these arguments when we turn thirty & then some of us are well-beyond middle aged divorcees with no life outside of Twitter & YouTube – still using those arguments as if they are the ultimate UNO card.
So, if finding “some on the other side that thinks my argument is full of **it” constitutes something, what does say ye old man?
PS Sam Seder has refused to use his internet show to *attempt* to debunk my essays on why the most violent cities in America have loads of black on black homicide & why they vote Democrat the vast majority of the time. Why is that? https://rumble.com/v2ahqta-divorcee-sam-seder-vs.-utubekookdetector-black-on-black-crime.html http://freewebs.com/professor_enigma/sam-seder-ilhan-omar-racism3 http://freewebs.com/professor_enigma/covid-increase-homicides
PPS Sam Seder is afraid #samseder #majorityreport to debate my friend James Patrick Holding on The Impossible Faith. Methinks the divorcee has little confidence in that religion degree from a diploma mill https://tektonics.org/lp/nowayjose.php
PPPS The next time the divorcee Sam Seder talks about evil Republicans, violent Republicans ask him about the point I made in “PS” & then throw this at him https://rumble.com/vcohr5-on-the-progressive-mean-republicans-so-vote-democrat-argument.html
268
views
1
comment

Divorcee Sam Seder and Joy Reid find out about dead people in Kansas City
http://freewebs.com/professor_enigma/covid-increase-homicides
Wowzers folks, the divorcee Sam Seder & the overweight Joy Reid have finally found out about dead people in Kansas City. They’re only a few decades late in that endeavor, because if they wanted to talk about murder victims in Kansas City, Missouri, they could be busy for weeks.
The divorcee Sam Seder doesn’t live w/ his ex-wife obviously (remember when he used to guffaw over Rush Limbaugh’s latest divorce?), nor does the old man live w/ his kids, so he has lots of free time to talk about murder victims in Kansas City.
According to the FBI, https://cde.ucr.cjis.gov/LATEST/webapp/#/pages/explorer/crime/crime-trend here are KC’s murders from 2015-2021: 110, 131, 153, 142, 152, 176 & 156. The FBI says KC has been submitting NIBRS data since 2010, but I only see data for 2021 elucidated. For what it is worth, of the 138 murder OFFENDERS where we know the race of the offender, 81.88% (113) of them were Black. Of the 155 victims where we know the race of the victim, (123) 79.35% of them were Black. According to the Census Bureau, https://web.archive.org/web/20230331005035/https://www.census.gov/quickfacts/fact/table/kansascitycitymissouri/PST045221 Kansas City, Missouri was only 26.5% black in 2021. That tells you all you need to know. #blacklivesmatter
Twenty-six folks in KC (2021) had their lives snuffed out (I wish the FBI categorized 0-9 & then 10-17, but they do not) before they had their 20th birthday.
According to the FBI for Missouri en masse, of the 499 murder offenders where we know the race of the offender, (322) 64.52% of them were Black. Of the 588 victims where we know the race of the victim, (410) 69.72% of them were Black. https://web.archive.org/web/20220105203349/https://www.census.gov/quickfacts/fact/table/MO/PST045221 MO was only 11.8% Black in 2021.
Black folks are not being knifed & gunned down in KC by the police or Confederate, “The South Will Rise Again” Rednecks, it is other black folks doing the dirty deed. You need to admit that Joy Reid, but ostensibly you have, because you refuse to move to the hood. I do not blame you fatty! For every mass shooting where you can blame a white guy (regardless of his OR HER political leanings, cough cough), there are dozens of young black men in KC murdered by other young black men.
The Kansas City, MO PD https://www.kcpd.org/media/annual-reports/ https://www.kcpd.org/media/4140/2021-annual.pdf gives these numbers for murder 2015-2021: 111, 131, 151, 138, 151, 179 & 157.
Peruse any Kansas City (often, if you tally the victims of homicide & then add “Other” it equals a total much larger than the # of victims) PD report & your eyes will explode. Every single year without fail, EVERY SINGLE YEAR WITHOUT FAIL Black Males lead the way in murder victims, as well as the “suspects” in murder investigations.
Must be George Wallace or Bull Connor antagonizing them from the grave.
According to the Missouri State Highway Patrol, https://showmecrime.mo.gov/public/View/RSReport.aspx?ReportId=18 here are KC’s murders 2015-2022: 112, 131, 153, 142, 152, 176, 156 & 166.
Some additional sobering info I have covered before, this is review for those of you who have followed my essays on murder in Democrat-run dungholes: How about Missouri? Criminal Homicide Rate 2018-2020 (1,898 criminal homicides according to the FBI, 1,912 criminal homicides according to the MO State Highway Patrol) = 10.304 per 100,000 (FBI) & 10.380 per 100,000.
How about St. Louis City & Kansas City, Missouri? Criminal Homicide Rate 2018-2020 (1,110 criminal homicides) = 45.995 per 100,000. Criminal Homicide Rate in Missouri OUTSIDE of St. Louis City & Kansas City (788 criminal homicides if you use the FBI total) = 4.923 per 100,000 (5.010 per 100,000 using MO State Highway Patrol Data). Have you seen this movie before?
Now let’s do Missouri – all counties that voted for Donald Trump (66% or more because he won MO by such large margins) in 2020 & 2016. We’ll run all their collective homicide rates for 2018-2020. https://showmecrime.mo.gov/public/ (Select “NIBRS Crimes and Rates by County - Last 3 Years” then “Offense Type” then “Murder and non-negligent manslaughter” then “Show Report”. I used this for 2020 & 2019 data, I used https://www.mshp.dps.mo.gov/MSHPWeb/SAC/data_and_statistics_ucr_query_backup.html for 2018 data. “Supplemental Homicide” “Deaths by Type And Location” “County” “All Counties” “All Populations” & the EXCEL File)
Those counties are: Andrew, Atchison, Audrain, Barry, Barton, Bates, Benton, Bollinger, Butler, Caldwell, Callaway, Camden, Cape Girardeau, Carroll, Carter, Cedar, Chariton, Christian, Clark, Clinton, Cooper, Crawford, Dade, Dallas, Daviess, DeKalb, Dent, Douglas, Dunklin, Franklin, Gasconade, Gentry, Grundy, Harrison, Henry, Hickory, Holt, Howard, Howell, Iron, Jasper, Knox, Laclede, Lafayette, Lawrence, Lewis, Lincoln, Linn, Livingston, McDonald, Macon, Madison, Maries, Marion, Mercer, Miller, Mississippi, Moniteau, Monroe, Montgomery, Morgan, New Madrid, Newton, Nodaway, Oregon, Osage, Ozark, Perry, Pettis, Phelps, Pike, Polk, Pulaski, Putnam, Ralls, Randolph, Reynolds, Ripley, St. Clair, St. Francois, Schuyler, Scotland, Scott, Shannon, Shelby, Stoddard, Stone, Sullivan, Taney, Texas, Vernon, Warren, Washington, Wayne, Webster, Worth & Wright.
Homicides for those counties 2018-2020 = 122
Cumulative Population for those counties 2018-2020 = 6,724,722
Homicide Rate for the counties above 2018-2020 = 1.814 per 100,000. That is much lower than the homicide rate in MO outside of St. Louis City & Kansas City. The uber-Republican, Donald Trump counties in MO are not spiking homicide rates there.
How about Missouri? https://showmecrime.mo.gov/public/ (Select “SRS Crime Rates by County” then “Summary Offense” then “Murder and Nonnegligent Homicide” & lastly “Show Report. You can also use the “NIBRS Reports”, which are more thorough. I compared BOTH and I was glad I did because some NIBRS reports had zero homicides & the SRS reports did not. In that case, I eliminated that county)
MO counties w/ ZERO homicides in 2021: Cole, Franklin, Gasconade, Grundy, Howard, Howell, Miller, Perry, Ripley, Sainte Genevieve, Shannon, Stone, Wayne, Webster & Wright.
13.04% (15 of 115) of MO counties had zero homicides in 2021.
[NOTE: St. Louis City is an “Independent City” & thus MO technically has 115 counties]
MO counties w/ ZERO homicides in 2020: Bollinger, Butler, Caldwell, Camden, Carter, Cedar, Dade, Grundy, Laclede, Lincoln, Miller, Oregon, Perry, Randolph, Ray, Saint Francois, Sainte Genevieve, Sullivan, Vernon, Warren, Webster & Wright.
19.13% (only 22 of 115) of MO counties had zero homicides in 2020. They were 8.78% (540,736) of the state population. It was a rough 2 years in the Show Me State. Donald Trump won all 22 of those counties (100%) in the 2020 election w/ ≥60% of the vote.
https://rumble.com/v1z2nk8-divorcee-sam-seder-wont-conduct-this-analysis-of-missouri-arkansas-election.html Sam Seder, Brian Tyler Cohen et al continue to repeat "Red States have higher homicide rates than Blue States" -- they're guilty by omission & the devil is in the details
The only link you'll need http://freewebs.com/professor_enigma/covid-increase-homicides The U.S. crime wave is a Democrat Crime Wave
Here are the counties in Missouri that voted 60% or more for the homely-looking Trudy Busch Valentine: St. Louis City, St. Louis County & Jackson County.
Those counties had a cumulative population of 4,030,266 (2020-21) & had 1,038 homicides in 2020-21. That is a homicide rate of 25.755 per 100,000. The entire state of MO had 1,351 cases of murder/non-negligent manslaughter (2020-2021) & that’s a homicide rate of 10.963 per 100,000 for that time frame. YIKES!
Here are the counties in MO that vote 60% or more for Eric Schmitt: Adair, Andrew, Atchison, Audrain, Barry, Barton, Bates, Benton, Bollinger, Buchanan, Butler, Caldwell, Callaway, Camden, Cape Girardeau, Carroll, Carter, Cass, Cedar, Chariton, Christian, Clark, Clinton, Cole, Cooper, Crawford, Dade, Dallas, Daviess, DeKalb, Dent, Douglas, Dunklin, Franklin, Gasconade, Gentry, Grundy, Harrison, Henry, Hickory, Holt, Howard, Howell, Iron, Jasper, Jefferson, Johnson, Knox, Laclede, Lafayette, Lawrence, Lewis, Lincoln, Linn, Livingston, McDonald, Macon, Madison, Maries, Marion, Mercer, Miller, Mississippi, Moniteau, Monroe, Montgomery, Morgan, New Madrid, Newton, Nodaway, Oregon, Osage, Ozark, Pemiscot, Perry, Pettis, Phelps, Pike, Polk, Pulaski, Putnam, Ralls, Randolph, Ray, Reynolds, Ripley, St. Clair, Ste. Genevieve, St. Francois, Saline, Schuyler, Scotland, Scott, Shannon, Shelby, Stoddard, Stone, Sullivan, Taney, Texas, Vernon, Warren, Washington, Wayne, Webster, Worth & Wright.
Those counties had a cumulative population 2020-21 of 5,784,221 & had 213 (102 in 2020 & 111 in 2021) homicides in 2020-21. That is a homicide rate of 3.682 per 100,000. By far, the most violent counties in MO vote overwhelmingly for Dumocrats & they alone are the reason the homicide rate there is so high.
Again, we have a state w/ a high homicide rate & the vast majority of it is occurring in Democrat-dominated counties, featuring lots of black folks killing black folks. This has been going on in KC et a. Democrat cities for many years, what took the groomer Sam Seder & his overweight compadre Joy Reid so long to figure it out?
Maybe they finally did figure it out not because they care about black folks, children or justice, but because they think they can score political points w/ these dead bodies.
The full monty & supplemental info can be found here http://freewebs.com/professor_enigma/covid-increase-homicides
If the troglodyte Joy Reid or the divorcee Sam Seder https://fox4kc.com/news/kansas-city-missouri-homicide-map/ want to wring their Vienna-sausage fingers over kids getting murdered, see this list of murder victims in KC for 2022.
I counted nine children (<18 years of age) murdered that year. Most of the murders were single victim encounters, not a mania brandishing a “weapon of war” & gunning down 5 people. That sells newspapers, but gang-bangers killing gang-bangers does not.
Sam Seder should get off his fat ass & do an entire show on those nine children & he can cry crocodile tears (most of them are Black) until Irma Vegetable has some sustained brain-stem activity.
I counted https://www.kansascity.com/news/local/crime/article248234580.html 16 children murdered in KC back in 2021, Sam Seder & could watch Joy Reid eat a pound of butter while crying over those children who will never have an opportunity to finish High School.
Let us close w/ Chicago, since the unrest there recently is worse than the usual, run-of-the-mill unrest in Crazy Town & it is another Democrat-dominated city: https://rumble.com/vs3h40-latifah-faisal-story-county-iowa-supervisor-saytheirnames-chicago-2021-edit.html https://graphics.suntimes.com/homicides/
61 children were murdered (47 of them black) in Chicago back in 2021. In 2022, sixty-eight children met their demise, 53 of them were Black. In 2020, fifty-five children were murdered, forty of them were Black. In 2019, thirty-nine children were murder victims, thirty of them were Black.
As I type this, there have been 21 children murdered in the Windy City so far in 2023 & 16 of them are Black. We have a trend in Chicago, murder remains a major problem & the number of children getting killed continues to increase.
I just gave groomer Sam Seder & Joy Reid enough young murder victims that would keep them busy blabbing on their shows for months, they would not have time for anything else, but doing that would undermine their narrative – the soft bigotry of low expectations.
Black folks & particularly young black men must continue to be portrayed as victims, helpess & needy & the MSLSD crowd must continue to ignore the fact that the most dangerous predator to a young black male in America (particularly in places like Kansas City, Missouri & Chicago) is not a LEO/police officer, not a Confederate flag-waving hillbilly, not a white militia member or a J6 “Insurrectionist” – but another young black male.
Mr. Chairman, I Yield Back.
The divorcee Sam Seder #samseder #majorityreport is afraid to debate my friend James Patrick Holding on The Impossible Faith. https://tektonics.org/lp/nowayjose.php Methinks the divorcee lacks confidence in that religion degree from a diploma mill
411
views
1
comment
Sam Seder is BRICK DUMB, Larry Elder played my BLM call
The relevant sources you will need
http://freewebs.com/professor_enigma/covid-increase-homicides https://rumble.com/v2ahqta-divorcee-sam-seder-vs.-utubekookdetector-black-on-black-crime.html
Before we get to the clip where Larry Elder played my call debunking Black Lives Matter, let us review some more data. This is review & we have to do it over & over again because divorcees like Sam Seder, who sits on his fat ass all day doing nothing – has a lot of free time.
Nobody will ever defeat him on free time & his ex-wife can likely attest to that. Sam Seder has important things to do on Twitter & YouTube, he’s really important.
Sam Seder has an autistic fit every time someone correctly mentions that the Black Lives Matter/George Floyd fiasco of 2020 started a very bad trend. Young black men especially, were always suffering from a high murder death rate, usually at the hands of another young black male.
It has been this way for a century! But in 2020 & 2021, it accelerated as folks like Maxine Waters & #AOC tried to rile up their underemployed/unemployed base that has nothing to lose – they know in chess the pawns go first – they tried to rile up these losers & it resulted in thousands & thousands of extra murders, most of them were black.
Let us look at the NIBRS data & find out what % of murder victims & offenders (where we KNOW the race of the victim or perp) were Black 2016-19. That was 23,688 offenders & (13,385) 56.5% of them were Black. That is very disproportionate!
If a Progressive lunch meat slicer takes issue w/ that, I will point out that 23,688 is a pretty good sample size of all murder offenders. Deal w/ it and/or get an education at a parochial school, so you can learn something aside from autistically-reciting your pronouns.
From 2016-19 of the 21,695 victims where we KNOW the race of the victim, (11,193) 51.59% of the victims were Black. That is also very disproportionate!
From 2020-21, the NIBRS data gives us 23,034 murder offenders where we KNOW the race of the offender. Of those 23,034 offenders, (13,707) 59.5% of them were Black. That is also very disproportionate!!
From 2020-2021, the NIBRS data gives us 24,584 victims of murder & of those 24,584 victims, (14,382) 58.5% were Black.
The murder rate (per 100,000) was much, much higher in the latter (2020-2021) time frame than the former (2016-2019) & the % of murder victims that were Black & offenders that were Black increased substantially as well.
It appears that despite the whining of carnival barkers like the divorcee Stan Seder, #blacklivesmatter accomplished what they wanted to accomplish. They created more chaos, they pined for fragmented families because they hate nuclear families & they used millions of idiots as pawns in their game.
Now let’s look at some CDC data in a report from way back in 1975, this was so long ago even the old man Sam Seder was young.
The homicide rate in these United States saw a YUUUGE spike in the 1910s-1920s & then dropped substantially in the 1930s. During those Roaring Twenties, it was substantially higher than it has been over the last few years. During the 1950s it was lower than it has been the last few years, just some food for thought.
Some things have not changed: “The upward trend for homicide victims from 1960 to 1974 is the primary focus of this report. This trend is kept in perspective by a comparison of recent homicide rates with the rates for earlier years. Some data concerning persons arrested for homicide and circumstances concerning the violent deaths, supplied by the Federal Bureau of Investigation, are also presented. In 1973, 20,465 men, women, and children lost their lives from injuries inflicted by another person or persons with intent to injure or kill. This figure gives a homicide rate of 9.8 deaths per 100,000 for 1973, the highest ever recorded for the nation. The next highest rate occurred more than 40 years ago in 1933 when the rate reached 9.7 deaths per 100,000. Provisional data for 1974 show that homicide is still at a high level. It is estimated that the rate for 1974 was at least 9.8 deaths per 100,000, with 20,770 victims of homicide.”
“The category "white" includes, in addition to persons reported as white, persons reported to be Mexican or Puerto Rican. The categories "races other than white" and "all other" consist of persons reported as Negro, American Indian, Chinese, and Japanese; other numerically small racial groups; and persons of mixed white and other races. The Bureau of the Census reports that in 1973 about 26,802,000 of the 209,851,000 people in the United States (or 13 percent) belonged to "races other than white." Of the 26,802,000 people, about 23,801,000 (or 89 percent) belonged to the Negro race.”
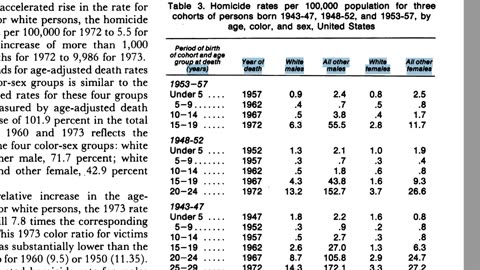
“For each of the four color-sex groups, the homicide rates declined slowly through the last half of the 1940s and through the 1950s, but the rates turned upward again at the beginning of the 1960s. The upward trend continued through 1973 for three of the four color-sex groups-white males, white females, and females of other races but not for males of other races. For males other than white, the rate of increase in homicides decelerated from the middle of the 1960s until about 1971, and then the rate turned downward-from 70.1 homicides per 100,000 for 1972 to 65.8 for 1973. The effect on the total homicide rate of this striking downturn in the rate for males of other races, however, was more than offset by the accelerated rise in the rate for the white population. For white persons, the homicide rate rose from 4.9 deaths per 100,000 for 1972 to 5.5 for 1973-representing an increase of more than 1,000 deaths-from 8,976 deaths for 1972 to 9,986 for 1973.
“An examination of the mortality pattern for age specific homicide rates for each year from 1933 to 1973 shows that-with few exceptions for any given year-for each of the four color-sex groups the age group 25-34 had a considerably higher death rate than any other age group. This pattern holds both for years in periods when homicide rates fell and for years in periods when the rates rose.”
“Firearms, especially handguns, are the primary means of homicide. According to information on the death certificates of the victims, the percentage of homicides committed by means of firearms and explosives rose from 54.7 in 1960 to 67.2 in 1973-an increase from 4,627 such homicides for 1960 to 13,572 for 1973. (For 1973, the Federal Bureau of Investigation estimated that 53 percent of the homicides were committed with handguns and about 14 percent with shotguns and other firearms.) On the other hand, information on the death certificates shows that the percentage of homicides committed with cutting and piercing instruments (especially knives) dropped from 21.7 in 1960 to 15.9 in 1973. This percentage decrease, however, does not reflect an actual decrease in the number of homicides committed with cutting and piercing instruments because the number increased from 1,816 in 1960 to 3,254 in 1973. Rather, the decrease in the percentage is largely a result of the relatively greater increase during 1960-73 in the use of handguns and other firearms and explosives to commit homicide… Other means of injury, including homicidal brawl, poisoning, drowning, and pushing from high places, accounted for about 20 percent of the homicides in 1960, but for only 14.8 percent of such deaths in 1973. Again, the percentage decrease does not reflect an actual decrease in the number of homicides committed in these ways-the number increased from 1,700 in 1960 to 3,083 in 1973.”
Most of the decline in homicides among the nonwhite population occurred to nonwhite males, from 46 deaths per 100,000 in 1950, their rate fell to 34 in 1961, a decrease of 26 percent in 12 years. The level was still more than seven times the national average… Over half the homicides were by firearms and explosives. Nearly one-fifth of the deaths were classified in the residual category “assault by other means” where the methods of homicide are not tabulated separately.
Among the many titles included in this category are homicides from strangulations, fights, and assault by unspecified or other means which cannot be classified in categories E980-E982. Females and white persons had proportionately twice as many homicides in this category as males and nonwhite persons, respectively. On the other hand, nonwhite persons showed almost twice as high a percentage of deaths from cuttings and stabbings as did white victims… In 1964 the rates for firearms and explosives and from cutting and stabbing wounds were greater for the nonwhite population than for the white, 8 and 16 times greater, respectively. For ages 25-44, these rates were 10 times greater for firearms and explosives and more than 20 times greater for cutting and stabbing wounds.”
Since the 1930s, Blacks & particularly young black men have ALWAYS been disproportionately victims of murder & most of the time they are the perpetrators as well. https://rumble.com/ve9vmt-enough-is-enough-by-old-fart-rants-debunked.html From 1980-2008, Blacks were <13% of the population, yet were 52.5% of the offenders & 47.4% of the victims. Do you see a trend? If Sam Seder is going to cry crocodile tears over dead bodies, he might want to go into the black community & tell them to plan their families instead of inseminating the first overweight Karen that gives them the time of day. Tell them to stick around & raise junior. Then again, Sam Seder has never had a successful relationship with the opposite gender of his species, so Sam giving marital advice would be like Adolph Hitler & Karl Marx giving advice on how to treat Jewish folks.
Now for my call to Larry Elder & then we’ll move on.
Now some disturbing news from Chicago, currently the hood rats are rioting there in an effort to intimidate society into doing what they want. I wonder why Sam Seder, I wonder why there are not shootouts every single day in Iowa, although a few Democrat-dominated cities in Iowa are having some issues, but by-and-large, there are not shootouts all over Iowa, Maine, lilly-white Vermont, most of lilly-white Minnesota – why is that old man?
The divorcee Sam Seder wants you to think we are not safe anywhere, but that’s a lie & he even knows it, because I told him.
Chicago is a wreck & Illinois has a very high homicide rate, but consider this data I unearthed long ago.
How about Illinois? 2018-2020 criminal homicide rate (FBI says 2,867 homicides, IL State Police say 2,901) = 7.5 per 100,000.
East St. Louis & Chicago criminal homicide rate (1,937 criminal homicides) 2018-2020 = 23.391 per 100,000. IL homicide rate OUTSIDE of Chicago & East St. Louis (930 homicides in IL OUTSIDE those cities) 2018-2020 = 3.105 per 100,000. Have we seen this movie before?
Let’s find all the counties in IL that Donald Trump won with 60% of the vote or > in 2016 & 2020. I am NOT going to name them all, they’re too numerous, see the references.
The counties in the Land of Lincoln that voted twice for Donald Trump & 60% of the vote went to him both times – the Cumulative Homicides for those counties 2018-2020 = 76
Cumulative Population (due to state data differing so much both ways from Census Data, I went w/ the latter) for those counties 2018-2020 = 3,935,893
Homicide Rate 2018-2020 for those counties = 1.930 per 100,000. This is much lower than the IL total en masse & much lower than the homicide rate in IL OUTSIDE of Chicago & E. St. Louis. Again, the most violent areas of America tend to be diverse, lots of fatherless children, lots of black-on-black homicide, lots of food stamps & lots of kids dropping out of school.
I doubt Woodford County, Illinois has fatherless children running down the main thoroughfare tossing Molotov Cocktails through store windows. Chicago has that, but not the most GOP-entrenched counties in IL.
The divorcee Sam Seder wants you to think the entire state of Illinois is a wreck, but its mainly 2 counties, both overwhelmingly voting for Biden, Hillary & any other person w/ a “D” after their name.
It seems Chicago’s new mayor Brandon Johnson wants to get rid of more police officers & replace them w/ social workers – this is an insane idea. But this is what the Democrat Party wants. They want to neuter the police, so there’s no proactive policing in high crime areas, which will result in fewer criminals apprehended as the police are not anywhere in the neighborhood.
They want the police ranks thinned so there are not enough of them to do their job. They want to, people like Kim Foxx want to let criminals loose & if you defend yourself from BLM terrorists like Kyle Rittenhouse, they want to throw you in prison.
They also want your guns, which is why Maxine Waters threatened Trump cabinet members, telling her unemployed base to make a crowd around them, intimidate them & likely assault them.
This is their vision for society so the next time the BLM hood rats riots, nobody can stop them & if you don’t vote as they want you to, they will burn your town down or attempt to burn it down, which has happened often over the past few years in the Twin Cities, Seattle, Portland, Chicago & Baltimore.
This doesn’t happen in Western Iowa, I wonder why. Why do think these riots don’t happen in Western Iowa Sam Seder?
Now for some comments on Chicago’s newest Mayor, a man who likely has a lot of security, but does not have the same sentiment towards regular folks in Chicago, which is likely why Illinois & Chicago especially are hemorrhaging population.
Of Illinois’ 102 counties, 64 of them (62.74%) had zero homicides in 2016. An additional 17 counties had ONE HOMICIDE. The violence is not everywhere, just places where Democrats rule. 64 of IL’s 102 counties (62.74%) had ZERO homicides in 2020. They had 11.41% (1,461,995) of the state’s population. 56 of IL’s 102 counties (54.9%) had ZERO homicides in 2019.
Thanks Dave, Thanks Clay & Buck. Very important admission by Chicago’s newest Mayor & we will touch on that again. Most of the violence in the very violent city of Chicago is in a handful of neighborhoods, not across the entire city & most of it is black people killing & assaulting black people in mostly-black neighborhoods full of children that never met daddy.
Some more information debunking the notion that the entire U.S. is having a murder epidemic. Most of lilly-white Montana is uber-safe, as is most of lilly-white Iowa.
Some months ago, I did a series of videos debunking a couple of divorcees, entitled Divorcees Sam Seder & Old Fart Rants are suddenly concerned about dead people in Buffalo, parts one through five.
Much of the information in those videos focuses on the % of arrestees & murder victims in a given state (using state police data) that were black, some of the numbers were eye-popping, but I also had a boatload of data on arrests.
In many jurisdictions, as the murder rate went up & violent crime went up or stayed at roughly the same rate – in many of those states the number of arrests for murder & violent crime plummeted.
This illustrates a Ferguson Effect; Regressive, mentally ill/bipolar Democrats intimidated the police or thinned their numbers so much that criminals were emboldened because they were far less likely to get caught, which is just what folks like George Soros, Rachael Rollins & Kim Foxx want.
Does the following surprise you? We’ve done this before, but we need to do it again in detail to thwart folks like the divorcee Sam Seder who has gobs of free time to sit on his fat ass all day on social media, reciting talking points.
In 2020, 72.41% (63 of 87) of MN’s counties had ZERO MURDERS & they had 25.75% of the MN population. In 2021, 67.81% (59 of 87) of MN’s counties had ZERO homicides & most of those counties were won by Donald Trump w/ 60% of the vote or more. Of Minnesota’s 87 counties, 62 of them (71.26%) had ZERO homicides in 2016. An additional 14 counties had ONE HOMICIDE.
Counties in Minnesota that voted for Donald Trump, 60% or more of the vote both in 2016 & 2020. Those counties from 2018-2020 had a murder rate of 0.980 per 100,000. A far cry from what is happening in the Twin Cities & a far cry below the MN state average.
2018-2020 criminal homicide rate (413 according to the FBI, 406 according to the MN Dept of Public Safety. You can see the difference in the data as some cases of “Murder/Non-negligent Manslaughter” were either ruled a “negligent manslaughter” case or a “justifiable homicide” down the road) = 2.435 per 100,000.
Criminal Homicide Rate (243 criminal homicides in that time frame) for Minneapolis/St. Paul (Twin Cities) 2018-2020 = 10.984 per 100,000. Criminal Homicide rate in Minnesota OUTSIDE of the Twin Cities 2018-2020 (170 homicides) = 1.152 per 100,000.
Again, homicide is not “increasing everywhere”, it is mainly cities run by Dumocrats that have catered to the #blacklivesmatter sociopaths – cities that have woke public schools, lots of folks on food stamps, lots of fatherless children & they are usually “diverse.”
In a given year, 2/3 to ¾ of Iowa’s counties have ZERO murders & there are a handful of cities that are responsible for most of it. Council Bluffs, Iowa City & Ames are three cities that have low murder rates, but when you combine them with Des Moines, Cedar Rapids, Fort Dodge, Waterloo & Davenport – that’s where the vast majority of murders in Iowa occur. It’s not spread out everywhere as uneducated, mentally-deficient folks like Sam Seder want you to think it is.
Of the counties in Wisconsin that voted 60% or more for Donald Trump in both 2016 & 2020: Those counties had a murder rate from 2018-2020 of 1.473 per 100,000. The problem area in Wisconsin is Milwaukee County & primarily Milwaukee City which has, you guessed it – a lot of black on black murder.
Outside that county, not so much. 32 of 72 counties in WI (44.44%) counties had ZERO homicides in 2021. They were 17.25% of the state’s population (1,017,265). Of Wisconsin’s 72 counties, 48 of them (66.66%) of them had ZERO homicides in 2017. An additional 13 counties had one homicide.
So, if the divorcee Sam Seder is really worried about dead folks, he needs to quit doing Google “research” & actually learn something. Find out where the vast majority of this murder is occurring & who is doing it.
I have news for the mentally ill idiot, it’s usually cities that have lots of young black males who grew up sans daddy & never finished school, murdering other young black males who had no father & failed to finish High School in cities that are dominated by the Demoncrat Party.
I will close with this & I intend to do a sequel to the video on your screen very soon. https://rumble.com/vcohr5-on-the-progressive-mean-republicans-so-vote-democrat-argument.html It illustrates in great detail the threats that Progressive Democrats have made & will stalemate any video Sam Seder uploads that purports to show Republicans wanting to get violent & using that as a “Vote Democrat” argument.
Now that the divorcee has been stalemated, we will debate why the most violent cities in America have lots of black on black murder & vote Democrat. Even a lot of so-called “Red States”, like Tennessee & Missouri & have high murder rates but it boils down to a handful of counties & those counties lean Democrat. They also have lots of blacks killing blacks. Memphis, the armpit of America is a perfect example of that.
Have a nice day & if you find this information worthy, please pass it around & educate your friends on the truth of murder in America – where it occurs, who is perpetrating it & who the victims are! http://freewebs.com/professor_enigma/black-lives-do-not-matter
The divorcee Sam Seder #samseder #majorityreport is afraid to debate my friend James Patrick Holding on The Impossible Faith. https://tektonics.org/lp/nowayjose.php Methinks the divorcee lacks confidence in that religion degree from a diploma mill
203
views
5
comments
If Divorcee Sam Seder were a city, he would be Boston
The relevant sources
https://www.heritage.org/crime-and-justice/commentary/meet-rachael-rollins-the-rogue-prosecutor-whose-policies-are-wreaking
https://web.archive.org/web/20190326183822/www.suffolkdistrictattorney.com/wp-content/uploads/2019/03/The-Rachael-Rollins-Policy-Memo.pdf
https://cde.ucr.cjis.gov/LATEST/webapp/#/pages/explorer/crime/crime-trend
Crime Index Offenses by Agency Type, Jurisdiction by Type, Murder & Nonnegligent Manslaughter (Boston) https://ma.beyond2020.com/ma_public/Dim/dimension.aspx
Shootings in Boston https://dashboard.boston.gov/t/Guest_Access_Enabled/views/BPDShootingsDashboard/ShootingsHeatMap?%3Adisplay_count=n&%3Aembed=y&%3AisGuestRedirectFromVizportal=y&%3Aorigin=viz_share_link&%3AshowAppBanner=false&%3AshowVizHome=n
Let us profile another Democrat-dominated city that has a rogue, George Soros prosecutor named Rachael Rollins & a bevy of black-on-black homicide – Boston.
According to the Massachusetts State Police, here are Boston’s number of murders 2016-2022: 49, 57, 56, 42, 58, 37 & 44. For aggravated assault, the same totals for 2016-2022: 2,910, 2,819, 2,818, 2,953, 3,251, 2,881 & 2,965.
Let us look at motor vehicle theft, which has spiked in a lot of Democrat-dominated cities (wait until I profile Philadelphia), this is another facet of the Democrat #INSURRECTION Motor Vehicle Thefts in Boston (this is MA state police data) 2016-2022: 1223, 1205, 1154, 986, 1293, 1164 & 1185.
The FBI has these totals for Boston murders 2015-2021: 38, 49, 57, 56, 42, 58 & 36. Pretty close to the state tally. The vast majority of murder offenders & murder victims in Boston are… Black. #blacklivesmatter
FBI data for aggravated assaults in Boston 2015-2021: 2873, 2910, 2819, 2818, 2944, 3193 & 2855. Same years for motor vehicle theft: 1279, 1223, 1205, 1154, 982, 1280 & 1154.
You can see massive surges during the Black Lives Matter/George Floyd protests in 2020, which cost a lot of people their lives, but it was part of the Regressive Democrat plan. In chess, the pawns go first & use those pawns to sow chaos in an effort to recreate America in their Marxist image.
Here are “shootings” in Boston from 2017-2022: 218, 174, 154, 233, 165, 143 & 25 so far in 2023, which is slightly ahead of last year’s pace. Again, we see a massive spike during the George Floyd/Black Lives Matter hissy fit, where Democrats attempted to defund the police & let criminals out of prison early so nobody could stop them when they riot in an attempt to intimidate America into voting the way they want.
“Vote the way we want or we’ll burn the place down.” Not in Iowa, you won’t. Not surprisingly in Boston, the vast majority of people who are shot are black & male. Boston is only 23.5% Black, according to the Census Bureau. More than four times as many Blacks were shot in Boston during that time frame than White folks.
Boston is no different from other Democrat-run cities struggling w/ fatherless children wreaking havoc. The main problem areas are Dorchester & Roxbury, no other neighborhood(s) is even close.
Now we get to the relic race trader, Rachael Rollins.
[Heritage Foundation Quote Begin] Have you ever wondered what it would be like to commit a crime, or maybe even multiple crimes, with no consequences? Wonder no more.
Even though Rollins wasn’t the first rogue district attorney backed by Soros (that dubious distinction goes to Kim Foxx of Chicago), she is still the grand dame of the rogue prosecutor movement when it comes to her nonprosecution practices.
As we wrote in the first major research paper on rogue prosecutors, when Rollins ran for district attorney in Boston, she hinted that she would refuse to prosecute entire categories of crimes. Once elected, Rollins published “The Rachael Rollins Policy Memo,” which lists 15 crimes “for which the default is to decline prosecuting.”
Despite the fact that those 15 crimes were passed by the state Legislature and signed into law by the governor, Rollins has unilaterally decreed that those 15 categories of crimes should either be “outright dismissed prior to arraignment” or, “where appropriate,” “diverted and treated as a civil infraction.”
A decision to prosecute someone for committing any of these crimes must be approved by a supervisor.
The “Rollins 15” are:
1) Trespassing
2) Shoplifting, including offenses that are essentially shoplifting, but charged as larceny
3) Larceny under $250.
4) Disorderly conduct.
5) Disturbing the peace.
6) Receiving stolen property.
7) Minor driving offenses, including operating with a suspended or revoked license.
8) Breaking and entering, where it is into a vacant property or is for the purpose of sleeping or seeking refuge from the cold and there is no actual damage to property.
9) Wanton or malicious destruction of property.
10) Threats (excluding domestic violence).
11) Minors in possession of alcohol.
12) Drug possession.
13) Drug possession with intent to distribute.
14) Resisting arrest where the only charge is resisting arrest.
15) Resisting arrest if the other charges include only charges that fall under the list of charges for which prosecution is declined.
In other words, in Boston, a violent career felon can break into your home, be in possession of cocaine, plan to distribute that cocaine to others, and resist arrest after you call the police, and all the charges will be “outright dismissed,” so long as the reason he broke into your house—and terrified your family—was because he wanted “to sleep” or was “seeking refuge” from the cold.” [Heritage Foundation Quote End]
If you do not believe me, see the Rollins Memo I linked to (many interwebs links to this memo have been taken down in an effort to keep this quiet, but it has been archived), Appendix D, page 65.
Just as California has facilitated a mob mentality & smash-and-grabs over their general refusal to prosecute petty larceny, if you are business owner in Boston, you may be subjected to several encounters with folks who will steal $225 worth of goods from your store & attempt to leave because if they get caught, there will likely be no consequences.
A mentally ill Democrat could be disturbing the peace in a drunken stupor & if he does not cooperate w/ the police, he will get arrested. Except, that case would likely not be prosecuted, which means there will be no repercussions for bad behavior, even if that person was a minor. Allowing that to slide will only lead to more crime.
Rollins has no problem declining prosecution of non-taxpayers who destroy public property, which those who actually do pay taxes will have to replace. This is one of the reasons places like Portland & New York City are becoming inhospitable. They are allowing petty or not so petty crimes go & it is snowballing.
You can receive stolen property & there will likely be no prosecution, which will not make a career criminal think twice about doing that over & over as there will be no consequences.
Again, this is part-and-parcel of the Democrat #INSURRECTION One of the facets is to defund the police or thin their ranks so they cannot pay attention to crimes that are not seriously violent. It also serves to keep police from doing proactive policing, so criminals in high crime neighborhoods are less likely to be caught as the police are nowhere to be found.
Another facet is to disarm (particularly Rural Americans) law-abiding citizens so they cannot defend themselves from BLM terrorists. Another prong of that is Kyle Rittenhouse. If a Kyle Rittenhouse tries to defend his community from domestic terrorists who want to burn it down, they try to put him in prison for murder.
Rollins is executing another facet of the Democrat #INSURRECTION allow petty & not so petty crime slide, which will lead to (it’s the “broken windows” policing policy) more crime.
They want you disarmed the next time BLM & Antifa riot; they want you put in jail if you defend yourself, they want the police defunded or effectively neutered & they want career criminals loose on the streets.
That my friends is what troglodytes like Rachael Rollins want. They want society destabilized, they want chaos, they want lawlessness. This is why people are leaving CA, NY, IL & MA. Vote w/ your feet my friends if you can & next November vote these Democrats who support these policies out of office.
http://freewebs.com/professor_enigma/covid-increase-homicides http://freewebs.com/professor_enigma/black-lives-do-not-matter
http://freewebs.com/professor_enigma/sam-seder-ilhan-omar-racism3
The divorcee Sam Seder #samseder #majorityreport is afraid to debate my friend James Patrick Holding on The Impossible Faith. https://tektonics.org/lp/nowayjose.php Methinks the divorcee lacks confidence in that religion degree from a diploma mill
106
views
1
comment

Divorcee Sam Seder wants to sell Rural America some Snake Oil
Divorcee Sam Seder wants to sell Rural America some Snake Oil called socialism, all it will cost you is your house, property, health care plan, car & your nest egg. The Democrat agenda is a war on the middle class & Rural America.
The entire beating can be viewed @ http://freewebs.com/professor_enigma/archive (make sure you click on the appropriate link as it may be archived at some point) & http://freewebs.com/professor_enigma/sam-seder-debunked
Most of Sam Seder's viewers have no property, no nest egg & nothing to lose. Rural Americans are much more likely to own their home, Sam's listeners do not.
How do you sell something to someone who has nothing to lose?
#samseder #majorityreport The divorcee Sam Seder is afraid to debate James Patrick Holding on The Impossible Faith. Sam Seder has no confidence in that religion degree from a diploma mill https://tektonics.org/lp/nowayjose.php
Sam Seder has already conceded to me: The most violent jurisdictions in America have lots of black on black homicide & they vote Democrat https://rumble.com/v2ahqta-divorcee-sam-seder-vs.-utubekookdetector-black-on-black-crime.html https://rumble.com/v19hafa-brian-tyler-cohen-is-not-very-bright.html
139
views
6
comments
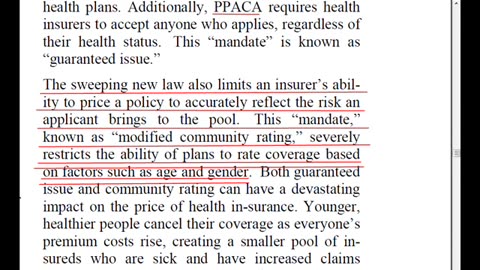
Disturbing trends in US health care spending
Health care in these United States was a train wreck long before ObamaCare, Barack Obama is just putting the final nail in the coffin
The background material
Health Care spending by category
http://www.cms.gov/Research-Statistics-Data-and-Systems/Statistics-Trends-and-Reports/NationalHealthExpendData/NationalHealthAccountsHistorical.html
http://www.cms.gov/Research-Statistics-Data-and-Systems/Statistics-Trends-and-Reports/NationalHealthExpendData/Downloads/quickref.pdf
http://www.cms.gov/Research-Statistics-Data-and-Systems/Statistics-Trends-and-Reports/NationalHealthExpendData/Downloads/NHE2011.zip
Health Care Mandates by state
http://www.cahi.org/article.asp?id=1114
https://web.archive.org/web/20080528124046/http://www.cahi.org/cahi_contents/resources/pdf/HealthInsuranceMandates2008.pdf
Originally uploaded on YouTube back in 2014 https://www.youtube.com/watch?v=fJn9hvxf3XA
28
views
2
comments
If Divorcee Sam Seder were a city, he would be Portland
https://cde.ucr.cjis.gov/LATEST/webapp/#/pages/explorer/crime/crime-trend
https://www.oregon.gov/osp/Pages/Uniform-Crime-Reporting-Data.aspx
https://www.oregon.gov/osp/programs/cjis/Pages/Uniform-Crime-Reporting.aspx
https://public.tableau.com/app/profile/portlandpolicebureau/viz/New_Monthly_Neighborhood/MonthlyOffenseTotals
Portland murders FBI 2015 = 10 * 2016 = 16 * 2017 = 26 * 2018 = 26 * 2019 = 29 * 2020 = 53 (George Floyd spike) 2021 = 83
Portland Murders Oregon State Police 2016 = 15 * 2017 = 23 * 2018 = 16 * 2019 no data available * 2020 = 49 * 2021 = 78 * 2022 = 78 (not all months available)
Portland Murders Portland Police Bureau 2016 = 16 * 2017 = 25 * 2018 = 26 * 2019 = 36 * 2020 = 57 * 2021 = 88 * 2022 = 97
Businesses are leaving Portland due to the toxic culture there & rampant crime
https://rumble.com/v2bwxde-walmart-flees-portland.html
https://rumble.com/v1xsnys-businesses-fleeing-portland.html
https://nypost.com/2023/03/06/walmart-to-close-remaining-portland-stores-as-city-faces-shoplifting-crisis/
https://www.dailymail.co.uk/news/article-11807717/Portland-business-owners-say-theyre-fleeing-city-en-masse-crime.html
https://www.kptv.com/2022/08/10/more-businesses-announce-theyre-leaving-downtown-portland/
Another metric that has become a major problem in many U.S. cities, motor vehicle theft. The Portland Police Dept. does not tell us how many of these were carjackings, so I am not sure how many of these cars were stolen w/ the occupant in it. For what it is worth, here are Portland’s motor vehicle thefts.
Portland Motor Vehicle Thefts 2016 = 5,244 * 2017 = 7,413 * 2018 = 7,010 * 2019 = 6,555 * 2020 = 6,563 * 2021 = 9,235 * 2022 = 11,093
Portland Assaults 2016 = 7,525 * 2017 = 8,054 * 2018 = 8,722 * 2019 = 9,101 * 2020 = 8,899 * 2021 = 9,571 * 2022 = 9,307
This is the real #INSURRECTION a Democrat #INSURRECTION
Defund the police or intimidate the police into doing no proactive police or thin their ranks to the point where they cannot do their job or be in the problem neighborhoods. This will result in fewer crimes being solved because the police show up long after the crime has been committed.
Take away guns from law-abiding citizens so they cannot defend themselves from BLM & Antifa terrorists. In addition to that, let violent criminals out of prison so they can harass & assault the citizenry.
If a Kyle Rittenhouse defends his community from fatherless BLM terrorists, try to put him in jail for murder.
When all that is accomplished, folks like Maxine Waters et al. will gin-up her unemployed base & the next time they riot there will be nobody around to stop them. They’ll tell America, “Give us the Marxist, Communist society we want, or we riot.”
This will not happen in Iowa, but it’s working in Portland & the good people & businesses are pulling up stakes & leaving.
Paul Joseph Watson’s video on Portland, which has unfortunately aged accurately https://www.youtube.com/watch?v=aSw79yRnDVs
Portland’s vaunted unemployed residents love defacing & burning courthouses https://thepostmillennial.com/watch-antifa-attacks-sets-fire-to-federal-courthouse-in-portland https://www.justice.gov/usao-or/pr/18-arrested-facing-federal-charges-after-weeknight-protests-federal-courthouse-portland https://www.dhs.gov/news/2020/07/27/myth-vs-fact-50-nights-violence-chaos-and-anarchy-portland-oregon https://apnews.com/article/virus-outbreak-ap-top-news-race-and-ethnicity-id-state-wire-or-state-wire-b57315d97dd2146c4a89b4636faa7b70 https://thepostmillennial.com/death-to-scotus-spray-painted-in-portland-during-second-night-of-riots https://pjmedia.com/news-and-politics/tyler-o-neil/2020/07/30/video-the-devastation-of-portlands-federal-courthouse-after-61-nights-of-violent-riots-n734356 https://thepostmillennial.com/antifa-starts-fire-outside-portland-courthouse-still-under-protective-barrier-from-blm-riots
This is the REAL #INSURRECTION a DEMOCRAT INSURRECTION http://freewebs.com/professor_enigma/black-lives-do-not-matter http://freewebs.com/professor_enigma/sam-seder-ilhan-omar-racism3 https://www.youtube.com/playlist?list=PLoA9J0G6s-6pat3gSUBf3nm1FOVF3z3Rg
#samseder #majorityreport The Divorcee Sam Seder is afraid to debate my friend James Patrick Holding on The Impossible Faith. https://tektonics.org/lp/nowayjose.php Methinks the divorcee has little confidence in that religion degree from a diploma mill
523
views

NAACP issues travel advisory to protect young black men
Recently, the NAACP issued a travel advisory for black Americans because Florida is like, Nazi Germany & stuff. Or maybe ISIS.
Dave Rubin & Ron DeSantis provide a salient response
https://rumble.com/v2f2s8k-desantis-hilarious-reaction-to-this-groups-warning-about-florida-dm-clips-r.html
https://rumble.com/v2ahqta-divorcee-sam-seder-vs.-utubekookdetector-black-on-black-crime.html
The ultimate Democrat Insurrection/Democrat Crime Wave Playlist (these videos are also up on Rumble, if you are on Rumble just search for the video name) https://www.youtube.com/playlist?list=PLoA9J0G6s-6pat3gSUBf3nm1FOVF3z3Rg http://freewebs.com/professor_enigma/covid-increase-homicides http://freewebs.com/professor_enigma/sam-seder-ilhan-omar-racism3
A young black man is far, far, far more likely to be murdered by another young black man than the police, a Confederate-flag waving redneck, a white militia member or any other demographic.
If the NAACP was REALLY concerned w/ the safety of Blacks & especially young black men, they would issue travel advisories for Democrat enclaves such as: Baltimore, Detroit, Cleveland, Jackson, Memphis, Birmingham, New Orleans, East St. Louis, St. Louis City, Atlanta, Bibb County (GA), Dougherty County (GA), Montgomery City, Baton Rouge, Flint (MI), Philadelphia, Pine Bluff (AR), Rochester (NY), Buffalo, Greensboro (NC), Durham (NC), Fayetteville (NC), Milwaukee, Dayton (OH), Danville (VA), Portsmouth (VA), Hampton (VA), Newport News (VA), Petersburg (VA), Norfolk (VA), Roanoke (VA), Richmond (VA), District of Columbia, Compton (CA), North Little Rock (AR), Wilmington (DE), Newark, Camden (NJ), Chicago, Gary (IN), Little Rock (AR), Houston, St. Paul, Minneapolis, Cincinnati, Indianapolis, Albuquerque, Louisville, Syracuse, Kansas City (MO), Oakland, Augusta/Richmond County (GA), Savannah (GA), & Shreveport.
The NAACP is beyond parody. When was the last time they issued a memo telling young black men to stick around & raise their kids or tell young women to keep their legs closed until they’re married?
Exit question: Why aren’t Asians murdering Asians in the hood? Maybe because they can afford to not live in the hood because Asian men are out earning every demographic in America & because daddy was around while the child grew up. Funny how that works, eh?
PS how many innocent black children minding their own business have been murdered in drive-by shootings & when was the last time the NAACP spilled any ink on that? #blacklivesmatter
541
views
4
comments

Sam Seder vs. sound logic (Sam Seder is 'divorced' from reality)
So, the divorcee Sam Seder was using one of his patented arguments to “prove” his opponents are really bad people & if he proves that, he wins…. Something.
The divorcee was having a hissy fit that biological males aren’t going to be able to hang out with little girls in the women’s restroom & mentioned that a bill in TN banning biological males from hanging out w/ minor females is getting the support of literal Nazis, like real Nazis & stuff.
Bad logic Stan Seder, bad logic old man. I could state that young black men tend to murder young black men at a rate much higher than any other demographic & they tend to drop out of school much more often than whites. All that is true & the KKK or any organization that you want to use to buttress your argument could concur w/ me, it doesn't mean much.
I could say 2+2 = 4 & every "hate org" in the universe would probably agree, doesn't mean those who believe 2+2 = 4 are Nazi's or anything else. The divorcee might say 2+2 equaling 4 is universally accepted & not a good example. I'm sure some Islamic extremists would concur w/ Karl Marx's incendiary comments about Jews, it doesn't make him (or you) an ally to Islam. You need to read some material from Douglas N. Walton.
Ted Kennedy opposed tax cuts “for the rich” & committed negligent manslaughter, Ted Kennedy also cheated on his wife. Stan Seder opposes tax cuts for people who make lots of money & have nuclear families, does that make Stan Seder a slimy fat kook like Ted Kennedy.
Bill Clinton has his share of issues, oddly divorce is not one of them – but it is for you, right Stan? Bill Clinton has issues & wants taxes raised on folks like my boss, who are millionaires. Stan Seder also supports that, uh-oh.
If Ron Paul & Bernie Sanders agree on a lot of foreign policy, that doesn't mean much because outside of that they have little in common. Even you're not dumb enough to make that leap old man.
If I visit a prison & interview a child molester who thinks those U.S. involvement in the war in the Ukraine is a great idea, does that mean those who support U.S. involvement in Ukraine are literal child molesters or just child molesters by proxy?
Another argument that Stan Seder likes to beat to death is the hypocrite argument. For example, he was flapping his jowls over Kim Davis, who has been divorced like Sam Seder has – he was whining about Kim Davis being against homosexual marriage, yet she has been divorced. “Hypocrite”, he autistically-repeated, while frothing at the mouth.
Are people not allowed to change their mind?
John Newton was knee-deep in the slave trade, but wrote the song Amazing Grace. So, can I repeat “hypocrite” over & over as my entire argument or would John Newton say if he were alive today, “Take your Risperdal & listen up. I changed my views, I realize slavery was evil & is evil, which is precisely why I turned away from it.”
HYPOCRITE! “You’re a hypocrite who opposes slavery, yet owned slaves, HYPOCRITE!!!” Only mentally-ill lunatics use such arguments.
What if I run into a guy who works for an organization that opposes drug abuse & wants to prohibit people from using & abusing fentanyl – and that guy turns out to be a drug addict himself. Can I just shout “HYPOCRITE” & win the argument or can I say, “Despite the fact that you are a drug-addled person, I can concur that drug abuse is a bad thing & nobody should do it.”
Here is another example: Let’s say we have a person who is divorced, has had sex outside of marriage numerous times & was never able to finish school in California. Let’ say this person has a few kids & one of them say they intend to have sex as a minor w/ numerous people at parties because they can get away w/ it.
Let’s say this person who is divorced & has had sex outside of marriage numerous times, never having had a successful relationship w/ the opposite gender of their species – let us say this person tells their kid, “You should not do that, you’re too immature to handle that.”
If the kid just shrieked, “HYPOCRITE!!!” like a raging lunatic, would that answer the argument or is there more to it than that? Even Stan Seder is starting to realize how dumb he sounds when he makes these arguments.
I could mention a majority of House Democrats voted for two rounds of Ronald Reagan’s personal income tax cuts, whenever Sam Seder whines about people who make more money than he does & folks who have actual property – if Sam Seder whines about those people getting tax cuts, I can mention those House Democrats under Reagan & autistically-repeat, “HYPOCRITE.”
If Bill Clinton was found out to be a predator, wait, never mind. Let’s say Bill Clinton was found to have used the “N” word in an unreleased speech & he used it many times. Let’s say Bill Clinton is a flaming racist, just work w/ me folks.
Would that negate the fact that he was a decent President, who worked w/ a GOP Congress better than George W. Bush did at controlling runaway spending? Would it negate the fact that Bill Clinton had a great economy during his presidency, or can I just shout “predator, cheated on his wife” or in my hypothetical, can I just shout “racist” instead of arguing?
If a former alcoholic father tells his currently alcoholic son, “You need to quit drinking, it is going to cause you major health issues down the line “ & the son screeches, “HYPOCRITE” like a moron, does that answer the argument or is it still true that drinking 14 cans of beer every night a bad health decision.
The father could currently be an alcoholic & that would still be sound advice, even if it is coming from a alcoholic.
I do have one more example: I remember in one of Stan Seder’s videos he was grinding his teeth over abortion & said about those having kids that were conceived because of rape: “If you want to have a rape baby, have a rape baby. If you do not want a rape baby, do not have it.”
Some of us turn 30 & drop these bad arguments, some of us are elderly, still using these bad arguments.
Let me try my version, we’ve all used this or saw this at one time or another: “If you don’t like a homosexual marriage, don’t have a homosexual marriage. If you don’t like cocaine, don’t use cocaine. If you don’t like abortion, don’t have an abortion. If you don’t like gas-guzzling SUVs, don’t own gas-guzzling SUVs.”
Or this one is really good, “if you don’t like slaves, don’t own slaves.” Oh wait, I guess there is a bit more to it than that. It’s not so simple a 3rd grader could understand it, why then does Stan Seder think he has it all figured out.
Sam Seder’s “reasoning” – and I am being generous calling it “reasoning” – his reasoning is oddly adolescent. Thanks for listening, Sam Seder uses some really dumb arguments & I am not sure how much of it is because he’s just a big, dumb goof who does not know any better & how much of it is catering to his “IQ of a vegetable” audience.
PS Sam Seder has already conceded to me on the fact that the most violent cities in America have lots of black on black homicide & they usually vote Democrat. https://rumble.com/v2ahqta-divorcee-sam-seder-vs.-utubekookdetector-black-on-black-crime.html http://freewebs.com/professor_enigma/covid-increase-homicides https://rumble.com/v19hafa-brian-tyler-cohen-is-not-very-bright.html I challenged him to a debate on this & he ran away, he’s scared to use his “internet show” to respond to me & I accept the old man’s concession.
PPS Stan Seder#sdamseder #majorityreport is afraid to debate James Patrick Holding on The Impossible Faith. https://tektonics.org/lp/nowayjose.php Methinks Stan has no confidence in that religion degree from a diploma mill.
PPPS Hillary Clinton opposed homosexual marriage for most of her career, yet the divorcee Sam Seder voted for her. Sam Seder is an advocate (just ask him!) for homosexuals. Can I just say, “Sam Seder voted for a hypocrite” & that settles it?
Sam Seder might ask me, “Did you not just say people can change their mind’? I would respond, “So, you must be negating a lot of the ‘logic’ you use when you employ the hypocrite argument, right Sam Seder?” [Sam nods his head in approval & then drops it in shame]
I would argue that John Newton changed his mind not to win an election, not to curry favor w/ Democrat voters, but because he was convicted of his sin & repented. Hillary Clinton only came out in favor of homosexual marriage AFTER she figured the majority of the public was in favor of it.
980
views
1
comment

Samantha Bee apologizes to a Nazi (Adolf Hitler)
Samantha Bee just apologized to a Nazi! Will she also apologize to a Stalinist? Every time (and this should give everyone plenty of opportunities) she plays the Nazi card or the race card, bring this up.
This is proof that Samantha Bee autistically-repeats “Nazi” & “racist”, not because there is a ring of truth to it, but because she wants to put her opponent on the defensive.
This groomer ended up stuffing her feet in her gullet. Shouldn’t this feckless runt be happy this “Nazi” was dying? Unless… her “Nazi” proclamations were B.S.
This was up on YouTube back in 2017, but Samantha Bee’s autistics flagged it for “hate speech” & it was taken down.
The background material
http://www.dailywire.com/news/14282/samantha-bee-deletes-video-saying-stage-4-brain-hank-berrien
https://twitter.com/iamsambee/status/839896277353639938
https://twitter.com/FullFrontalSamB/status/839894761708404741
https://archive.ph/wSpNb
https://archive.ph/T8Nd0
79
views
1
comment
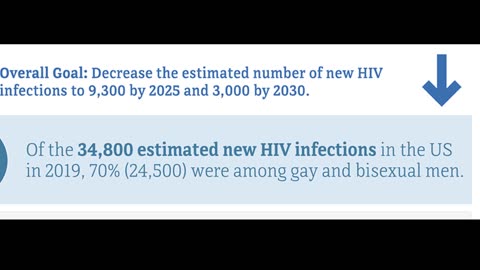
Divorcee Sam Seder just isn't very bright (COVID-19 vs. AIDS/HIV)
The relevant sources
My previous video on the topic of AIDS/HIV & its inextricable link to homosexuality & drug use https://rumble.com/vehq2b-what-if-democrats-treated-homosexuals-like-they-treat-taxpayers-and-gun-own.html
https://gis.cdc.gov/grasp/nchhstpatlas/charts.html?c=1&d=300&i=203&g=5000&yr=542&a=650&r=551&s=601&tc=801&roc=1101 (HIV diagnoses)
https://gis.cdc.gov/grasp/nchhstpatlas/charts.html?c=175&d=300&i=205&g=5000&yr=542&a=650&r=551&s=601&tc=801&roc=1101 (HIV prevalence)
https://gis.cdc.gov/grasp/nchhstpatlas/charts.html?c=143&d=300&i=204&g=5000&yr=542&a=650&r=551&s=601&tc=801&roc=1101 (HIV deaths)
https://gis.cdc.gov/grasp/nchhstpatlas/charts.html?c=2483&d=300&i=200&g=5000&yr=542&a=650&r=551&s=601&tc=801&roc=1101 (AIDS classifications)
https://gis.cdc.gov/grasp/nchhstpatlas/charts.html?c=328&d=300&i=201&g=5000&yr=542&a=650&r=551&s=601&tc=801&roc=1101 (AIDS deaths)
https://gis.cdc.gov/grasp/nchhstpatlas/charts.html?c=154&d=300&i=203&g=5000&yr=542&a=650&r=551&s=601&tc=801&roc=1100 (HIV diagnoses per 100,000)
https://gis.cdc.gov/grasp/nchhstpatlas/charts.html?c=2288&d=300&i=203&g=5000&yr=542&a=650&r=551&s=601&tc=804&roc=1101 (HIV diagnoses for category “Male-to-male sexual contact and injection drug use”)
https://gis.cdc.gov/grasp/nchhstpatlas/charts.html?c=6259&d=300&i=204&g=5000&yr=542&a=650&r=551&s=601&tc=804&roc=1101 (HIV deaths for category “Male-to-male sexual contact and injection drug use”)
https://gis.cdc.gov/grasp/nchhstpatlas/charts.html?c=153&d=300&i=204&g=5000&yr=542&a=650&r=551&s=601&tc=801&roc=1100 (HIV deaths per 100,000)
https://gis.cdc.gov/grasp/nchhstpatlas/charts.html?c=2710&d=300&i=201&g=5000&yr=542&a=650&r=551&s=601&tc=801&roc=1100 (AIDS deaths per 100,000)
https://gis.cdc.gov/grasp/nchhstpatlas/charts.html?c=6262&d=300&i=201&g=5000&yr=542&a=650&r=551&s=601&tc=804&roc=1101 (AIDS deaths for category “Male-to-male sexual contact and injection drug use”)
https://gis.cdc.gov/grasp/nchhstpatlas/charts.html?c=1853&d=300&i=202&g=5000&yr=542&a=650&r=551&s=601&tc=801&roc=1100 (AIDS prevalence per 100,000)
https://gis.cdc.gov/grasp/nchhstpatlas/charts.html?c=6263&d=300&i=202&g=5000&yr=542&a=650&r=551&s=601&tc=804&roc=1101 (AIDS prevalence “Male-to-male sexual contact and injection drug use”)
https://www.hiv.gov/hiv-basics/overview/data-and-trends/statistics/
Approximately 1.2 million people in the U.S. have HIV. About 13 percent of them don’t know it and need testing. HIV continues to have a disproportionate impact on certain populations, particularly racial and ethnic minorities and gay, bisexual, and other men who have sex with men.
That has nothing to do w/ racial bigotry, racism, stigma, dogma, homophobia or anything else, it has to do w/ culture & behavior. If you are engaging in unprotected, or sometimes even protected anal sex w/ men that you met a few minutes ago at a drug-fueled rave, do not be surprised when you end up w/ AIDS or HIV.
The acts that those groups engage in are more likely to end up transmitting those viruses, which is why it is mostly a homosexual phenomenon.
If you are sharing needles (HIV was called “The Junkie Flu” back in the late 1970s in New York City) in the process of killing yourself w/ drugs, you are far, far more likely to end up w/ AIDS/HIV than someone who is only having sex w/ his wife.
When Kathleen Sebelius marked an Anniversary of America’s fight against HIV, she mentioned Ryan White, which is very disingenuous at best, fallacious at worst.
Contracting HIV via a blood transfusion has been rare for a very long time – again, the most afflicted groups are homosexual men and/or drug addicts. Particularly Black Men.
Just as homicide is mostly a black male on black male phenomenon, so goes the AIDS/HIV virus. It’s not infecting every demographic at the same level, to say otherwise is beyond stupid or someone has an agenda.
In 2019, an estimated 34,800 new HIV infections occurred in the U.S. New HIV infections declined 8% from 37,800 in 2015 to 34,800 in 2019, after a period of general stability.
In 2020, 30,635 people received an HIV diagnosis in the U.S. and 6 dependent areas.
By age group, the annual number of HIV infections in 2019, compared with 2015, decreased among persons aged 13–24 and persons aged 45-54, but remained stable among all other age groups. In 2019, the rate was highest for persons aged 25-34, followed by the rate for persons aged 35-44.
By race/ethnicity, the annual number of HIV infections in 2019, compared with 2015, decreased among persons of multiple races, but remained stable for persons of all other races/ethnicities. In 2019, the highest rate was for Blacks/African American persons, followed by Hispanic/Latino persons and persons of multiple races.
By HIV transmission category, the annual number of HIV infections in 2019, compared with 2015, decreased among males with transmission attributed to male-to-male sexual contact, but remained stable among all other transmission categories. In 2019, the largest percentages of HIV infections were attributed to male-to-male sexual contact (66% overall and 81% among males.)
In 2020, homosexual men accounted for 71% of new HIV diagnoses in the United States. In 2020, homosexual Black/African American men accounted for 26% (8,064) of new HIV diagnoses and 39% of diagnoses among all homosexual men.
From 2015-19, the HIV infection rate was 14.06 per 100,000. AIDS “classifications” from 2015-2019 were 6.48 per 100,000. Hey Stan Seder, I have a question old man: Can we ban sodomy again in the interests of public health? Not sure how we would enforce it, but if you were consistent, you would be calling out this behavior on a regular basis, but you do not because it would undermine this bizarre LGBT obsession you have.
The divorcee Sam Seder thinks we can control a respiratory virus, yet the HIV infection rate (which has dropped significantly from the 2010-2014 time frame) remains a nagging problem & it is entirely preventable if the homosexual population would do what Raymond Burr did (a fine actor, by the way) & have one partner most of his life.
Either that or refrain from that sick, deviant behavior & get off the drugs or at least quit sharing needles. AIDS/HIV is very, very preventable, yet it remains & this moron thinks we can stop COVID-19 w/ ineffective lockdowns & other measures which are as useful as a millstone around your neck while treading water.
https://gis.cdc.gov/grasp/nchhstpatlas/charts.html?c=1641&d=300&i=203&g=5000&yr=542&a=650&r=551&s=601&tc=802&roc=1101 I estimate from CDC data that of the 191,401 HIV diagnoses from 2015-2019, (126,086) 65.87% were from men having sex w/ men. Be advised, the category of “Male-to-male sexual contact and injection drug use” is counting people who were engaging in BOTH of those behaviors while passing the AIDS virus to their partner. 65.87% of those diagnoses from homosexual men alone. That is disproportionate.
From 2015-2019 of the 144,661 folks who died from AIDS or HIV, (61,205) 42.3% of them were homosexual men. This does not include drug addicts sharing needles. This metric is much different from infections because the difference could be because of health factors.
Depending on how soon you were diagnosed & the CDC estimated that 13% of those infected, do not know it so if they are engaging in a lot of one-night stands, this may lead to a lot more deaths.
If the person infected was not very healthy at the time of infection & did not get diagnosed for many months vs. a person who was young & healthy, but was diagnosed relatively soon, that is likely the difference in the percentages.
https://gis.cdc.gov/grasp/nchhstpatlas/charts.html?c=3458&d=300&i=200&g=5000&yr=542&a=650&r=551&s=601&tc=802&roc=1101 From 2015-2019 of the 88,246 AIDS “classifications”, (48,484) 54.94% were men engaging in homosexual activity, this does not include persons who were injecting themselves w/ toxic waste & those who were engaging in homosexual activity & sharing needles at the same time.
Again, the divorcee Sam Seder #samseder #majorityreport believes we can control a respiratory virus that originated in China, but we apparently cannot control the behavior of irresponsible homosexual men and/or drug addicts.
Sam Seder is either delusional or a complete moron, I will allow you to make the decision.
STD infection rates for Gonorrhea, Congenital Syphilis, Early Non-Primary, Non-Secondary Syphilis & Primary and Secondary Syphilis have skyrocketed since 2015. The only outlier was Chlamydia, which was rising steadily since 2014 & took a break in 2020, which may only be because people were terrified by evil politicians into staying in their house because der COVID-19 virus was stalking everyone in the streets, killing indiscriminately, it was the harbinger of death, or so we were told.
https://gis.cdc.gov/grasp/nchhstpatlas/charts.html?c=388&d=303&i=207&g=5000&yr=542&a=651&r=551&s=601&tc=801&roc=1100 https://gis.cdc.gov/grasp/nchhstpatlas/charts.html?c=389&d=303&i=206&g=5000&yr=542&a=651&r=551&s=601&tc=801&roc=1100 https://gis.cdc.gov/grasp/nchhstpatlas/charts.html?c=112&d=303&i=214&g=5000&yr=542&a=651&r=551&s=601&tc=801&roc=1100 https://gis.cdc.gov/grasp/nchhstpatlas/charts.html?c=374&d=303&i=213&g=5000&yr=542&a=651&r=551&s=601&tc=801&roc=1100 https://gis.cdc.gov/grasp/nchhstpatlas/charts.html?c=17&d=303&i=208&g=5000&yr=542&a=651&r=551&s=601&tc=801&roc=1100
Lastly, what COVID-19 like hysterical mandates would the divorcee enact to control HIV or any other STD? Ban sodomy? Prison terms for sodomy? How about we shut down homosexual bars? Most Democrat Governors were fine shutting down tens of thousands of legitimate businesses because of a respiratory virus that has a survival rate of 99.9014% for those under 50, but HIV has no cure.
Can we shut down homosexual bars in an effort to eradicate HIV? Does he want me to pay the health care costs of irresponsible, mostly young men because they’re a degenerate?
I would wager Stan wouldn’t personally pay the health care costs of men in New York City living w/ HIV, but he’s ok with taxpayers in Iowa & 49 other states doing so.
When Sam Seder gets off his fat ass & eliminates HIV from existence, I will think about going along w/ him on his COVID-19 lockdowns & mandates, but not until then. I am also keeping my AR-15 & my .357 revolver, this is not a negotiation. Have a nice day & don’t thank me now for the slap down of the vacuous social media vegetable, Sam Seder.
BONUS: Anthony Fauci said that internet “Tinder hookups” were okay if you were willing to take the risk of getting an STD – but dining out in a restaurant is not kosher because you might get a respiratory virus that is totally curable & no big deal to 90% of the population. https://twitter.com/The_OtherET/status/1364368722555592704/photo/1 https://twitter.com/The_OtherET/status/1364368722555592704/photo/2
***
If the divorcee Sam Seder insists that lockdowns worked, see the data I compiled https://rumble.com/vju1d9-old-fart-rants-and-his-brown-teeth-cannot-defend-covid-19-lockdowns.html pitting the GOP trifectas that NEVER had a stay-at-home or shelter-in-place order vs. several jurisdictions clustered in the Northeast that had lockdowns for at least a year. If you have the IQ of a turnip, the data will surprise you.
Stan Seder is afraid to debate James Patrick Holding #samsederwontdebateJPH on The Impossible Faith. https://tektonics.org/lp/nowayjose.php Methinks Stan has no confidence in that religion degree from a diploma mill.
700
views
1
comment

Anthony Fauci takes a swing at Sen. Rand Paul, knocks himself out instead
Anthony Fauci takes a swing at Senator Rand Paul, Thomas Massie et al. & inadvertently knocks himself out. Fauci vs. Fauci on COVID-19 origins & gain of function research
Courtesy of Dan Bongino https://rumble.com/v2dk5xg-the-raccoon-dogs-did-it-ep.-1971-031723.html
123
views
1
comment

Kendrick Perkins is a dumb jock
Kendrick Perkins says, “Only 3 guys since 1990 have won the MVP not placing among the top 10 scorers.”
And that is supposed to prove what? What is so special about the top ten in scoring dummy?
I understand scoring is VERY important, after all, you can’t win a game if you do not score. However, I think (and this is coming from someone who used to love watching sports, but I found something better to waste my time on*) the 1990s Bulls would tell you, along w/ people like Chuck Noll (and yes, I know he is a football coach) – they would say, “Defense wins championships.”
So, let us undercut this mental midget Kendrick Perkins, who would’ve been slicing the lunch meat if he did not have basketball to fall back on.
I wonder why Kendrick picked 1990, what is special about that? Why the Top 10, because it’s a round number or perhaps that as high as this dumb jock can count?
If Kendrick is starting at 1990, Magic Johnson won the MVP that year & he was not in the top 10 in scoring & I knew that off the top of my head. Derp! Did Magic Johnson win the MVP that year because of a bias among the voters for an award that is basically subjective.
If I say “Wilt Chamberlain is the greatest basketball player of all-time” that is a subjective opinion, not an objective truth. If I say, “Wilt Chamberlain is the greatest scorer of all-time” because he had the highest scoring avg. in any season” that might be a bit closer, but basketball aficionados will point out that there was no 3-point line & that likely added to Wilt’s scoring because a 25-foot shot was worth the same as a dunk.
Someone may argue the other way, saying that the lane was narrower for the early years of Wilt’s career & he would not have scored as much with a wider lane & a 3-point line likely would’ve lowered Wilt’s scoring as he would have been able to kick it out to shooters on the perimeter after he was double-teamed. Some would argue Wilt overall would have been better with a good 3-point shooter on his team (like say, Jerry West wink wink) because that would have taken pressure off Wilt. Would Wilt want scoring titles or rings?
Magic Johnson also won the MVP in 1989 & was not among the top 10 in scoring. I think Kendrick deliberately – although that might be giving him credit for having enough intelligence to commit guile – he may have done this on purpose to avoid having one of the NBA’s all-time greats listed in his little rant. That would not have sat well w/ his audience.
Here are all the MVP winners from 1970 to 2022 who were not in the top ten in scoring. Willis Reed (1970), Dave Cowens (1973, white guy), Bill Walton (1978, another white guy who was not even close to the Top 20 in scoring that year), Magic Johnson (1989 & 1990), Dirk Nowitzki (2007), Steve Nash (2005 & 2006) & now Nikola Jokic (2021)
Incidentally, Magic & Steve Nash have some things in common, they both played an up-tempo style of ball & were both assist machines. Nash was the runaway leaders in assists in his two MVP seasons. Reminds me a bit of Magic Johnson.
In addition, Jokic was in the Top 10 in both assists & rebounds both of the previous two seasons, along with averaging over 26 points in both seasons he won the MVP. His all-around stats are right up there w/ Magic Johnson & Oscar Robertson. I am no basketball aficionado, but it seems Kendrick Perkins is a bit dense.
Dirk placed 11th in scoring in 2007 & was the only guy in the top 15 who shot better than 50% from the field. I understand this – if a player averages 8 points a game & shoots 70% from the field, he is less valuable from a scoring standpoint than a guy who shoots 48% from the field & averages 25 pts a game. Just so you know.
Now, let me look at the AVERAGE points per game of every person who placed 10th in scoring from 1970-2022 & see what we find. You could for example have a person who averages a high average like Dirk did & not finish in the top 10 – not because Dirk is mediocre, but because so many other players are lighting it up.
Here is one more thing to consider, Michael Jordan’s 3 highest scoring average seasons, the Bulls did NOT win the title. Jordan was a better player when he scored a bit less & did other things to assist his team.
Magic Johnson could’ve scored a lot more, but that is not his modus operandi. He was at his best pushing the ball up the middle of the floor & finding an open teammate streaking to the basket or spotting-up for an open jumper.
When the late, great Wilt Chamberlain won his two titles, he was scoring a LOT less in the two years he won the title because it was better for him to get teammates involved in the scoring, as well as doing what he always did well, guarding the basket & gobbling up rebounds.
Kendrick Perkins might be a good basketball player, but he doesn’t seem very bright. He’s lucky he had a lot of God-given talent, otherwise he would probably be changing the sheets at the Ramada Inn.
Now, the average points per game for every player finishing tenth in scoring from 1970-2022 was: 23.4, 23, 25.2, 23.8, 22.6, 21.9, 21, 22.3, 24.2, 23.6, 22.2, 23.8, 22.9, 23.7, 22.8, 23.6, 23.4, 23.9, 22.8, 24.8, 24.3, 23.9, 22.3, 22.8, 21.1, 21.9, 22.1, 21.8, 21.6, 21.1, 22.9, 23.9, 22.1, 22.5, 21.7, 23.9, 25.1, 24.6, 22.3, 22.6, 23.1, 23, 20.7, 19.4, 22.7, 21.7, 23.1, 25.3, 23.1, 25.6, 26.1, 26.4, 25.5
The cumulative average for all those years = 23.115 points per game & the Population Standard Deviation = 1.4157 points.
The year Dirk won the MVP but was not in the top 10 in scoring he averaged 24.6 points a game, more than one standard deviation above the average. Jokic averaged 26.4 points per game in 2021, well above the average & one standard deviation above it. Kendrick’s whining about them rings hollow, but I doubt he’s smart enough to figure this out.
Willis Reed averaged 21.7 points per game [within 1 SD], Dave Cowens averaged 20.5 points per game [not within 1 SD], Bill Walton averaged only 18.9 points [not even close to 1 SD], Magic Johnson averaged 22.5 & 22.3 [both within 1 SD] and Steve Nash averaged 15.5 & 18.8 points respectively, more than one standard deviation below the average.
The average 1980-2022 (starting the year the 3-point goal was put into play) was 23.118, not a statistically significant difference from the 1970-2022 average. The 1980-2022 Standard Deviation was 1.4708.
Kendrick’s whining about Dirk & Jokic winning the MVP do not hold up (especially the latter) under statistical scrutiny.
How about Bill Russell? He won 11 titles & appeared in the NBA finals 12 times. He won 5 MVP awards & is arguably the best team basketball player of all-time. He is the most decorated for sure.
In Bill’s 5 MVP seasons, he never even finished in the top 16 in scoring in any of those. Is there or was there a big conspiracy to shaft someone else in favor of a black man playing center for the Boston Celtics?
Kendrick might try to argue, “The Game has changed since then.”
It certainly has, the lane has been widened twice (most recently prior to the 1964-65 season) & the NBA instituted a 3-point goal in the 79-80 season.
One more thing before we move on: How about Wilt Chamberlain’s season where he averaged 50 points a game, over 12 points a game higher than 2nd place? He also led the league in rebounding, but never won the MVP award? Isn’t that a crock?
One more stat to look at, let us take a gander at en masse field goal percentage by season & see how the guys who never finished in the top 10 in scoring & won the MVP fared vs. the league average & the top 10 scorers per game. https://www.basketball-reference.com/leagues/NBA_stats_per_game.html (1970-2022)
1970 NBA FG% = 46%, Willis Reed FG% = 50.7% * 2 players in the top 10 were below the league avg. in FG%
1973 NBA FG% = 45.6 Dave Cowens = 45.2 * 3 players in the top were below the league FG% avg. IMO, “Tiny” Archibald should’ve won the MVP that year, but what do I know?
1978 NBA FG% avg. = 46.9 Bill Walton = 52.2 * 1 player among the top 10 average scorers was below the league FG % avg.
1989 NBA FG% avg. = 47.7 Magic Johnson = 50.9 * 2 players in the top were below the league FG% avg.
1990 NBA FG% avg. = 47.6% Magic Johnson = 48% * 0 players in the top 10 were below the NBA FG% avg. IMO, Barkley or Jordan should’ve won that MVP, but what do I know?
2005 NBA FG% avg. = 44.7% Steve Nash = 50.2 * 5 players in the top 10 were below the league avg. FG%. Would Kendrick Perkins argue w/ a straight face that Kobe, Iverson or LeBron deserved the MVP over Nash?
Nash was much more efficient in his shooting, he was a lot better from beyond the arc, much better at the line, averaged fewer turnovers per game than those 3 & was the league leader in assists.
Would Perkins want a guy that shoots 42% from the field to get 30 points or a guy who can scored 18 or so a game, shoot better than 50% & get a bunch of his teammates involved. For an NBA player, Perkins is quite dumb.
2006 NBA FG% avg. = 45.4 Steve Nash = 51.2 * 4 players (and one tied) in the top 10 were below the league FG% avg. This season IMO was not as strong as Nash’s previous, but he still led the league in assists, shot better from 3, from the field & from the line than LeBron, Kobe & Iverson.
He was a better all-around player than those guys that year. NOTE: Allen Iverson won the 2001 MVP, but it probably should have been given to Shaq. He shot a much better % from the field, as he gets higher percentage shots. He was less than one assist behind Iverson’s average, got almost 10 more rebounds & was a much bigger factor on team defense.
Were they racist when they failed to give Shaq the MVP or was Iverson just the popular flavor of the month? Moving onto 2007.
2007 NBA FG% avg. = 45.8% Dirk Nowitzki = 50.2% * 5 players in the top 10 were below the
league FG% avg & Dirk had the highest FG% in the top 11. How about that Kendrick Perkins?
2021 NBA FG% avg = 46.6% Nikola Jokic = 56.6% (among the top 12, Nikola was 3rd in FG%) * 2 players in the top 10 were below the league FG% avg. Jokic was 6th in the league in assists, 9th in rebounds & 22nd in steals. A pretty darn good all-around player.
In 1987, Bird averaged 4.2 more pts per game than Magic Johnson. Their FG% was better than 50%, just about the same, but Bird was much better from the line & beyond the arc. Bird had 2.9 more rebounds per game than Magic, but 5.6 fewer assists. Bird had 0.6 fewer turnovers per game. Did the white guy Larry Bird lose his 4th straight MVP to Magic Johnson because racism?
That concludes this detailed slapdown of the vacuous Kendrick Perkins, who would’ve been stuck in a crappy apartment drinking bottom shelf vodka if he did not have basketball to fall back on. Kind of like LeBron or Scottie Pippen. Have a nice day!
*College football was the last domino to fall for me. I quit watching everything else because it bores me to death & I can see how the powers-that-be would keep the idiots entertained w/ Netflix, Amazon & sports, while they destroy the country. I gave up everything but that even before the wokesters invaded. During the genesis of the COVID-19 plandemic, college football became an SJW event & I have not watched it since.
List of NBA MVP winners http://www.espn.com/nba/history/awards/_/id/33
NBA season-by-season scoring leaders or any other stat that trips your trigger https://www.nba.com/stats/leaders
408
views

Tucker Carlson Glenn Beck vs Jim Cramer, big bank climate cult, Equity/Diversity/Inclusion
Tucker Carlson destroys Jim Cramer (who was virtually having an orgasm over SVB) & the oobsession w/ Equity/Diversity & Inclusion. Glenn Beck has a message for normal Americans: Get your money OUT of the big banks. The SVB failure is a harbinger of things to come, 2023 is going to be a rough one economically. https://www.glennbeck.com/radio/its-time-to-get-your-money-out-of-these-7-big-banks-heres-why
The Equity/Diversity/Inclusion Racket is putting morons in charge -- I wouldn't trust them to plug in my toaster.
37
views

Divorcee Sam Seder had a hissy fit over Dave Rubin & Scott Adams telling the truth
Sam Seder had a hissy fit over Dave Rubin & Scott Adams telling the truth about young black men in cities run by Democrats
http://freewebs.com/professor_enigma/black-lives-do-not-matter
http://freewebs.com/professor_enigma/covid-increase-homicides
https://rumble.com/v2ahqta-divorcee-sam-seder-vs.-utubekookdetector-black-on-black-crime.html
https://www.youtube.com/playlist?list=PLoA9J0G6s-6pat3gSUBf3nm1FOVF3z3Rg My playlist that covers everything above & then some, it will flummox the fatherless #blacklivesmatter terrorists. It even includes data regarding where felons who commit a crime w/ a firearm, get their firearm (and a lot more data). Too lengthy to cover here.
Mark Dice’s video on Scott Adams https://www.youtube.com/watch?v=6klhrni7fYg
According to the FBI, the U.S. murder/non-negligent manslaughter rate 2016-2019 = 5.2 per 100,000.
The murder/non-negligent manslaughter rate 2020-21 = 6.8 per 100,000 – a staggering increase.
Keep in mind, the FBI usually adjusts the previous year total when the current report comes out.
Now, let us look at the NIBRS data & find out what % of murder victims & offenders (where we KNOW the race of the victim or perp) were Black 2016-19. That was 23,688 offenders & (13,385) 56.5% of them were Black. That is very disproportionate!
If a Progressive lunch meat slicer takes issue w/ that, I will point out that 23,688 is a pretty good sample size of all murder offenders. Deal w/ it and/or get an education at a parochial school, so you can learn something aside from autistically-reciting your pronouns.
From 2016-19 of the 21,695 victims where we KNOW the race of the victim, (11,193) 51.59% of the victims were Black. That is also very disproportionate!
From 2020-21, the NIBRS data gives us 23,034 murder offenders where we KNOW the race of the offender. Of those 23,034 offenders, (13,707) 59.5% of them were Black. That is also very disproportionate!!
From 2020-2021, the NIBRS data gives us 24,584 victims of murder & of those 24,584 victims, (14,382) 58.5% were Black.
The murder rate (per 100,000) was much, much higher in the latter (2020-2021) time frame than the former (2016-2019) & the % of murder victims that were Black & offenders that were Black increased substantially as well.
It appears that despite the whining of carnival barkers like the divorcee Stan Seder, #blacklivesmatter accomplished what they wanted to accomplish. They created more chaos, they pined for fragmented families because they hate nuclear families & they used millions of idiots as pawns in their game.
CHOP/CHAZ, as well as the riots in various cities a few years ago was no accident. It was orchestrated on purpose in an attempt to intimidate America into giving them what they want or else. In the meantime, young black men continued to murder other young black men (primarlily in cities run into the ground by the Party of FDR) & the rate of those assaults massively increased.
The result was a bigger pile of dead bodies. So yes, the massive increase in America’s murder rate over the last few years can be laid at the feet of #blacklivesmatter Progressive prosecutors & provocateurs like Maxine Waters, Chuck Schumer & “Fredo” Chris Cuomo, among others.
They will be safe in their ivory towers, as will I in 95%+ white, rural Iowa – but in chess, the pawns always go first.
From 2016-2019, the % of murder offenders (where the race of the offender is KNOWN) that were less than thirty years old was (13,535 of 23,276) 58.15%. That is sad.
From 2016-2019, the % of murder victims (where the race of the victim is KNOWN) that were less than thirty years old was (9,919 of 21,920) 45.25%.
From 2020-2021, the % of murder offenders (where the race of the offender is KNOWN) that were less than thirty years old was (13,217 of 22,655) 58.34%.
From 2020-2021, the % of murder victims (where the race of the offender is KNOWN) that were less than thirty years old was (11,512 of 24,878) 46.27%.
Those increases weren’t as massive in the latter (2020-21) time frame relative to the former (2016-2019), but the percentages are always staggering. Young black men removing young black men from the gene pool remains a massive problem in these United States as the homicide rate continues skyward.
Progressive Democrats & the voting blocs they pander to are very violent https://rumble.com/vcohr5-on-the-progressive-mean-republicans-so-vote-democrat-argument.html https://web.archive.org/web/20170619121651/https://www.youtube.com/watch?v=5Dm7yVTbJo4
Some more uncomfortable facts for the Divorcee Sam Seder
Now, let’s estimate a Black on Black & White on White homicide rate for 2004-18 using the data in my essay. I will give you the numbers until 2020 though.
Estimate “Black” population 2004-2020 = 37,343,675 * 38,015,046 * 38,686,418 * 39,357,788 * 40,029,160 * 40,700,531 * 41,371,902 * 41,676,132 * 41,980,362 * 42,284,593 * 42,588,823 * 42,893,053 * 43,197,283 * 43,501,513 * 43,805,744 * 44,109,974 * 44,414,204
Estimate “White Only, Not Hispanic or Latino” population 2004-2020 = 195,458,685 * 195,685,163 * 195,911,640 * 196,138,119 * 196,364,596 * 196,591,074 * 196,817,552 * 197,055,899 * 197,294,245 * 197,532,592 * 197,770,938 * 198,009,285 * 198,247,631 * 198,485,977 * 198,724,324 * 198,962,671 * 199,201,017
That gives us a Black-on-Black homicide rate of (2004-2018, single victim, single offender per 100,000) of 7.455, 7.849, 7.842, 7.381, 6.8, 6.397, 5.943, 5.871, 5.745, 5.309, 5.177, 5.548, 5.949, 6.038, 5.935 en masse total = 6.349 black on black homicides per 100,000 per year. Whoops!
Now let us run the numbers for whitey: That gives us a White-on-White homicide rate of (2004-2018, single victim, single offender per 100,000) of 1.597, 1.609, 1.544, 1.487, 1.546, 1.507, 1.410, 1.334, 1.324, 1.270, 1.258, 1.299, 1.439, 1.441, 1.347 en masse total = 1.427 White on White homicides per 100,000 per year. Whoops!
White Supremacy must be causing blacks to kill other blacks at a rate 4.449 times higher than Whites kill Whites. I would wager Asians barely register in homicide statistics, which is probably due to the fact that they usually have 2 parents in the home that don’t use meth, finished school & don’t let their kids run wild all over the streets after they did not finish their homework. They also didn’t tell their kids from infancy that they’re going to fail because of White Supremacy, they told them to keep their legs closed until they’re married, finish school, do your homework, stay off drugs & be a good citizen. Amazing how White Supremacy in America has been very good to Asian men, who earn many times more than the average Black person in America. Gee, I wonder why?
Let’s calculate the rate in which Blacks kill Whites (2004-2018, single victim, single offender homicides per 100,000), shall we? When I calculate this, I am using the race of the offender in this, not the victim, as Whites are such a higher % of the population. We’ll see if Blacks kill Whites at a higher or lower rate than Whites kill Blacks: 1.397, 1.357, 1.481, 1.438, 1.259, 1.115, 1.080, 1.074, 1.026, 0.967, 1.047, 1.165, 1.233, 1.324, 1.173 en masse total = 1.209 Black on White homicides per 100,000 per year. Blacks murder Whites at almost the same rate that Whites murder Whites.
Let us calculate the rate in which Whites kill Blacks (2004-2018, single victim, single offender homicides per 100,000): 0.116, 0.117, 0.106, 0.124, 0.117, 0.106, 0.110, 0.097, 0.097, 0.095, 0.094, 0.115, 0.122, 0.133, 0.117 en masse total = 0.111 White on Black homicides per 100,000 per year. White Supremacy is causing Black to kill Whites at a much higher rate than Whites kill Blacks. Again, it is also causing Asians to succeed in America, all while not butchering each other & gunning each other down in the hood.
http://freewebs.com/professor_enigma/covid-increase-homicides Sem Seder & his supporters will not take this challenge: Pick a state, any state & find one where the whitest, most pro-Trump counties (you have to use at least a 3-year block & you have to show your work, OUCH!) have a murder rate HIGHER than the state average, HIGHER than the national average & HIGHER than the most pro-Biden/pro-Hillary counties. I use 60% as my baseline as to whether a county is very “pro” one party or the other. I usually cover a few election cycles around the 3-year block of data to solidify my point & may look at who they elect to State House Districts to buttress my position.
If your list of pro-Trump counties is 0.4% of the state’s population, I will not be impressed, so for once in your life Stan Seder, do some original research that is not sloppy. Good luck!
Second challenge: Find me as many Democrat-dominated counties (60% or more of the vote for Biden & Hillary) that have 50,000 or more people that are Black plurality or majority that have murder rates LOWER than the national average.
#blacklivesmatter accomplished what it wanted in the wake of the George Floyd incident. They are using millions of pawns who have been hoodwinked by the soft bigotry of low expectations as pawns in their game to create chaos in society, trying to intimidate the police & the populace into giving them what they want or they’ll riot.
America, you have been warned!
270
views

Dave Rubin humiliates beta "male" Jimmy Kimmel (vis-à-vis Jeffrey Epstein)
For some odd reason, Jimmy Kimmel is laughing (it's a nervous laugh to mask anger) & pouting over the fact that some of the people who assisted Jeffrey Epstein & Ghislaine Maxwell in trafficking children so fat, old men could abuse them -- might get caught.
Would Dhimmi Kibble say the same thing about those involved in the "Insurrection" or people who ratted out others for the Gestapo? How about people who funded Hitler's war machine?
It just seems odd that the old man is fuming over Epstein's co-conspirators ending up in prison, where they belong.
85
views
1
comment

Joe Biden's Civil Rights half-truths, fabrications and outright lies
There are a lot of compilations out there chronicling Joe Biden's oft-repeated yarns concerning his role in the "civil rights movement." Like a man claiming stolen valor in great military battles he never took part in, so goes Joe Biden's tall tales about his participation (or lack thereof) in the civil rights movement.
23
views

Divorcee Sam Seder vs. "Flag Humper" Bernie Sanders
https://www.congress.gov/bill/117th-congress/senate-concurrent-resolution/14/text/pcs (see Section 1102)
For an anti-war Democrat who is “worried” about the deficit & the national debt, Parkay Teeth Bernie Sanders sure loves himself some defense spending.
Here are the “appropriate levels of new budget authority and outlays for fiscal years 2022 through 2031” for national defense in the legislation sponsored by Parkay Teeth Bernie Sanders.
Fiscal year 2022:
(A) New budget authority, $765,704,000,000.
(B) Outlays, $763,985,000,000.
Fiscal year 2023:
(A) New budget authority, $782,245,000,000.
(B) Outlays, $770,192,000,000.
Fiscal year 2024:
(A) New budget authority, $799,520,000,000.
(B) Outlays, $776,297,000,000.
Fiscal year 2025:
(A) New budget authority, $817,214,000,000.
(B) Outlays, $794,946,000,000.
Fiscal year 2026:
(A) New budget authority, $835,351,000,000.
(B) Outlays, $810,367,000,000.
Fiscal year 2027:
(A) New budget authority, $843,873,000,000.
(B) Outlays, $821,610,000,000.
Fiscal year 2028:
(A) New budget authority, $852,499,000,000.
(B) Outlays, $836,561,000,000.
Fiscal year 2029:
(A) New budget authority, $861,191,000,000.
(B) Outlays, $834,592,000,000.
Fiscal year 2030:
(A) New budget authority, $870,003,000,000.
(B) Outlays, $848,928,000,000.
Fiscal year 2031:
(A) New budget authority, $880,156,000,000.
(B) Outlays, $858,990,000,000.
Want some more in-depth data on our coming fiscal calamity? See the following https://rumble.com/v24p838-senator-rand-paul-raises-the-alarm-on-our-coming-fiscal-calamity.html http://freewebs.com/professor_enigma/sam-seder-aoc-tax-the-rich https://rumble.com/vdk8bz-so-youre-nostalgic-for-the-1950s.html https://rumble.com/v1mjo9w-tell-your-democrat-friends-take-the-bernie-sanders-tax-hike-challenge.html
#samseder #majorityreport #samsederwontdebateJPH The Divorcee Sam Seder is afraid to debate James Patrick Holding on The Impossible Faith. https://tektonics.org/lp/nowayjose.php Methinks Stan Seder has no confidence in his religion degree from a diploma mill
54
views
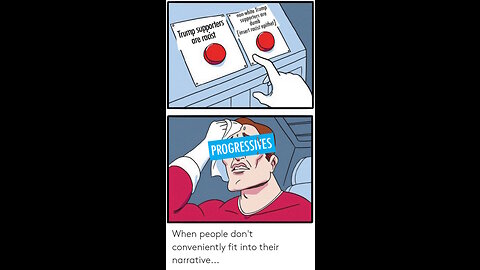
Sam Seder supporter (MDL61) gets PWNED
https://rumble.com/user/MDL61 Here is where he’s posting https://rumble.com/v28rvib-mrlive-the-2023-state-of-the-union-and-analysis-2723.html#comment-195531884 https://rumble.com/v28rvib-mrlive-the-2023-state-of-the-union-and-analysis-2723.html#comment-199596114 https://rumble.com/v28rvib-mrlive-the-2023-state-of-the-union-and-analysis-2723.html#comment-200034690 https://rumble.com/v28rvib-mrlive-the-2023-state-of-the-union-and-analysis-2723.html#comment-200052582 https://rumble.com/v28rvib-mrlive-the-2023-state-of-the-union-and-analysis-2723.html#comment-200087890 https://rumble.com/v28rvib-mrlive-the-2023-state-of-the-union-and-analysis-2723.html#comment-200402724 https://rumble.com/v28rvib-mrlive-the-2023-state-of-the-union-and-analysis-2723.html#comment-201033994 These are all archived, just in case he deletes his comments as he did one other time. https://web.archive.org/web/20230305190119/https://rumble.com/v28rvib-mrlive-the-2023-state-of-the-union-and-analysis-2723.html https://archive.ph/
https://rumble.com/v2ahqta-divorcee-sam-seder-vs.-utubekookdetector-black-on-black-crime.html The most violent cities in America have lots of black on black homicide & they typically vote Democrat.
One of Sam Seder’s favorite tactics is to find a “Republican”, a “Conservative” or “Libertarian” (false flag caller most likely) & “defeat them in a debate”, thus proving his Marxist paradigm is correct.
I’ve tried engaging some of the Democrat sheep, it seems they are all the same. They’re good at insults that 8-year-olds could use, but not much for details. I found a Sam Seder supporter who is adept at these boilerplate talking points & that is it. Enjoy!
Sam Seder #samseder #majorityreport is afraid to debate James Patrick Holding on The Impossible Faith. https://tektonics.org/lp/nowayjose.php Methinks Stan Seder has no confidence in that religion degree from a diploma mill. #samsederwontdebateJPH
380
views
1
comment

Larry Elder played my call on Ukraine 3/16/22
Larry Elder played my call opposing U.S. involvement in the Russian/Ukraine conflict. George W. Bush was asked often, "Do you have an exit strategy for Iraq?"
Do Joe Biden & this Congress have an exit strategy or are we tossing money into a furnace until "Russia loses"?
Ron Paul changed my thinking on foreign policy back in late 2009, I caucused for him at the Iowa Caucus 2012 & for his son, Senator Rand Paul in 2016. When it comes to U.S. foreign policy, less is certainly more.
We need to leave NATO, if there's a Ron Paul type non-interventionist running in 2024, get to your caucus, get to your primary & support them. That goes double for any Senate & House race in 2024.
40
views