

Two Brian Tyler Cohen supporters (red state/blue state homicide) get squashed
Here are the debates I recently had w/ 2 people who were autistically-reciting talking points that Brian Tyler Cohen pulled out of someone's rear end about a year ago
***
L. Fenton:
Here is where he is commenting https://www.youtube.com/watch?v=F777uad8yFI Here is his channel https://www.youtube.com/channel/UCtppMa6_VPfhXb2VpvoNqVw
Here is the FENTON Debate [any editorial comments I add will be bracketed]
UTubeKookDetector
Pinned by UTubeKookDetector
UTubeKookDetector
1 year ago
#stopthesteal https://www.freewebs.com/professor_enigma/democrat-election-fraud
1
UTubeKookDetector
·
L.Fenton
L.Fenton
1 year ago
Did you seriously just ❤️ your own comment?😒
UTubeKookDetector
UTubeKookDetector
1 year ago (edited)
@L.Fenton https://rumble.com/vcnn9f-mcstupidx-makes-a-stunning-admission.html Thanks for passing that on! ;) https://rumble.com/vciw0p-old-fart-rants-exposed-in-his-own-words.html if you like this one better, you can pass it along instead. Thanks little feller!
1
UTubeKookDetector
UTubeKookDetector
9 months ago
@L.Fenton The most violent cities in America vote Democrat https://www.facebook.com/permalink.php?story_fbid=2909861932583537&id=1400591836843895 They also have lots of black on black homicide, lots of fatherless children & lots of working age folks taking a break from the labor force
1
UTubeKookDetector
UTubeKookDetector
2 weeks ago
@L.Fenton "Republican Voter Suppression" talking points debunked! https://rumble.com/v24tyd2-divorcee-sam-seder-debunked-on-republican-voter-suppression.html
1
L.Fenton
L.Fenton
2 weeks ago
@UTubeKookDetector Actually that's proven to be mostly untrue.
L.Fenton
L.Fenton
2 weeks ago
@UTubeKookDetector That proves nothing.
UTubeKookDetector
UTubeKookDetector
3 hours ago
@L.Fenton Actually, I have all the data in my featured video, so I will record your responses, bring your "A" game. Here is a sample, see if you can undermine i.
How about Missouri? Criminal Homicide Rate 2018-2020 (1,898 criminal homicides according to the FBI, 1,912 criminal homicides according to the MO State Highway Patrol) = 10.304 per 100,000 (FBI) & 10.380 per 100,000.
How about St. Louis City & Kansas City, Missouri? Criminal Homicide Rate 2018-2020 (1,110 criminal homicides) = 45.995 per 100,000. Criminal Homicide Rate in Missouri OUTSIDE of St. Louis City & Kansas City (788 criminal homicides if you use the FBI total) = 4.923 per 100,000 (5.010 per 100,000 using MO State Highway Patrol Data). Have you seen this movie before?
the counties in MO that voted 66% or more for Trump in 2016 & 2020: Number of Homicides for those counties 2018-2020 = 122
Cumulative Population for those counties 2018-2020 = 6,724,722
Homicide Rate for the counties above 2018-2020 = 1.814 per 100,000. That is much lower than the homicide rate in MO outside of St. Louis City & Kansas City. The uber-Republican, Donald Trump counties in MO are not spiking homicide rates there.
you will have to do much better than your the one sentence replies that you can get away with at the bar. Good luck!
1
L.Fenton
L.Fenton
2 hours ago
@UTubeKookDetector What's all those supposed to prove? How is this relevant to the topic here?
And did you seriously heart your own comments? That's just cringe.
UTubeKookDetector
UTubeKookDetector
2 hours ago
@L.Fenton Keep going, I am recording your comments. You already whined about me "hearting" my own comments. I do it to make the autistics mad, they have such a thin skin. This is my channel Cletus, I choose what is relevant here -- you did come over & comment, right? I did challenged you on this & you finally replied, right? Now since you have nothing detailed to say, nothing even remotely astute to say I am doing to you what I have done to many others -- I am picking a topic for you. Capiche? Here's http://freewebs.com/professor_enigma/covid-increase-homicides (or see my featured vid) another sampling of my data:
How about Minnesota? 2018-2020 criminal homicide rate (413 according to the FBI, 406 according to the MN Dept of Public Safety. You can see the difference in the data as some cases of “Murder/Non-negligent Manslaughter” were either ruled a “negligent manslaughter” case or a “justifiable homicide” down the road) = 2.435 per 100,000.
Criminal Homicide Rate (243 criminal homicides in that time frame) for Minneapolis/St. Paul (Twin Cities) 2018-2020 = 10.984 per 100,000. Criminal Homicide rate in Minnesota OUTSIDE of the Twin Cities 2018-2020 (170 homicides) = 1.152 per 100,000. The Twin Cities overwhelmingly vote Democrat. I have done this examination of many states.
Again, homicide is not “increasing everywhere”, it is mainly cities run by Dumocrats that have catered to the #blacklivesmatter sociopaths – cities that have woke public schools, lots of folks on food stamps, lots of fatherless children & they are usually “diverse.”
1
L.Fenton
L.Fenton
1 hour ago
@UTubeKookDetector Why bother record my comments?
That's pretty piss reason to heart them tbh. Disappointing motive really. What have autistic ppl done to you? That's ablelist.
According to 2019 FBI data, 7 out of 10 states with the highest per-capita rates of violent crime voted Republican in the 2020 election. In contrast, seven out of ten states with the lowest rates voted Democrat.
[already debunked these talking points here http://freewebs.com/professor_enigma/covid-increase-homicides & https://rumble.com/v2ahqta-divorcee-sam-seder-vs.-utubekookdetector-black-on-black-crime.html There are a slew of states & cities that have high murder rates & the vast majority of that is black on black]
Did you take into account that your Statistics could be complicated by the fact that higher crime rates may reflect greater reporting rather than a higher incidence of crime?
[a few unreported violent crime incidents in Western rural Iowa would result in a much higher rate, a few missed murders or violent crime incidents in Chicago or Atlanta would not even be a rounding error, so that doesn’t help your high crime areas. Nice try though]
Do you even know what woke means? Cos if you did you wouldn't see it as a bad thing?
You're also stereotyping. [stating facts such as, “Young black men tend to murder young black men disproportionately isn’t a stereotype, it’s a fact as I have demonstrated]
UTubeKookDetector
UTubeKookDetector
1 hour ago
@L.Fenton You literally repeated the argument I debunked in my featured video, you do realize that? I know you just went to Google & Found this a moment ago. So, what counties in Missouri, Tennessee or Illinois are the most violent? ALL those states have homicide rates well above the national average. You think the entire state is homogeneous? I took the counties that voted 60% more more for Trump twice & the counties that voted 60% more more for Biden & Hillary, what do think I found (Those counties are outliers as their support for a candidate was much higher than what those candidates obtained nationally)?
What races do you think are most commonly arrested for homicide in those states & what races do you think are disproportionately the victims of homicide in those states? Do tell, or you can try & google an answer, since I know that is exactly what you're doing. We'll see what he comes up with folks.
1
L.Fenton
L.Fenton
1 hour ago
@UTubeKookDetector Clearly you didn't factor the systemic racism involved towards minorities. [now we have the catch-all argument, “Racism” which trumps anything I say]
You didn't debunk anything. Sure those statistics are up to date and non-partisan?
L.Fenton
L.Fenton
1 hour ago
@UTubeKookDetector Clearly you didn't factor the systemic racism involved towards minorities.
You didn't debunk anything. Sure those statistics are up to date and non-partisan? [you can’t debunk my data & you will not try, this is just a diversion on your part to avoid having to do nay research]
UTubeKookDetector
UTubeKookDetector
56 minutes ago
@L.Fenton So, you have no county level data on homicide in states like MO, TN or IL? Actually, I did not examine every county in TN because they make it very difficult. They do not collate their data by county, with each reporting jurisdiction underneath, that would've taken days as TN has a lot of GOP-leaning counties. I did however, do that for their two most Dumocrat counties, Shelby & Davidson.
The other two, I have gobs of data on & they both indicated that the counties that voted 60% or more for Biden/Shillary have sky high homicide rates & the very pro-Trump counties have homicide rates well below the national avg.
You say, "Sure those statistics are up to date and non-partisan?" He's looking for a way out kids, he's trying to find a way to declare all my data (which comes from the FBI, various state agencies & even some local PD reports, I try to get 3 sources of info) biased, which will allow him tpo declare victory & avoid having to defend himself.
Then he plays the race card, the all-encompassing, get out of jail free card, which also allows someone to avoid debate. I have news for you little man, blacks have had a homicide fatality rate (by "high" I mean it is typically more than 2X the national average) for over a century. Prior to or after the Civil Rights Act, it has always been a problem.
Which counties in MN do you think have the highest homicide rates? The ones that voted 60% or more for Trump, or the ones that voted 60% or more for Biden/Shillary? Run that data for me. I am giving him several chances to defend himself so he can't claim that I stifled him later.
UTubeKookDetector
UTubeKookDetector
30 minutes ago
@L.Fenton Where did you go Cletus, did you lose your talking points rolodex? Doing google research? Hello? Concede the argument or try again. I am waiting
L.Fenton
L.Fenton
19 minutes ago
@UTubeKookDetector You didn't answer any of the questions. So you're not non-partisan.
L.Fenton
L.Fenton
18 minutes ago
@UTubeKookDetector WTF are you talking about? Who's Cetus? This is just cringe at this.
L.Fenton
L.Fenton
18 minutes ago (edited)
@UTubeKookDetector WTF are you talking about? Who's Cetus? This is just cringe.
UTubeKookDetector
UTubeKookDetector
8 minutes ago
@L.Fenton Thanks for the bulletin board material, might want to check my Rumble channel in a day or two, I will have our debate up. I think it's apparent you have pretty much thrown in the towel. Thanks again Cooter!
[And that’s it folks, he had ample opportunity to defend himself & cannot do it, although they repeat the same exact talking point Brian Tyler Cohen repeated a few years ago, which I have debunked https://rumble.com/v19hafa-brian-tyler-cohen-is-not-very-bright.html ]
***
Wasp Wrap:
And another jackass https://www.youtube.com/channel/UCUHJ7XAeCvyfLL_U1upAeiQ
Here are the videos he is commenting on https://www.youtube.com/watch?v=f7cYwHsdfTA & https://www.youtube.com/watch?v=uIVhXVAaMJo
HERE IS THE WASP DEBATE
SUsyCar FISCHER stellmach
SUsyCar FISCHER stellmach
7 months ago
Vielen Dank für Eure Videos 👍🙏
1
UTubeKookDetector
·
UTubeKookDetector
UTubeKookDetector
7 months ago
You are most welcome!
wasp wrap
wasp wrap
2 hours ago
@UTubeKookDetector they’re shit
1
UTubeKookDetector
UTubeKookDetector
2 hours ago
@wasp wrap I am recording your comments: Here is a sampling of my data. TN has a homicide rate much higher than the national average, but most of the homicides is occurring in two counties that are run by Democrats -- Shelby & Davidson. Outside of those two counties, TN has a homicide rate below the national average. Where did you go to school, or rather -- where did you drop out from?
UTubeKookDetector
UTubeKookDetector
2 hours ago
@wasp wrap Still waiting little man, it seems you are deleting some of your comments?
wasp wrap
wasp wrap
2 hours ago
@UTubeKookDetector if you really want to talk about city crime, why do red cities like Bakersfield, Fresno, Tulsa, and Jacksonville for example have higher crime then the rights punching bags NYC, LA, and Chicago per capita. New Jersey, Massachusetts, California, and New York are some of the safest states relating to gun violence, and violent crime. Even with cities such as Camden, Boston, LA, and NYC. For instance, the top 5 most dangerous city’s are all in red states. It’s amusing how Republicans love to talk about crime, they can’t even manage their cities, even blue cities, you’d think they could still do something to help, and the rest of red states aren’t better. New York is the ninth safest state with a city the right says is horrible, NYC. New York, California, and Massachusetts have some of the strictest gun laws, and are some of the safest, while South Carolina, Tennessee, and Mississippi have some of the loosest gun laws, pretty unsafe. If you want to use county arguments, don’t bother, you can’t escape the fact that red states suck at dealing with crime in their cities. fun fact, Wyoming, a state with some of the loosest gun laws in the nation is leading per capita with the most gun deaths. Where the fuck are their major cities.
[Tulsa, Oklahoma is in a county that is lean-Republican, but I would wager the city of Tulsa is lean-Democrat, although I have not been able to locate the precinct level voting data & neither has Wasp, he is tossing that out as a diversion]
1
UTubeKookDetector
UTubeKookDetector
1 hour ago
@wasp wrap You seem to have deleted your opening comment, I recorded it before you deep-sixed it. Here is a sampling of the data from the 2nd link in my channel banner. [his opening comment is only visible if you click “recent comments” as YouTube tends to hide profanity]
The following cities are all Democrat enclaves & they averaged (from 2018-2020_) more than 14 homicides PER DAY : Baltimore, Detroit, Stockton (CA), Cleveland, Jackson, Memphis, Birmingham, New Orleans, East St. Louis, St. Louis City, Atlanta, Bibb County (GA), Dougherty County (GA), Montgomery City, Baton Rouge, Flint (MI), Philadelphia, Pine Bluff (AR), Rochester (NY), Buffalo, Greensboro (NC), Durham (NC), Fayetteville (NC), Milwaukee, Dayton (OH), Danville (VA), Portsmouth (VA), Hampton (VA), Newport News (VA), Petersburg (VA), Norfolk (VA), Roanoke (VA), Richmond (VA), District of Columbia, Compton (CA), North Little Rock (AR), Wilmington (DE), Newark, Camden (NJ), Chicago, Gary (IN) & Little Rock (AR) cumulative homicides 2018-2020 = 11,964
Some of the worst dishonorable mentions: Houston, St. Paul, Minneapolis, Cincinnati, Indianapolis, Albuquerque, Louisville, Syracuse, Kansas City (MO), Oakland, Augusta/Richmond County (GA), Savannah (GA), & Shreveport cumulative homicides 2018-2020 = 3,623
Adding both those groups together gives us a cumulative homicide tally = 15,587. The FBI says there were 54,613 acts of criminal homicide committed 2018-2020. Those cities had 28.54% of all homicides 2018-2020. Those cities were only 6.354% of the entire U.S. population 2018-2020 & had a staggering homicide rate of 24.856 per 100,000. Again, the U.S. homicide rate from 2018-2020 was 5.533 per 100,000. Their homicide rate was collectively >449% HIGHER than the U.S. average.
Since you brought up Tulsa, I have a video chronicling Oklahoma & homicide, which debunks your cut-and-paste data. https://www.youtube.com/watch?v=ABPax6-ZU1M Most of OK's homicide issues can be drilled-down to 2 counties (Tulsa & Oklahoma).
What about Illinois, it is a high homicide state, what does the data there tell us?
How about Illinois? 2018-2020 criminal homicide rate (FBI says 2,867 homicides, IL State Police say 2,901) = 7.5 per 100,000.
East St. Louis & Chicago criminal homicide rate (1,937 criminal homicides) 2018-2020 = 23.391 per 100,000. IL homicide rate OUTSIDE of Chicago & East St. Louis (930 homicides in IL OUTSIDE those cities) 2018-2020 = 3.105 per 100,000.
Let’s find all the counties in IL that Donald Trump won with 60% of the vote or > in 2016 & 2020.
Those counties are: [redacted, due to the list being insanely long] Cumulative Homicides for those counties 2018-2020 = 76
Cumulative Population (due to state data differing so much both ways from Census Data, I went w/ the latter) for those counties 2018-2020 = 3,935,893
Homicide Rate 2018-2020 for those counties = 1.930 per 100,000. This is much lower than the IL total en masse & much lower than the homicide rate in IL OUTSIDE of Chicago & E. St. Louis. Again, the most violent areas of America tend to be diverse, lots of fatherless children, lots of black-on-black homicide, lots of food stamps & lots of kids dropping out of school. Next...
UTubeKookDetector
UTubeKookDetector
1 hour ago
@wasp wrap Wyoming has one of the lowest homicide rates in the nation, dead is dead whether its a homicide by knife, car, gun or personal weapons. You are segregating gun violence to make it seem high, when fewer people per 100,000 are murdered in Wyoming in a typical year, relative to the national average. I've seen that argument before, it's autistically-repeated a lot. Iowa has one of the lowest homicide rates in the country, but a handful of cities (Des Moines, Waterloo, Fort Dodge, Cedar Rapids, Davenport & Marshalltown) have almost half of its homicides. Fort Dodge & Waterloo have homicide rates more than 20% higher than the national average.
[The autistic is referring to all gun deaths, whether they be murder, accidental or suicide. He thinks your gun right should be restricted because mentally-ill people tend to kill themselves w/firearms. Japan has a high suicide rate, yet few guns. Should we restrict the ability of folks to consume alcohol recreatationally because a very small % get hammered & kill people on the highway? If Person A is privy to suicide, should all gun right be restricted? That’s essentially what he is arguing]
UTubeKookDetector
UTubeKookDetector
1 hour ago
@wasp wrap About the only thing you have accomplished is thumbing up your own comments. Still waiting for your next volley, did your talking points not fare well in the wood chipper little fella?
wasp wrap
wasp wrap
52 minutes ago
@UTubeKookDetector again, all you did was list county crime rates. The fact you don’t see incompetence in that is sad. You can’t compare a spread out county that usually votes GOP, and an urban county that usually votes dem. Also, bringing up the point that blue states and red states have bad cities, yet somehow, a blue state like NY, where NYC is half of their population comes out as the 9th safest state, whereas in red states, the cities suck, and have higher rates of crime. Red states are also increasing in gun deaths and violent crimes, while blue states are delivering promises for safety, and have 8/10 safest states and some of the lowest rates of gun violence per capita.
1
UTubeKookDetector
UTubeKookDetector
43 minutes ago (edited)
@wasp wrap You aren't paying attention, I listed county level data & above in this very thread I posted dozens of cities & their combined homicide rate, as well as their voting preferences on the national & state level. Pay attention kiddo. I'm guessing you are about 12 or perhaps that is your IQ.
Then you go back (again) to this blue states are safe, red states are not -- I will again point out that TN, IL & MO are all states that have sky high homicide rates & when you separate the very pro-Trump & Pro-Biden/Hillary counties & compare them, you can see where the homicide problems are.
I will (again) point out to you that your remark about WY & gun crime is flawed. You said in one breath that red counties will have lower homicide rates because they are spread out & then in the next breath talked about WY (a very rural state) having a very high gun homicide rate. Make up your mind.
Your logic is flawed: WY has one of the lowest overall homicide rates (for all weapons, whether they be firearm, personal weapon or object such as knife) in the nation. Would you rather live in a state w/ no gun deaths, but a sky high homicide rate or a state that has an overall homicide rate less than one-half the national average, but a high % of those deaths are by firearm?
Dead is dead, whether the perpetrator uses a gun, knife, crowbar or personal weapon.
I think he has run out of talking points, he keeps repeating them.
EDIT: I also find this funny, he whines about me using county data because, "You can’t compare a spread out county that usually votes GOP, and an urban county that usually votes dem," but you can look at an entire state that may have 100 or more counties that voted for Trump & mash that together. What the actual funk?
UTubeKookDetector
UTubeKookDetector
13 minutes ago
@wasp wrap I never said NY state was not safe, in fact, I mention them in my essays on homicide. Overall, NY is a safe state, but there are some pockets of violence & those tend to be counties that are in the very pro-Democrat column.
"while South Carolina, Tennessee, and Mississippi have some of the loosest gun laws, pretty unsafe" What about Delaware, Illinois, North Carolina, Michigan -- do they have "loose" or "strict" gun laws. Have you done a study looking at homicide rates by county there & the voting preferences of those counties to determine the problem areas or does each county have the exact same homicide rate?
Remember folks, this clown was whining that using county level data was NOT good, you need to drill it down to a city, yet here he is talking about entire states again. I think he's reciting talking points.
*** and the other video
w n
w n
1 month ago
That man is a disgrace to the court
119
Dennis Hickey
Dennis Hickey
1 month ago
The court is the disgrace.
9
wasp wrap
wasp wrap
1 month ago
@Dennis Hickey specifically him
6
UTubeKookDetector
UTubeKookDetector
1 month ago
@Dennis Hickey The court is only a disgrace because they allowed some Federalism. Imagine if they trash stare decisis again & Congress isn't allowed to spend money on whatever they want, just because they want. I forget the court case that ensconced that, it was during the New Deal era.
If that happens, the state you live in will have to raise the money to pay your welfare benefits, they won't be able to fleece taxpayers in states like Iowa, where a higher % of people are actually working
wasp wrap
wasp wrap
1 month ago
@Dennis Hickey no I know, but Alito especially sucks
4
Dennis Hickey
Dennis Hickey
1 month ago
@wasp wrap Hard to pick a worst isn't it?
4
wasp wrap
wasp wrap
1 month ago
@Dennis Hickey probably Thomas, Alito is a close second. Personal favorite, Sotomayor, keep in mind, this is only considering current SCOTUS justice’s
5
Dennis Hickey
Dennis Hickey
1 month ago
@wasp wrap Will do. Current only or Scalia makes the rotation.
1
5rings16
5rings16
4 hours ago
Oh please!
wasp wrap
wasp wrap
4 hours ago
@5rings16 in what way is he practically considered acceptable
1
5rings16
5rings16
4 hours ago
@wasp wrap In every way!
2
UTubeKookDetector
UTubeKookDetector
3 hours ago
@Dennis Hickey The reason you can't pick a worst is that might make you actually write something detailed as to why. You don't know why & you don't know much, which is why your musings are always short.
For example, I could tell you the most violent cities in America vote Democrat & then you could go to my featured video & try debating me on that (I have hundreds of pages of data), but you would be defeated soundly. I am not the bar crowd you usually debate. Good luck (lol)
UTubeKookDetector
UTubeKookDetector
3 hours ago
@wasp wrap Sotomayor wanted to disarm law-abiding citizens like myself, she is the worst by far.
She doesn't want upper middle class folks like me, being able to defend myself from the fatherless, BLM kooks.
UTubeKookDetector
UTubeKookDetector
3 hours ago
@wasp wrap Good job thumbing up your own comment. You need to read the Heller & McDonald decisions little fella. If you are worried about violent stupid people, see my featured video -- I have loads of data proving the most violent jurisdictions in America have loads of black on black homicide & they vote Democrat. If you comment on my video I will defeat you in a debate, while recording it & embarrass you. So, choose your words carefully and good luck, you will need it.
UTubeKookDetector
UTubeKookDetector
2 hours ago
@wasp wrap Dang, that was about 46 talking points in a post that resembled something a 5 year old might type.
"40% higher violent crime in states Trump won." You are copying talking points from Brianna Taylor Cohen, he's the subject of my featured video & I proved him wrong.
E.G. the counties in MO that voted 66% or more for Trump have homicide rates (2018-2020) much lower than the national average & the counties that voted 60% or more for Hillary & Biden have homicide rates (I have this all this data on my website too, you cannot refute it) more than 2X the national average.
TN is the same thing, the lion's share of their homicides happen in two Democrat-dominated counties (Shelby & Davidson) & the rest of the state has homicide rates less than 50% the national average.
You need to do some actual research & reading. Are you by chance still in elementary school?
UTubeKookDetector
UTubeKookDetector
2 hours ago
@wasp wrap Where did you go little fella? Your "data" on homicides by state is a bit daft. You ever look at any county level data or demographic data or are you only able to repeat arguments a 7-year-old could memorize?
wasp wrap
wasp wrap
1 hour ago
@UTubeKookDetector also, it’s not helpful to only look at county levels. Since red counties are more spread out, obviously there’s going to be less crime. [he is using the same talking points here. He doesn’t allow county data because “red counties are spread out” but you can recite state data. What the funk?]
1
UTubeKookDetector
UTubeKookDetector
1 hour ago
@wasp wrap Hey junior, what happened to your talking points? I am currently debunking this person on my featured video, he is not doing very well
UTubeKookDetector
UTubeKookDetector
1 hour ago (edited)
@wasp wrap That's why you adjust it per 100,000, ever take a statistics class? I can add a point about Texas in that regard. I looked at all the counties that voted 60% or more for Trump twice vs. the counties that voted 60% or more for Biden/Shillary. The latter had homicide rates way beyond the national average & the TX average, as well as well beyond the very pro-Trump counties. I added the population up for all those counties (150+ for Trump, a handful for Shillary & Biden) & calculated their homicide rates.
There are a lot of rural counties in TX that voted overwhelmingly for Trump & add them all up -- they are a massive city. They are so small though, it would not take many homicides for them to have a staggering HOMICIDE RATE. The key is rate, take a statistics class. (lol)
UTubeKookDetector
UTubeKookDetector
1 hour ago
@wasp wrap I should also mention (since you remarked about this in my featured video & I am recording all of it) that you made a point about Wyoming & that it has one of the highest gun deaths per capita (but overall, their homicide rate is really low) in the nation, yet they have no major cities. You also remarked that "red counties are spread out so there will be less crime."
Seems like you are contradicting yourself, make up your mind my uneducated friend. I should also mention your bad logic: Are you saying you would be happy if a state had a very high homicide rate & virtually no gun deaths, versus a state like WY, that has a high gun death rate, but their overall homicide rate is below the national average, by far.
Are you serious? (lol)
[If you copy talking points from Brian Tyler Cohen, you are going to get squashed]
976
views

Divorcee Sam Seder vs. UTubekookdetector (black on black crime)
The divorcee Sam Seder #majorityreport #samseder recently had a bi-polar fit when some people suggested that #blacklivesmatter & their willing accomplices in the antique media can be blamed for the surge in murder in these United States the past few years.
UTubekookdetector proves that the divorcee Sam Seder is wrong as usual & that young black men have been murdering young black men disproportionately for a very long time. Sad, but true.
TITLE: Divorcee Sam Seder vs. UTubekookdetector (black on black crime)
I will mention first that the black on black homicide rate is 4.5X HIGHER than the white on white homicide rate http://freewebs.com/professor_enigma/black-lives-do-not-matter https://rumble.com/v14bqpx-onision-isnt-very-bright-but-even-it-knows...-blacklivesmatter.html
Now let us utilize FBI data & cover many of the cities I covered here http://freewebs.com/professor_enigma/sam-seder-ilhan-omar-racism3 that are uber-Democrat (in that essay, I also covered arrests/homicide offenders by race for various states & cities, as well as racial data on the victims, if it was available) & diverse – you’ll see that there are loads of black on black homicide that is ignored, but when the police snuff out someone (regardless of whether it was justified or not https://rumble.com/vfxji5-old-fart-rants-the-ferguson-effect-and-michael-brown.html) suddenly the carnival barkers on the Marxist side of the fence are screeching like lunatics who lost their taxpayer-funded Risperdal.
I have lots of state & local PD data, this will focus solely on FBI data as it will be quicker for me to look up, but feel free to peruse my data from state & local sources and compare them. Enjoy! Some cities I cannot cover, as the FBI has no data for them pertaining to our subject at hand.
You will also find if you have perused my essays on this subject, I often use county data because you have a bevy of small municipalities or CDPs (Census Designated Places) & those little areas don’t necessarily create a report on crime, but state reports will have that data for the county.
You could have a Podunk county in say, SC that votes Republican overwhelmingly & has a high homicide rate, but its one city in that county where all the problems occur & lot of the murder is black on black. If I can find data for that city, I will report it.
Many of these rural counties have overall, hundreds of thousands of people, but they are very spread out & not clustered. Not all of these entities (but certainly the vast majority) will be high homicide jurisdictions, but it will give you a good idea of who vs. who on homicide.
Let us begin: Recently covered Memphis https://cde.ucr.cjis.gov/LATEST/webapp/ from 2012-21 (FBI data) >93% of the homicide offenders where the race of the offender was known were… Black. >86% of the victims were… Black. Memphis was ~63% Black in 2010 & 64.6% Black in 2020. https://www.census.gov/quickfacts/US
Wikipedia is not good for much, but you can also look up (as the Census site updates the estimated demographics each year after the Census) demographics for almost every city on that site as well.
Philadelphia, PA: Philly’s FBI data is limited, but in 2021 of the 254 homicide offenders where the race of the offender is known (*and these will be my parameters from this point on UNLESS I say otherwise*), 81.49% (207) of the offenders were Black. Of the 455 victims where the race of the victim is known, 78.68% (358) were Black. Seen this movie before? Philly is roughly 41% Black currently (2021 Census data).
Waterloo, Iowa: Home of Black Hawk County’s answer to Jabba The Hut, Supervisor Chris Schwartz. Waterloo is Iowa’s most dangerous city. From 2012-21, 28 of the 34 homicide offenders (82.35%) were Black & of the 50 homicide victims, 74% (37) of them were Black. Defund the Police & it will end black on black homicide in Waterloo. Uh, yeah. In 2010 Waterloo is 17.3% Black according to the latest Census data.
During that same time frame, 4 of the murderers were <20 years old & 19 were <30 years old. Nine of the victims were <20 years old & 29 were <30 years old.
Homicide offenders & victims in Waterloo, Iowa tend to be less than thirty years old, Male & Black.
Cedar Rapids, IA (2012-21): 66 offenders & (37) 56.06% are Black. 62 cadavers & (31) 50% of them are Black. CR is 8.8% Black. 12 “Children” under the age of 20 were murdered, that 1.2 kids every year for you idiot Democrats reading this. March for those young people murdered.
27 of the victims will never see 30 YO. 49 of the assailants were 29 years of age or younger. 8% of the population in CR is committing >half of all the homicides.
Detroit, Michigan: From 2012-2021, of the 2,497 homicide offenders, 93.59% (2,337) of them were Black & of the 2,978 victims, 90.76% (2,703) of them were Black. Detroit is 77.9% Black.
Highland Park, MI (2012-2021): 98.14% (53 of 54) of the offenders are Black & (46 of 49) 93.87% of the victims are Black. This city likely has the highest homicide rate of any city in the U.S. that has over 8,000 people, although that honor might go to East St. Louis. It is a train wreck of biblical proportions. The city is currently 85.2% Black.
I wonder if they have enough black folks in the Mayor’s Office & on the City Council?
Dearborn Heights, MI (2002-2021): 50% (14 of 28) of the assailants are Black & 47.36% (9 of 19) of the victims are Black. The city is currently 8.9% Black.
Romulus, MI (2002-2021): 66.1% of the perps (39 of 59) are Black & 50% (14 of 28) of the victims are Black. The city is 42% black currently.
Lansing, MI (2012-2021): 127 murderers, 74.01% (94) of them are Black & 120 victims, (79) 65.83% are Black. 29 “children” under the age of twenty were killed in those years. Not bad for a city that size. 70 of the victims will never see 30 & 83 of the perps were less than thirty years old. The city is 24.2% Black currently.
Inkster, MI (2002-21): 95.97% (143 of 149) of the assailants & 87.7% (107 of 122) of those murdered were Black. This is a city that has had massive homicide problems for decades. It is not the fault of the police, but of the young men that refuse to raise their children. Inkster has a culture of fatherlessness, bad government schools, drugs & a sloth work ethic. Just the way the Democrat Party wants it. The city is currently 77% Black.
Ypsilanti (the city, NOT the charter township, 2012-21): 94.11% (32 of 34) of the offenders were Black & (20 of 25) 80% of the victims were Black. The city is 25.5% Black currently.
East Lansing, MI (2002-2021): 75% (12 of 16) of the perps were Black & 50% (4 of 8) of the victims were Black. The city is only 6.8% Black.
Ann Arbor, MI (2003-2021): 66.66% (18 of 27) of the bad guys were Black & (4 of 13) 30.76% of the victims were Black. The city is only 6.7% Black.
Southfield, MI (2002-21): 94.44% (68 of 72) of the killers & 82.5% (33 of 40) of those killed were Black. The city is currently 66.7% Black.
Oakland County, Michigan Sheriff’s Office (2002-2021): 50% (34 of 68) of the culprits were Black & (37 of 62) 59.67% of the cadavers were Black.
*This is obviously nowhere near the homicides in Oakland County, just the ones the Sheriff’s Office handled & reported on. Still enlightening data*
The county is 13.9% Black.
Troy, Michigan (2002-2021): 44% of the offenders (11 of 25) were Black & 13.33% (2 of 15) of the victims were. The city is currently 3.6% Black.
Kalamazoo, MI (2002-2021): 84.35% (124 of 147) of the killers were Black & (75 of 99) 75.75% of the victims were Black. Kalamazoo is only 22.21% Black.
21 “children” under twenty were murdered 2012-2021, >2 a year for a city that small. Stay classy Kalamazoo, you are a hotbed for homicide.
Flint, Michigan: From 2012-21 there were 176 homicide offenders, 88.06% (155) of them are Black, of the 385 victims, 85.45% (329) were Black. In 2021 Flint was 56.7% Black.
Pontiac, Michigan: From 2015-21, there were 92 offenders, 76.08% (70) of them were Black & 77 victims, 79.22% (61) of them were Black. Maybe defunding the police will cause some of that black-on-black angst to evaporate? Pontiac is 47.7% Black.
Oak Park, MI (2002-21): 94.73% (18 of 19) of the culprits were Black & (16 of 19) 84.21% of the victims were Black. The city is 55.5% Black.
Benton Harbor, MI (2002-21): 92.72% (51 of 55) of the killers & (38 of 39) 97.43% of the killed were Black. The city is 87.3% Black. Small town, massive homicide issues.
Defunding & ending the police in Benton Harbor or Berrien County will solve the decades long problems of young black men murdering young black men in this city. Suuuuure!
Sterling Heights, MI (2002-21): 25.8% of the murderers (8 of 31) were Black & 27.58% (8 of 29) of those murdered were Black. If I had only done 2012-2021, it would have been much worse, but some of these cities do not have a lot of homicide, so if the data is available, I go back further. The city is 6% Black.
Warren, Michigan (2012-21): 68% of the guilty were Black (51 of 75) & (30 of 49) 61.22% of the residents at the county morgue were Black. The city is 20.8% Black.
Westland, MI (2002-21): Of the 56 criminals (40), 71.42% were Black & of the 26 victims (10), 38.46% were Black. The city is 22.3% Black.
Saginaw, MI (2012-2021): Of the 111 criminals, (96) 86.48% were Black & of the 157 victims, (137) 87.26% were Black. Yikes! This city is an absolute nightmare, visit at your own risk. Saginaw is 45% Black.
27 “children” under 20 were murdered in this small city over that period of time & 92 of the victims will not see 30. 61 of the offenders were <30YO. It has been this way in Saginaw for a long, long time.
Muskegon, MI (2012-21): 72.5% (29 of 40) of the criminals were Black & (27 of 39) 69.23% of the cadavers were Black. The city is 31.7% Black. It has been this way in Muskegon for a very long time. Wash, rinse & repeat.
Jackson City, MI (2002-2021): 83% of the evildoers (83 of 100) were Black & (48 of 67) 71.64% of the victims were Black.
16 “children” under twenty were murdered during those years, twelve of them from 2012-2021, which is an eye-popping total for a city w/ <32,000 people. The city is currently 19% Black.
37 of the victims were <30YO & 73 of the assailants were <30YO. Wash, rinse & repeat.
Chicago, Illinois: In 2021, of the 179 homicide offenders, 84.91% (152) were Black & of the 368 victims, 80.43% (296) of them were Black. Surprised? Chi-town is 29.2% Black currently.
Of the murderers, 28 were teens or younger, 105 were <30. Of the victims, 41 were teens or younger, 185 were <30.
Des Moines, Iowa: From 2012-21, of the 173 homicide offenders, 58.95% (102) of them were Black & of the 134 victims, 55.97% (75) were Black. DSM is 11.2% Black.
54 of the homicide offenders (2012-21) were <20 years old & 123 were <30. Of the victims, 26 were <20 years old & 69 were <30.
We have another common theme – murderers in DSM tend to be less than thirty, they tend to be male & they tend to be Black. Same for the victims. Wash, rinse & repeat. Screeching “racist” over this data will not work.
Fort Dodge, Iowa: From 2014-21, of the 10 offenders, 60% (6) of them were Black. Of the 13 victims, 61.53% (8) of them were Black. Currently, FD is 6.1% Black.
Sioux City, IA (2002-21): 24.59% (15 of 61) of the killers & 18.91% (7 of 37) of those killed were Black. The city is 4.8% Black.
Dubuque, IA (2002-21): 48.14% (13 of 27) of the murderers & (5 of 19) 26.31% of those murdered were Black. Dubuque is only 4.2% Black.
Burlington, IA (2002-21): 52% (13 of 25) of the offenders & (12 of 22) 54.54% of the victims were Black. Burlington is 8.2% Black.
Coralville, IA (2002-21): 80% (8 of 10) of the assailants & (4 of 6) 66.66% of those assailed were Black. Coralville is 13% Black.
I know what some of you autistics on the Dumocrat side are saying, “These are small cities & not a lot of victims, you’re just trying to make Black Democrats look bad.” Au contraire, my mentally ill friend, all these small cities add up & if you want to get a good picture of black on black homicide in Iowa, you have to find these small cities.
Ames, Iowa (2002-21): 43.75% (7 of 16) of the offenders & (2 of 10) 20% of the victims were Black. Ames is only 3.1% Black.
Council Bluffs, Iowa (2002-21): 12.72% (7 of 55) of the offenders & (4 of 29) 13.79% of the victims were Black. CB is only 2% Black.
Iowa City, IA (2002-21): 56% (14 of 25) of the offenders & 40% (6 of 15) of the victims were Black. The city is 8.4% Black.
District of Columbia: Peruse my essays if you want to see several years of data pertaining to homicide arrestees by race & victims by race. In 2021, of the 45 homicide offenders, 44 (97.77%) were Black & of the 109 victims, 104 (95.41%) of them were…. Black.
The most woke, most Communist city in these United States & black on black homicide rages like the towering inferno. Memphis has a lot of black folks on their city council & a black police chief, yet their city remains, like Washington DC, a hotbed for violence. The two previous chiefs of police in Memphis were also Black. Yet, the violence remains steadfast.
This did not start yesterday; it has been going on for decades. So long, the fat toad Sam Seder was young when it started getting ugly there. It has less to do with race & more to do with ATTITUDE. https://redstate.com/mike_miller/2023/01/28/jason-whitlock-pens-moving-rebuttal-of-cnn-others-calling-beating-death-of-tyre-nichols-racist-n695193
The cops that beat Tyre Nichols to death were young black men & in Memphis (majority Black), as well as DC (plurality Black), there are lots of young black men killing other young black men.
So, if the race of the deceased is what is victimized, I see a lot of young black men committing heinous, racist acts against other young black men, just as we saw from those cops in Memphis.
There is a massive cultural, institutional, deep-seated problem in Memphis & it won’t be cured by more black cops. Maybe these Memphis council members should focus more on the fathers that abandon their kids (and the “root cause” of that) & less pie-in-the-sky “diversity” for the sake of it.
Some of the councilmen even mentioned their father, that ought to clue them into what the problem is in Memphis & DC as well. Now, back to the game.
Wilmington, DE: From 2012-21, of the 156 homicide offenders, 93.58% (146) were Black. Of the 261 victims, 91.95% (240) were Black. If we disband the Wilmington Police Department, will young black men (47 of the homicide victims in that time frame were teenagers or younger, 39 offenders in the same age range) quit murdering other young black men there? In 2020 Wilmington is 56.7% Black.
Petersburg, VA: From 2012-21 there were 124 homicide offenders, 95.16% (118) of them were Black. Of the 140 victims, 92.14% (129) were… you guessed it… Black. Census data indicates it is 76.6% Black.
Of the murder perpetrators, 15 were teens or younger, 86 of them were <30 years old. Pertaining to victims, 22 were 19 years of age or younger, 65 were less than 30. A least two persons in Petersburg that are teens or younger are murdered every single year, in a city that has 33,000 people. Let that sink in. Say their names Democrats, say their names.
Richmond, VA: From 2012-2021 there were 482 homicide offenders, 93.77% (452) of them were Black. Of the 550 victims, 88.9% (489) were Black. Richmond is 45.2% Black.
75 “children” <20 YO were murdered in those years, that’s 7.5 “children” murdered each year in Richmond, VA. I must have missed #blacklivesmatter marching for those kids & trying to hold their assailants responsible. What is the “root cause” of 88 “children” <20 YO committing murder in Richmond during those years?
A lack of fathers in homes, combined w/ a purposely ineffective government school system, which leads to dropping out of school to get involved in drugs & gangs. That’s the problem in Richmond, not the police.
Portsmouth, VA: From 2012-2021 there were 132 homicide offenders, 89.39% (118) were Black & of the 188 victims, 89.89% (169) of them were Black. Census data indicates 52.2% Black.
In those ten years, 41 “children” <20 YO were murdered. For you Democrats who can read, that’s 4.1 “children” snuffed out in Portsmouth each year. March for those kids dumbasses. 82 of the homicide offenders were <30 years old.
Danville, VA: From 2012-21 there were 92 homicide offenders, 76.08% (70) were Black. 77.92% (60) of the 77 victims were Black. Danville is 49.3% Black.
Newport News, VA (2012-21): Of the 186 offenders, 84.4% (157) were Black & of the 245 victims, 83.26% (204) are Black. 46 of the perpetrators were <20 years of age & 111 were <30. 47 victims were <20 years old & 152 victims will not see thirty. In a city of 186,000 there are >4 murders EVERY SINGLE YEAR of kids who were barely out of High School (if they finished) or younger. Every Single Year! Say their names Democrats, Say Their Names!
Newport News is 41% Black.
Norfolk, VA (2012-21): 346 perpetrators, 91.32% (316) were Black & of the 386 victims, 86.26% (333) were Black. 61 of the offenders were <20 years old & 234 of them were <30. Of the victims, 70 were <20 YO & 194 were <30 YO.
Every single year in Norfolk, 7 persons who are teens or younger are murdered. More than two persons who will never see the age of ten are murdered, every single year in Norfolk. Say Their Names Sam Seder, Say Their Names old man. Census 2020 says 40.7% Black & 41.1% in 2010.
Chesapeake, VA (2012-21): 65.51% (76 of 116) of the killers & 60.83% (73 of 120) of those killed were Black. The city is 29.6% Black. 63 of the victims were <30YO, as were 65 of the offenders.
Roanoke, VA (2012-21): 73.45% (83 of 113) of the murderers & 64.1% (75 of 117) of those murdered were Black. The city is 29.3% Black.
Dayton, OH: From 2012-21, 83.75% (268) of the 320 homicide offenders were Black & 80.11% (278) of the 347 homicide victims were Black. Dayton is 38.5% Black.
Cleveland, Ohio: 2012-21 there were 514 homicide offenders, 87.54% (450) of them are Black & 85.31% (860) of the 1,008 homicide victims were Black. Cleveland is 47.4% Black.
Of the offenders in that time frame, 86 were teens or younger & of the victims, 150 (!) were teenagers or younger. That’s basically 15 children (if we count 18 & 19 as kids in this category) murdered in Cleveland each calendar year. Most of them are black.
Cincinnati, OH: In 2012-21 there were 505 homicide victims, yet 91.68% (463) of them were Black. 673 homicide victims, 86.03% (579) of them were Black. Look up “disproportionate” in the dictionary kids. Cincy is 40.3% Black.
Milwaukee, WI (2012-21): 1,596 homicide offenders, 87.28% (1,393) are Black. 1,270 victims, 81.81% (1,039) of them are Black. Wash, rinse, repeat. Census says 39.4% Black.
During that time frame, 204 of the victims never saw 20 years of age. 661 of them will never see their 30th birthday. 994 of the perpetrators were less than 30 years of age when they murdered another human being.
Is the problem in Milwaukee the police or is it a purposely-designed poor government school system, a lack of fathers & an abundance of cocaine, meth & heroin?
On average, every single year in Milwaukee, >4 people who are younger than 10 are murdered, every single year. Let that sink in.
Kenosha, WI (2014-21): 70% (14 of 20) of the offenders & 52.63% (10 of 19) of those murdered were Black. 11 of the victims were <30YO, as were 11 of the offenders.
This once peaceful town is now a train wreck, due to fatherless #blacklivesmatter terrorists. The city is 10.6% Black.
Racine, WI (2017-21): 73.17% (30 of 41) of the murderers & 73.91% of the victims (17 of 23) were Black. The city is 22.7% Black.
Beloit, Wisconsin (2019-21): 83.33% (10 of 12) of the offenders & (8 of 10) 80% of the victims were Black. Beloit is only 14.4% Black.
West Allis, WI (2016-21): 18.75% (3 of 16) of the offenders & (3 of 14) 21.42% of the victims were Black. The city is only 6.8% Black.
Baton Rouge, LA: Data for 2021 only – All 35 homicide offenders (100%) where the race is known were Black. 85 of the 87 victims (97.7%) where the race of the victim is known were Black. BR is 53.3% Black.
13 “children” who were teens or younger were murdered in the city that year, was anyone marching for them? 45 of the victims will not see their 30th birthday.
I already chronicled the tyranny in Baton Rouge, let us look at a few more jurisdictions inside the East Baton Rouge Parish & lump them together.
If we combine Zachary (2021), Baker (2003-2021) & The East Baton Rouge Sheriff’s Office (2021 only) we have 23 of the 25 assailants (92%) categorized as Black & 29 of 31 victims (93.54%) categorized as Black. The Parish is currently only 47.4% Black.
Buffalo, NY: 2021 data – 17 homicide offenders, 70.58% (12) of them are Black & 65 victims, 80% (52) were Black. Census says 33.3% Black.
Birmingham, AL (2021): 72 homicide offenders, 95.83% (69) were Black & of the 91 victims, (88) 96.7% were Black. OUCH! The city is 68.7% Black according to Census Bureau.
13 people less than twenty were murdered there in 2021, 4 of them will never have a 10th birthday celebration.
Hoover, AL (2006-2021): 78.04% (32 of 41) of the perps were Black & (16 of 25) 64% of the victims were Black. 14 of the victims were <30YO, as were 32 of the perpetrators. Hoover is 19.2% Black.
Phenix City, AL (2021 only): 100% (5 of 5) murderers were Black & (5 of 7) 71.42% of the victims were Black. The city is 46% Black.
St. Louis City, MO: In 2021, 88.23% (90) of the 102 homicide offenders were Black & 91.48% (172) of the 188 victims were Black. Census says 44.8% Black.
In 2021, 24 people less than 20 years of age were murdered there, 5 of them had a funeral before they turned ten.
Kansas City, MO: 2012-21 there were 1,483 homicide offenders, 81.05% (1,202) were Black. Of the 1,298 victims, 74.49% (967) were Black. Census says 26.5% Black.
On average, 2.5 persons who are less than 10 are murdered in KC, every single year. >15 of them will never see 20. Every… single… year.
Minneapolis, MN (2019-21): 292 offenders & 87.32% (255) were Black. Of the 213 victims, (168) 78.87% were Black. Minneapolis was only 18.4% Black.
In 2021, 22 of the murder offenders were teens or younger, 63 were not even thirty. 18 of the victims will never see twenty & 45 of them will never see thirty. Murder offenders & victims in Minneapolis tend to be less than thirty, black & male.
St. Paul, MN (2021 data): 42 homicide offenders & (35) 83.3% were Black. Of the 33 victims, (22) 66.66% were Black. 2020 Census, St. Paul is only 16% Black.
18 of the offenders in that time frame were 29 years old or younger, 16 of the victims were <30.
Atlanta, GA (2021): 99.01% (101) of the 102 homicide offenders were Black & of the 155 victims, 92.9% (144) were Black. Notice a trend yet kids? Atlanta is 48.2% Black.
17 people less than twenty were murdered in Atlanta that year, four of them will not see ten years of age.
Indianapolis, IN (2020 & 2021): 196 homicide offenders, 77.04% (151) are Black. 454 victims & 71.8% (326) are Black. Indy is 28.2% Black. Tell me about George Floyd again Democrats.
47 of the homicide offenders were teens or younger, 139 were less than 30 years of age. 69 of the homicide victims will never see age twenty. 220 victims were less than age thirty. Indy averages 34 murder victims every year that are teenagers or younger. #saytheirnames #blacklivesmatter
North Little Rock, AR (2012-2021): 131 homicide offenders, 90.83% (119) are Black & 124 victims, 77.41% (96) are Black. Census says 43.9% Black..
Little Rock, AR (2012-21): 438 homicide offenders, 85.38% (374) were Black & of the 435 victims, 81.14% (353) were Black. LR is 41.2% Black.
Pulaski County, Arkansas Sheriff's Office (2004-2021): 41.66% (25 of 60) of the criminals were Black & 50% (21 of 42) of the victims were Black. The county is 38.3% Black.
Hot Springs, AR (2012-21): 41 of 75 offenders (54.66%) were Black & 31 of 71 (43.66%) victims were Black. 32 of the victims were <30YO & 43 of the perps were also. The city is 17.7% Black.
Garland County, AR Sheriff’s Office (2004-2021): 8 of the 25 criminals (32%) are Black & 1 of the 9 victims (11.11%) were Black. The county is only 8.8% Black.
Texarkana, AR (2009-21): 43 of the 47 culprits (91.48%) were Black & 18 of the 29 county morgue residents (62.06%) were Black. The city is 38.9% Black.
West Memphis, AR (2012-21): 83 of the 87 criminals were (95.4%) Black & 76 of the 82 (92.68%) victims were Black. West Memphis is not very large, yet 13 “children” under 20 were murdered in those years & 46 of the victims will not see 30. 58 of the murderers were not yet 30. The city is 62.8% Black.
Marion, Arkansas (2003-2021): 100% of the criminals (11 of 11) & (11 of 11) victims were Black. Marion is 33.7% Black.
Crittenden County, Arkansas Sheriff's Office (2003-2021): 86.53% (45 of 52) of the murderers were Black & 86.27% (44 of 51) of the victims were Black. 23 of the victims were <30YO & 34 of the criminals were also. The county is 55.4% Black.
Helena-West Helena, AR (2012-21): 95.04% (96 of 101) of the culprits were Black & (62 of 63) 98.41% of the victims were Black.
The city is 77.6% Black. This city has major homicide issues, right up w/ East St. Louis or Highland Park. It is an unmitigated disaster & one of the many reasons why AR is a GOP-dominated state w/ a high homicide rate.
Lots of black-on-black homicide in Razorback land.
Arkadelphia, AR (2003-2021): 40% (2 of 5) of the assailants were Black & (3 of 9) 33.33% of the victims were Black. The city is 32.3% Black. Not a lot of data, but this is a city w/ <11,000 people.
Hope, AR (2004-2021): 83.33% (10 of 12) of the culprits were Black & (7 of 10) 70% of the victims were Black. Hope is alive in Arkansas! The city is 44% Black.
Monticello, AR (2003-2021): 100% (8 of 8) of the perps were Black & (10 of 14) 71.42% of the victims were Black. Monticello is 45.4% Black.
Magnolia, AR (2005-2021): 95.65% (22 of 23) of the assailants were Black & (8 of 8) 100% of the victims were Black. Magnolia is 43.7% Black.
Pine Bluff, AR (2012-21): 107 homicide offenders & 90.65% (97) are Black. 155 homicide victims & 89.67% (139) are Black. The city is 76.9% Black.
22 of the murder victims in that time frame were teenagers or younger. 63 of them will never see 30 years of age. 61 of the offenders were less than 30 years old.
I would like to ask the fat toad Sam Seder. Is the problem in Pine Bluff, Arkansas the police or is the problem(s) in Pine Bluff fatherless children who are not getting educated, dropping out of school & getting into drugs & mischief?
A young black male in Pine Bluff, should he be murdered is far, far more likely to die at the hands of another young black man than an overzealous police officer or some tobacco-chewing, toothless, Confederate-Flag waving redneck.
Sam Seder’s boogeymen are all a product of his imagination, a distraction from reality. If Sam lived in reality, he would still be married, but this fantasyland that he immerses himself in has taken over his life & like a blind man in a dark room, he flails about throwing dung at a wall, hoping something sticks.
Not much is sticking, but it sure stinks.
Fayetteville, AR (2002-21): 26.53% of the criminals (13 of 49) were Black & (13 of 32) 40.625% of the victims were Black. The city is currently 5.9% Black.
Jonesboro, AR (2003-21): 73.6% of the lawbreakers (92 of 125) were Black & 63.41% (52 of 82) of those murdered were Black. The city is 21.2% Black.
Forty of the victims were <30YO & 79 of the guilty were <30YO.
Fort Smith, AR (2002-21): 22.72% of the criminals (25 of 110) were Black & (12 of 73) 16.43% of those victimized were Black. The city is currently 8.4% Black.
Conway, AR (2008-2021): 57.14% (28 of 49) of the lawbreakers were Black & (17 of 30) 56.66% of those victimized were Black. The city is 18.6% Black.
Forrest City, AR (2003-2021): 98.27% (57 of 58) of the evildoers were Black & (30 of 31) 96.77% of the cadavers were Black. The city is 71.5% Black.
34 of the murderers were <30YO &
12 of the victims were <30YO & 35 of the evildoers were <30YO.
Louisville/Jefferson County, KY (2015-2021): Of the 500 offenders, 71% (355) were Black & of the 826 victims, 68.4% (565) were Black.
From 2017-21, 86 murder offenders were <20 years of age & 218 were <30. 119 persons less than 20 years of age were murdered & 329 less than <30. Louisville is 23.8% Black.
On average, 3.4 persons who are nine years old or younger are murdered, every single year in Louisville. Almost 24 people who are teens are younger are murdered, every single year in Louisville. #saytheirnames
Macon/Bibb County, GA (2020-2021): 65 murder perpetrators, (62) 95.38% are Black & 83 victims, 85.54% (71) are Black. Census says 54.3% Black.
Eleven persons that were teens or younger murdered in that time frame, that 5.5 murders of “children” every single year in Bibb County. 47 perpetrators were 29 years old or younger. * When you check this on the FBI website, see “Bibb County Sheriff’s Office” *
Albany, GA (Dougherty County, GA – 2020-21): 38 offenders (36) & 94.73% were Black, 34 victims (31) & 91.17% were Black. 4 persons that are teens or younger are murdered every year in Albany & the vast majority of assailants are less than thirty years old. Same song, different radio station, eh?
* When checking this on the FBI site, see “Albany Police Department” * Census says Albany was 74.6% Black.
Athens, GA/Clarke County (2018-21): 23 of the 25 criminals (92%) are Black & 17 of the 20 victims (85%) were Black. Athens is 27.8% Black. 12 of the victims were less than thirty, as were 18 of the murderers.
Sandy Springs, GA (2018-2021): 45.45% (10 of 22) of the criminals were Black & (7 of 14) 50% of those victimized were Black. Sandy Springs is 19.4% Black.
South Fulton, GA (2019-21): 100% (50 of 50) of the murderers were Black & 100% of (48 of 48) their targets were also Black. The city is 91.9% Black & has a mind-boggling homicide rate.
8 “children” under 20 were murdered & 28 of the victims were less than thirty. Thirty-three of the bad guys were also less than thirty.
Roswell, GA (2019-21): 45.45% (5 of 11) of the murderers & (7 of 10) 70% of the victims were Black. Roswell is 12.5% Black.
Cobb County, Georgia Police Department (2019-21): 57.69% (30 of 52) of the offenders & (38 of 62) 61.29% of the victims were Black. The county is 29.2% Black.
Marietta, GA (2019-21):57.14% (4 of 7) of the murderers & (5 of 7) 71.42% of the victims were Black. The city is 31.9% Black.
East Point, GA (2019-21): 78.94% (15 of 19) of the culprits & (21 of 25) 84% of the victims were Black. The city is a wreck, 76.7% Black. 8 “children” under 20 were murdered in that small city in that time frame. Sad indeed. 16 of the victims were <30YO, as were 11 of the murderers.
Tulsa City, OK (2021 only): 30 of the 62 perps (48.38%) were Black & 31 of the 58 victims (53.44%) were Black. Can you say disproportionate?
I chronicled OK in my essays before, Black folks are disproportionately arrested & falling victim to homicide. Tulsa city is 14.8% Black. 36 of the offenders were <30YO.
Tulsa County (Sheriff’s Office), Oklahoma (2010-2021): 23.4% (11 of 47) of the murderers & (7 of 33) 21.21% of the victimized were Black. The county is 10.8% Black.
Oklahoma City, OK (2019-2021): 60.08% (134 of 223) of the culprits & (89 of 196) 45.40% of those victimized were Black. 121 of the perps were <30YO. The city is 13.8% Black.
Lawton, OK (2021): 84.61% (11 of 13) of the perps & 63.63% (7 of 11) of the victims were Black. Lawton is 19.2% Black
Muskogee, OK (2008-2021): 53.33% (16 of 30) of the murderers & 51.61% (16 of 31) of those victimized were Black. The city is 15% Black.
Stillwater, OK (2013-2021): 40% (6 of 15) of the bad guys & (4 of 12) 33.33% of those victimized were Black. The city is only 4.3% Black.
Norman, OK (2016-21): 24% (6 of 25) of the bad guys & (6 of 21) 28.57% of those killed were Black. The city is 4.8% Black.
Edmond, OK (2018-2021): 50% (7 of 14) of the perps & (1 of 7) 14.28% of the victims were Black. The city is 5.2% Black.
Henderson, NV (2020-21): 40% (10 of 25) of the bad guys & 40% (8 of 20) of the victims were Black. The city is 6.2% Black.
Reno, NV (2020-2021): 27.77% (10 of 36) of the criminals & 20% (6 of 30) of those victimized were Black. Reno is currently 3.4% Black.
Sparks, Nevada (2020-21): 16.66% (2 of 12) of the perpetrators & (2 of 12) 16.66% of those assailed were Black. The city is only 1.8% Black.
Las Vegas, NV (2020-21): 46.3% (94 of 203) of the assailants & (80 of 179) 44.69% of those assailed were Black. The city is 11.5% Black.
North Las Vegas, NV (2020-21): 53.57% (15 of 28) of the killers & (17 of 32) 53.125% of those victimized were Black. The city is 22.1% Black. 14 of the assailants were <30YO.
Denver, CO (2012-21): 43.52% (279 of 641) of the assailants & (214 of 575) 37.21% of those assailed were Black. Denver is only 9% Black.
86 “children” under twenty were murdered in those years, over 8 per year. Will the divorcee Sam Seder get off his fat duff & march for them? 351 of the perpetrators were <30YO.
Colorado Springs, CO (2012-21): 37.89% (119 of 314) of the offenders & 25.68% (66 of 257) of those assailed were Black. The city is 5.9% Black. 193 of the perps were <30YO.
Aurora, CO (2012-21): 59.03% (147 of 249) of the murderers & (105 of 234) 44.87% of those assailed were Black. The city is 16.6% Black. Homicides in Aurora over the past few years have absolutely skyrocketed, as has occurred in a lot of American cities that are deteriorating rapidly.
Greensboro, NC (2019-21): Of the 117 offenders, (97) 82.9% are Black & of the 154 victims, (128) 83.11% are Black. In a typical year, over 8 “children” under the age of twenty are murdered in Greensboro. #saytheirnames More than 6 of the offenders in a typical year are also “children” under the age of twenty.
Census says Greensboro was 43.1% Black.
Durham, NC (2019-21): 86 offenders, (71) 82.55% were Black & 120 victims, (97) 80.83% were Black. In those 3 years, twenty-four “children” 19 years of age or younger were murdered. I would like to ask that fat little Hobbit from Story County, Iowa – Latifah Faisal #SayTheirNames dummy, Say Their Names! 24 “children” less than 20 years of age committed murder in Durham during that time frame.
Durham City was 37.2% Black. If we get rid of the police in Durham County & Durham City, North Carolina, will young black men quit murdering other young black men or are the police not the issue?
Fayetteville, NC (2019-21): 99 offenders, (88) 88.88% are Black & of the 99 victims (83), 83.83% were Black. 14 “children” <20 years old were murdered in those 3 years & 14 “children” <20 YO committed murder. 61 of the offenders were <30 YO. Noticing a trend?
Census says it was 42.5% Black.
High Point, NC (2019-21): 79.62% (43 of 54) of the murderers & 75% (39 of 52) of those murdered were Black. The city is 34.5% Black. 36 of the victims were less than thirty years old, as were 34 of the offenders.
Akron, OH: 2012-2021, 283 homicide offenders, 72.79% (206) were Black & 67.97% (225) of the 331 victims were Black. Census says 30.1% Black.
37 of the offenders were teens or younger, 179 were less than 30 years old. Of the victims, 44 will never see twenty & 175 of them will never see thirty. I wish they broke it down by age stopping at 17, so we could see how many “children” were murdered, but they don’t do it that way.
Safe to say, a lot of young people are being murdered in Akron every single year. #saytheirnames #samseder Say Their Names!
Grand Rapids, MI (2012-21): Of the 199 homicide offenders, 74.78% (89) of them are Black & of the 122 victims, 68.85% (84) were Black. Census says 18.4% Black.
18 of the murderers were under twenty & 79 were under thirty. 14 of the victims will not see twenty, 66 will not see thirty.
Mobile, AL (2021): Of the 51 homicide offenders, 84.31% (43) were Black & of the 98 victims, 94.89% (93) were Black. 33 of the offenders (and 10 were less than 20) were <30 years old & 43 of the victims were <30 (18 will never see their 20th birthday). That is just one year of data in Mobile, lots of young folks getting put in prison for murder & lots of young folks having early funerals. You think defunding the police & putting social workers or some federal police force in their place will solve this or make it worse. #RESIST calls from Democrats to nationalize police. Census says Mobile is 52.5% Black.
Wichita, KS (2012-2021): 441 offenders, 52.15% (230) of them are Black & 289 victims, 49.48% (143) are Black. 51 victims were teens or younger, 17 never got their 10th birthday cake. That means in a typical year in Wichita, more than 5 persons who are teens or younger are murdered. 93 of the offenders were teens or younger, 265 were <30 years old.
Census says 10.3% Black.
Topeka, KS (2021 data only): 7 of the 15 (46.66%) homicide offenders were Black & 6 of the 13 victims (46.15%) were Black. Topeka is only 10.6% Black.
Raleigh, NC (2019-2021): Of the 126 offenders, (99) 78.57% were Black & of the 67 victims, (51) 76.11% were Black. In that time frame, eleven “children” 19 years of age & younger were murdered. Say Their Names Al Sharpton, Say Their Names dummy. 2020 Census says Raleigh was only 28.6% Black.
Columbia, SC (2012-2021): 165 perpetrators & 93.33% (154) were Black. 146 victims & 87.67% (128) were Black. 15 “children” <19 YO were murdered in that time frame & 94 of the murderers were <30 years of age. Census says 40.9% Black.
Charleston, SC (2012-21): 117 murder offenders, 91.45% (107) were Black & of the 113 victims (89), 78.76% were Black. Ninety of the murderers were less than 30 years old. Census says 19.6% Black.
North Charleston, SC (2012-2021): 272 murder offenders, (241) 88.6% are Black & of the 258 victims (222), 86.04% were Black. 46 “children” under twenty years old were murdered in that time frame, that 4.6 “children” every single year for you idiot Democrats reading this. Get off your fat ass & march for them.
189 of the homicide offenders were less than 30 years of age. Census says 43.7% Black.
Greenville, SC (2012-2021): 69 murder offenders & (58) 84.05% were Black. 37 victims & (25) 67.56% were Black. Forty-seven of the offenders were <30 YO & 20 of the victims were <30 YO (years old). Census says Greenville was 23.2% Black.
Spartanburg, SC (2012-2021): 69 murder offenders (65), 94.2% were Black & of the 46 victims (38), 82.6% were Black. Twenty of the victims were less than thirty years old & 42 of the perpetrators were <30 YO. Census says 44.5% Black.
Goose Creek, SC (2012-21): 32 murder offenders (22) & 68.75% were Black. Twenty-three victims (11) & 47.82% were Black. Ten of the victims were <30 years old & twenty-four of the offenders were <30 years old. Census indicated 19.4% Black.
Conway, SC (2012-21): Twenty homicide offenders, (15) 75% are Black & of the 20 victims, 75% (15) are also Black. Census says 34% Black.
Gaffney, SC (2012-21): Twelve murder offenders, 91.66% (11) are Black & of the twelve victims (10), 83.33% were Black. Census says 42.3% Black.
Anderson, SC (2012-2021): 23 offenders & (16) 69.56% are Black. 25 victims (21) & 84% of them were Black. Census says 33.2% Black.
Sumter, SC (2002-21): 95.86% (139 of 145) of the murderers & 93.15% (68 of 73) of those murdered were Black. The city is 48.2% Black.
Orangeburg City, SC (2012-21): 15 offenders & (12) 80% are Black. 15 victims & (14) 93.33% were Black. Now that is what I call disproportionate. Should Orangeburg County (which has a high homicide rate) rid themselves of all LEOs to solve this ongoing problem of young black male on young black male violence or can the problem be elsewhere – such as no daddy in the home, a bad government school system & lots of kids who are crushed by the soft bigotry of low expectations.
Census says 70.8% Black.
Camden, SC (2017-21): Fourteen offenders, 85.71% (12) were Black & of the nine victims, (7) 77.77% were Black.
Small town, big homicide issues. Census says 32.9% Black. The more you dig through this data in various states, the more you will find that some of these Podunk counties have a lot of jerkwater towns, but it is usually just one of them doing most of the damage.
I’ve had to remind myself & will remind you also, sometimes you need to check The Sheriff’s Office for some of these counties as all these little towns either report to it or it’s the only entity that reports crime to the FBI for that county.
If there’s no data, just move on. So, let’s keep moving.
Williamsburg County, SC (Williamsburg County Sheriff’s Office 2012-21): Thirty-five offenders, (32) 91.42% are Black & of the thirty victims, (23) 76.66% were Black. Census says the county is 63.7% Black.
Keep in mind, this may not (and I am not going to go back and look right now) be all the homicides for that county en masse, but it’s good data for what I am illustrating.
Allendale, SC (2012-21): This one will make your head explode. The local PD reports 15 murder offenders where the race of the offender was known, 100% (15) of them were Black. Fifteen of the seventeen victims (88.23%) were Black. Allendale County was 72.7% Black.
Fairfield County, SC (Fairfield County Sheriff’s Office 2012-2021): Thirty-one offenders, (28) 90.32% are Black & of the nineteen victims (16) 84.21% were Black. Fairfield County is 56% Black.
Lexington County, SC (Lexington County Sheriff’s Office 2012-2021): 152 offenders & (74) 48.68% are Black. Of the 109 victims, (41) 37.61% of them were Black. Census says 16.4% Black.
West Columbia, SC (2012-21): Thirteen offenders & (7) 53.84% are Black. Of the 12 victims (6), 50% were Black. West Columbia is18.3% Black.
Oconee County, SC (Oconee County Sheriff’s Office 2012-21): Forty-six offenders, (8) 17.39% were Black & of thirty-eight victims, (3) 7.89% were Black. Census says 7.6% Black.
Seneca, SC (2017-21): 8 offenders, 50% (4) were Black & 6 victims (4), 66.66% were Black. Seneca is part of Oconee County. 21.1% Black according to Census data.
Lancaster County, SC (Sheriff’s Office 2012-21): 87 offenders, (69) 79.31% are Black & of the 47 victims (27), 57.44% were Black. 15 of the offenders were “children” under the age of twenty, 55 of them were <30 YO. Five “children” under the age of twenty were murdered in that time frame & twenty of them were <30 YO.
Census says 20.8% Black.
Aiken City, SC (2012-21): 49 offenders, (47) 95.91% of them are Black & of the 38 cadavers (32), 84.21% were Black. Twenty of the offenders were teens or younger, 37 of them were less than 30 years old. 22 of the victims will not see their 30th birthday & nine will not see their 20th birthday.
Census says 34.8% Black.
Aiken County, SC (2012-21, Sheriff’s Office): 125 perpetrators, (77) 61.6% are Black & of the 80 victims (40), 50% were Black. Eleven of the victims were teens or younger, forty-one were 30 years old or younger. Twenty-one of the offenders were teens or younger (one less than ten!), sixty-eight of them were < 30 years old.
The county is 25.3% Black.
Ferguson, MO (2021): Where the #blacklivesmatter façade began – “Hands Up, Don’t Shoot” was a lie. 8 perpetrators & 100% (8) of them were Black & all 9 victims (100%) were Black. All 8 victims were slain w/a firearm, I wonder if the victim said, “My hands are up, don’t shoot me” before they were shot & killed.
Census says Ferguson is 70.6% Black. Ferguson is part of St. Louis County, which is in the St. Louis City metro area – one of the most violent areas in the entire country.
St. Louis County, MO (Police Dept – 2020-21): 95.94% (71 of 74) of the killers & (78 of 82) 95.12% of those killed were Black. The county is 25.1% Black.
45 of the victims & 45 of the perpetrators were less than thirty years old. Lots of young black men killing young black men.
Hazelwood, MO (2020-21): 8 perpetrators, (7) 87.5% of them are Black & all 9 victims (100%) were also Black. Hazelwood was 40.9% Black.
Overland, MO (2017-21): Seven murderers & (5) 71.42% of them were Black, while 4 of the 6 victims (66.66%) were Black. Overland is 21% Black.
Berkeley, MO (2020-21): Nine bad guys, (7) 77.77% were Black & seven victims, 100% (7) of them were Black. The city was 85.4% Black (Census).
Colombia, MO (2019-21): 15 perpetrators & (9) 60% were Black, 13 victims (8) & 61.53% were Black. Columbia is 11.5% Black.
St. Charles, MO (2012-21): 23 perpetrators, (12) 52.17% were Black & 17 victims (6), 35.29% were Black. Sixteen of the offenders were less than thirty & eight of the victims were less than thirty years old as well. Census says 6.6% Black.
Independence, MO (2019-21): 45 offenders, (25) 55.55% were Black & 27 victims (13) 48.14% were Black. 22 of the murderers were <30 years old & 13 of the victims were <30 years of age.
Census says Independence is only 9.6% Black.
Raytown, MO (2021 only): 3 homicide offenders & 100% of them are Black, 5 victims (where the race of the victim is known) & 100% of them are Black. Census says 37.3% Black. I wish we had a decade or more of data for this city, I would wager it would be more of the same.
Springfield, MO (2020-21): 43 murderers, (18) 41.86% were Black & 37 victims, (14) 37.83% were Black. 24 of the offenders were less than thirty, as were 17 of the victims.
Census says the city is only 4% Black.
Joplin, MO (2012-21): 25 bad guys, (5) 25% are Black & 34 victims, (6) 17.64% were Black. Joplin is 3.3% Black.
Belton, MO (2019-2021): 16 murderers, (7) 43.75% are Black & 7 victims, (2) 28.57% were Black. Census says 4.8% Black.
St. Joseph, MO (2018-2021): 19 murderers, (7) 36.84% are Black & 20 victims, (8) 40% were Black. Eleven of the murder victims will never see thirty & twelve of the offenders were <30 years old. Census says only 6% Black.
Jefferson City, MO (2018-21): Fourteen perps, (13) 92.85% are Black & 8 victims, (6) 75% are Black. Census says 19% Black.
Cape Girardeau. MO (2020-21): 4 perps, (3) 75% are Black & 4 victims (1), 25% are Black. Census says 13.8% Black.
Kennett, MO (2019-21): Nine perps, 100% of them Black & 5 victims, 100% of them are Black. Census says 13.3% Black. This is the case in a lot of MO cities, as I have demonstrated, despite it being a state dominated by the GOP in recent decades.
Dallas, TX (2018-2021): 985 murderers, (698) 70.86% are Black & of the 773 victims, (486) 62.87% were Black. Dallas was 24% Black.
103 “children” under the age of twenty were murdered in “Big D” during those years, that’s >25 per year. March for those kids who had their lives snuffed out prematurely. I should mention, perhaps some of them were asking for it – if the only “family” you have ever known is a gang of fatherless hoodlums, do not be surprised when another fatherless hoodlum removes you from the gene pool.
How many of these were drive-bys & the victim was minding their own business, thinking about what mom & dad were cooking up for supper. #blacklivesmatter doesn’t give a flying squirrel about those kids.
If they want equality, they need to look at those homicide stats. Less-than a quarter of the Dallas population is committing 70% of the murders there. That’s not equality, that’s disproportionate.
595 of the homicide offenders were less than thirty years old. Same story, different city.
Houston, TX (2018-2021): 1,382 offenders, (897) 64.9% are Black & of the 1,304 victims, (768) 58.89% are Black. Houston is only 22.6% Black.
172 victims were teens or younger (24 were nine years old or less), 593 were 29 years old or less. 857 of the offenders were less than thirty years old. Lots of young black men in Houston murdering other young black men.
Divorcee Sam Seder won’t admit this because he’s mentally ill & he knows once he admits this, his entire paradigm comes crashing down.
Austin, TX (2019-21): 228 offenders, (118) 51.75% are Black & of the 155 victims, (54) 34.83% were Black. Austin is 7.7% Black.
21 “children” less than twenty years old (7 per year for you Dumocrats reading this) were murdered in that time frame, did anyone care? 71 of the victims will never see 30. 140 of the perps were less than thirty.
El Paso City, TX (2019-21): 59 murderers, (23) 38.98% Black & of the 87 victims (13), 14.94% are Black. 16 victims were teens or less, 38 will never see thirty years old. 36 of the offenders were <30 years old. El Paso is 3.4% Black.
Mesquite, TX (2019-2021, although for a very short time they reported data in 2018): 50 offenders, (33) 66% are Black & 33 victims, (15) 45.45% were Black. Mesquite was 23.6% Black.
Nine people teens or younger murdered, 19 were less than thirty. 35 of the offenders were less than thirty years old.
Lewisville, TX (2012-21): 23 offenders, (15) 65.21% are Black & 21 victims, (9) 42.85% are Black. The city was 13.9% Black.
Garland, TX (2020-21): 26 offenders & 26 victims, in both cases 7 of them (26.92%) were Black. Garland was 15% Black.
Grand Prairie, TX (2018-2021): 50 bad people, (28) 56% are Black & 37 victims, (15) 40.54% were Black. The city was 23.3% Black.
Pflugerville, TX (2017-21): Eleven perps, (7) 63.63% are Black & 8 victims (5), 62.5% are Black. The city was 16.4% Black.
Baytown, TX (2020-21): 12 perps, (3) 25% are Black & 18 victims, 50% (9) were Black. 12 of the victims were <30YO, as were 6 of the offenders. Baytown was 16.3% Black.
Pearland, TX (2012-21): 19 perps, (8) 42.1% are Black & 18 victims, (7) 38.88% were Black. The city was 19.5% Black.
4 of the victims were <30YO, as were 9 of the offenders.
Pasadena, TX (2019-21): 16 perps, (4) 25% were Black & of the 24 victims, (3) 12.5% were Black. 12 victims were <30YO, as were 11 of the offenders. The city was only 2.5% Black.
South Houston, TX (2012-21): 10 perps, (4) 40% were Black & 10 victims, (1) 10% were Black. South Houston is 0.9% Black. All those homicides but one occurred in 2019-21.
San Antonio, TX (2020-2021): 108 murderers, (26) 24.07% were Black & of the 175 victims, 34.85% (61) were Black. 28 “children” that were teens or younger were victimized. That means 14 children are murdered every single year in SA. 70 victims were <30YO. 59 offenders were <30YO. The city was 6.5% Black in 2021.
Converse, TX (2017-21): 9 assailants, (4) are 44.44% Black & 9 victims, (4) 44.44% were Black. Converse was 23.3% Black in 2021.
Rosenberg, TX (2018-2021): 9 perps, (3) 33% are Black & 7 victims, (3) 42.85% were Black. The city was 16.31% Black in 2020.
McKinney, TX (2012-2021): 22 perps, (10) 45.45% are Black & 21 victims, (6) 28.57% are Black. The city was 12.68% Black in 2020
Richardson, TX (2019-21): 14 offenders, (2) 14.28% were Black & of the 15 victims, (2) 13.33% were Black. Richardson was 10.56% Black in 2020.
Plano, TX (2012-21): 66 perps, (41) 62.12% were Black & of the 54 victims, (16) 29.62% were Black. Plano was 8.77% Black in 2020
9 people teens or younger were murdered, twenty-two of the victims will never see 30. Forty-two of the offenders were <30 years old.
Frisco, TX (2012-21): 17 offenders, (6) 35.29% were Black & 15 victims, (6) 40% were Black. Frisco was 8.82% Black in 2020
Fort Worth, TX (2012-21): 871 offenders, (482) 55.33% were Black & 687 victims, (333) 48.47% are Black. 120 people were murdered before their 20th birthday (that’s 12 a year!) & 326 of them before they hit 30 YO.
170 of the offenders were teens or younger (one was <10) & 508 of the offenders did the heinous crime before they turned thirty. The city was 19.2% Black in 2020.
Does the overweight, bi-polar divorcee Sam Seder really think that getting rid of the police will keep these insane young people from killing each other in the streets?
A young black male in Fort Worth, should he become the victim of homicide is far, far, far more likely to meet his end at the hands of another young black male (or young white male that is also likely not a nice fellow) than the police.
Sam Seder is a liar, this is why he’s not married, why he couldn’t make it as a talk show host or anything else – he’s never been true to himself, he’s a façade. He wants you to think the police are the problem, but the problem is the culture, drugs, fatherlessness & purposely ineffective government schools.
Arlington, TX (2017-21): 108 assailants, (85) 78.7% were Black & 83 victims, (51) 61.44% were Black. 18 “children” under twenty were murdered (3.6 per year) & 55 of them were <30 YO. 68 of the offenders were <30 years of age.
The city was 22.38% Black in 2020.
Columbus, OH (2012-21): 885 assailants, (709) 80.11% of them were Black & 1,141 victims, 73.88% (843) were Black. Columbus apparently has one of the greatest homosexual communities in the U.S., so if you’re a homosexual male looking for a good time & some HIV, try Columbus. You may want to wear a vest though & there are certain communities in the city where you should not be after dark.
If sky-high homicide numbers & regular knifings & shootings don’t bother you, Columbus is your prime destination!
If you look at the FBI data year-by-year, you will see the George Floyd hysteria was particularly hard on Columbus. It was not exactly the safest city on the planet in years past, but 2020 & 2021 saw a titanic surge in homicide there, it was unbelievable.
183 “children” that were teens or younger were snuffed out (that’s 18.3 per year), I wonder if #blacklivesmatter was marching for them? 589 of the victims did not reach 30YO. 554 of the perpetrators were less than thirty years old.
The city was 29.2% Black in 2020.
Lubbock, TX (2017-21): 131 offenders, 46.56% (61) are Black & 80 victims, (30) 37.5% were Black. Census 2020 says 9.57% Black.
Youngstown, Ohio (2012-21): 78 perps, (69) 88.46% are Black & of the 161 victims, (128) 79.5% were Black. A lot of unsolved homicides in Youngstown & I would wager a lot of it (as it is in Buffalo) is the no-snitch culture.
The victims of a gangland homicide that are themselves perpetrators of gangland homicides are not likely to call the police. Ergo, homicides are responded to, but the police are not involved.
I would also wager that the “race” of the perpetrators in those unsolved murders are 80-90% Black as well. The city is 42.4% Black currently.
Toledo, OH (2017-21): 219 perpetrators, (161) 73.51% were Black & of the 218 victims, (161) 73.85% were Black.
Toledo is only 28.1% Black currently. Since the George Floyd events, Toledo’s homicide rate has gone through the stratosphere. #blacklivesmatter It was really bad, it’s getting worse. Fifty-six of the victims never got to 20 years of age, 132 never got to 30. 139 of the murderers were <30YO.
Euclid, OH (2012-2021): 37 offenders, (35) 94.59% were Black & 27 victims, (25) 92.59% were Black.
Euclid is currently 63.8% Black. Fourteen of the victims were <30YO, as were 37 of the perpetrators.
Canton, OH (2014-21): 98 murderers, (77) 78.57% are Black & 76 victims, (51) 67.1% were Black.
Canton is 24.3% Black currently.
Cleveland Heights, OH (2019-21): All 22 of the perpetrators were Black & all 11 of the victims were Black. Now that is what I call disproportionate. It must be the police; if the Regressive Democrats running Cuyahoga County into the ground would just get rid of the police – if all those city councils that rule these cities that are majority or plurality Black would end policing as we know it these dysfunctional young black men would suddenly stop killing each other.
That is not going to happen in Iowa, but I wish them good luck. I really wish some of these lily-white, uber-Regressive counties in Vermont, Washington state, etc. would try it first & make sure you invite in a few hundred thousand homeless drug addicts in first. Tell me how it goes, thanks!
PS also, do not prosecute public urination or graffiti, it’s not worth the time, right?
The city is currently 40.9% Black.
Garfield Heights, OH (2012-21): 11 of the 13 (84.61%) perpetrators were Black & 12 of the 13 victims (92.3%) were Black. The city is 56.9% Black currently.
Knoxville, TN (2012-21): 279 murderers, (203) 72.75% were Black & 233 victims, (154) 66.09% were Black. 34 “children” less than 20 years old were murdered, that’s 3.4 every year. #saytheirnames 120 of the victims were <30YO & 156 of the perpetrators were <30YO.
What have I been saying this entire time? In a lot of these cities (and some even lean Republican), the lion’s share of the homicide is being committed by a fraction of the population (young black men) & the victims are disproportionately a fraction of the population (young black men).
These young black men are more often than not are growing up without their birth father/sperm donor as he flees the scene, the same way a carjacker flees from the police. The city is currently 16.4% Black.
Brownsville, TN (2012-21): All 11 murder offenders were Black & all 14 victims were also Black. Nine of the victims were under 30 & 7 of the offenders were under thirty. The city is currently 65.9% Black. It has been this way in Brownsville for a very long time.
Jackson, TN (2012-21): 120 of the 129 offenders (93.02%) were Black & 88 of the 105 victims (83.8%) were Black. The city is currently 45.8% Black. It has been this way in Jackson for a very long time.
Ironically, the George Floyd hysteria caused their sky-high homicide rate to fall slightly 2020-21, relative to the previous two years.
Millington, TN (2012-21): 3 perps & 2 (66.66%) are Black, 6 victims (4), 66.66% are Black. This is a dinky town w/ a high homicide rate. Millington is 30.8% Black.
Chattanooga, TN (2012-21): 217 perpetrators, (187) 86.17% were Black & 265 victims, (218) 82.26% were Black. ~4 children are murdered every single year in Chattanooga. Chattanooga is 30.6% Black.
Lexington, KY (2012-21): 246 bad guys, (172) 69.91% were Black & 225 victims, 59.55% (134) were Black. 47 “children” under 20 were murdered & 123 of the victims were less than thirty. 175 of the offenders were less than thirty.
The city is currently 14.6% Black.
Frankfort, KY (2012-21): Thirty offenders, (19) 63.33% were Black & 22 victims, (10) 45.45% were Black. The city is currently 13.8% Black. 16 of the victims were less than thirty.
Covington, KY (2012-21): 17 of the 25 murder offenders (68%) are Black & 12 of the 19 (63.15%) victims were Black. The city is only 10.4% Black.
Bowling Green, KY (2012-21): 26 of the 46 perps (56.52%) were Black & 25 of the 40 victims (62.5%) were Black.
The George Floyd fiasco caused their homicide rate to spike after 2019. BG is 12.5% Black.
Richmond, KY (2002-2021): 8 of the 21 perps (38.09%) were Black & 5 of 17 victims (29.41%) were Black. The city is currently 6.1% Black.
Owensboro, KY (2012-21): 11 of the 24 offenders (45.83%) were Black & 6 of the 18 (33.33%) victims were Black. Owensboro is only 6.9% Black.
Elizabethtown, KY (2009-21): 4 of the 11 (36.36%) perpetrators were Black & 6 of the 15 victims (40%) were Black. The city is currently 12.1% Black.
Paducah, KY (2002-2021): 36 of 56 offenders were Black (64.28%) & 24 of 36 victims (66.66%) were Black. The city is only 22.3% Black.
Hopkinsville, KY (2012-21): 27 of the 36 murderers (75%) were Black & 24 of the 33 victims (72.72%) were Black. The city is currently 27.4% Black.
Henderson, KY (2007-2021): Seven of the fifteen murderers were Black (46.66%) & three of the twelve victims (25%) were Black. The city is currently 10.1% Black.
Radcliffe, KY (2012-2021): 12 of the 17 murderers were Black (70.58%) & 8 of the 17 victims (47.05%) were Black. Radcliffe is 28.76% Black.
Lake Charles, LA (2020-21): 16 of 20 assailants (80%) were Black & 10 of 14 victims (71.42%) were Black. Eleven of the 20 murderers were <30YO. The city is currently 46.2% Black.
Kenner, LA (2020-21): Seven of the eight (87.5%) bad guys were Black & 6 of the 8 cadavers (75%) were Black. The city is 19.8% Black.
Bossier City, LA (2020-21): 6 of the 14 perps were Black (42.85%) & 4 of the 9 victims (44.44%) were Black. The city is 27.9% Black.
Bossier Parish Sheriff’s Office (2004-21): 12 of the 33 assailants were Black (36.36%) & 7 of the 14 victims (50%) were Black. The Parish is currently 24.1% Black.
Ouachita Parish, Louisiana Sheriff’s Office (2018-21): 55.55% (10 of 18) of the homicidal maniacs were Black & 40% (6 of 15) of the victims were Black. The Parish is 38% Black.
Monroe, LA (2017-2021): All 59 homicidal maniacs (100%) where the race of the assailant was known, were Black. All 64 victims (100%), where the race of the victim is known, were Black. That is the definition of “disproportionate.” Holy homicide Batman! The city is currently 59.7% Black.
Twenty of the victims will never see twenty, that’s 4 “children” murdered every year in Monroe, which is not a huge city. Will Sam Seder get off his fat ass & march for them or will he have better things to do – like Twitter & avoiding his ex-wife?
33 of the offenders were <30YO.
West Monroe, LA (2014-2021): 15 of the 15 offenders (100%) are Black & 9 of the 10 (90%) victims are Black. The city is 40.4% Black. I bet if all police organizations in Ouachita Parish, LA were deep-sixed then young black men would quit murdering other young black men & Rodney King’s “can’t we all get along” mantra would come true.
Alexandria, LA (2021 only): 24 of the 25 (96%) assailants were Black & 20 of the 21 victims were Black. Alexandria is currently 55.3% Black.
Rapides Parish, LA Sheriff’s Office (2007-2021): 18 of 34 offenders (52.94%) were Black & 11 of the 31 victims (35.48%) were Black. The Parish is 32.4% Black.
Houma, LA (2021 only): 100% of the assailants (7 of 7) were Black & 90% (18 of 20) of the victims were Black. Houma is 21.7% Black. If I add the Terrebonne Parish Sheriff’s Office data for 2021, we have 9 of the 12 perps (75%) are Black & 21 of 26 victims (80.76%) are Black in a Parish that is only 19.3% Black.
Another Parish that votes overwhelmingly Republican in LA, its full of homicide & the people who are perpetrating it are a Democrat voting bloc.
Combining data from Thibodaux (2015-21) & the Lafourche Parish Sheriff's Office (2015-21) we have 67.92% (36 of 53 perpetrators) of the assailants & (40 of 65) 61.53% of the victims being Black folks. The Parish is only 13.8% Black.
Boston, MA (2019-21): 75.47% (40 of 53) of the evildoers & (70 of 87) 80.45% of those murdered were Black. The city is 23.5% Black. 55 of the victims were <30YO.
Albuquerque, NM (2018-2021): 15.09% (40 of 265) of the perps & (29 of 329) 8.81% of the cadavers were Black. The city is currently 3.2% Black.
Charleston, WV (2012-21): 63.29% (50 of 79) of the criminals & (43 of 85) 50.58% of those victimized are Black. The city is 14.2% Black.
South Charleston, WV (2002-2021): 29.41% (5 of 17) of the assailants & (2 of 8) 25% of the victims were Black. The city is 7% Black. This is small city; it does not take a lot of homicides for their rate to go skyward.
Bluefield, WV (2002-2021): 52.38% (11 of 21) of the evildoers & 64.28% (9 of 14) of those assailed were Black. The city is 24.3% Black. This is small city; it does not take a lot of homicides for their rate to go skyward.
Huntingdon, WV (2002-2021): 52% (39 of 75) of the perps & (34 of 72) 47.22% of those victimized were Black. The city is only 7.9% Black.
B
529
views
4
comments

Divorcee Sam Seder won't undertake this analysis of Minnesota election
https://dps.mn.gov/divisions/bca/bca-divisions/mnjis/Pages/uniform-crime-reports.aspx
https://dps.mn.gov/divisions/bca/bca-divisions/mnjis/Documents/2020-Minnesota-Uniform-Crime-Report.pdf (see Chapter 15, where you can open a PDF for County data)
https://dps.mn.gov/divisions/bca/bca-divisions/mnjis/Documents/2021-Minnesota-Uniform-Crime-Report.pdf
https://cde.state.mn.us/DownloadData/OffenseCountyMunicipalByCountyDownload (for 2021)
Counties in MN that voted 60% or more for Kiddie Sniffer Joe Biden (2020) & Tim Walz (2022): Cook, Hennepin & Ramsey:
Cumulative population for those counties 2020-2021 = 3,654,629
Cumulative homicides for those counties 2020-2021 = 284
Homicide rate = 7.770 per 100,000
Counties in MN that voted 60% or more for Donald Trump (2020) & Scott Jensen (2022): Aitkin, Becker, Benton, Big Stone, Brown, Cass, Chippewa, Chisago, Clearwater, Cottonwood, Crow Wing, Dodge, Douglas, Faribault, Grant, Hubbard, Isanti, Jackson, Kanabec, Kandiyohi, Lac Qui Parle, Lake of the Woods, Le Sueur, Lincoln, Lyon, McLeod, Marshall, Martin, Meeker,
Mille Lac, Morrison, Murray, Nobles, Otter Tail, Pennington, Pine, Pipestone, Polk, Pope, Red Lake, Redwood, Renville, Rock, Roseau, Sherburne, Sibley, Stevens, Swift, Todd, Traverse, Wadena, Waseca, Wilkin, Wright & Yellow Medicine.
Cumulative population for those counties 2020-2021 = 2,680,242
Cumulative homicides for those counties 2020-2021 = 18
Homicide rate = 0.671 per 100,000
Minnesota State Population 2020-21 = 11,413,884
Cumulative Homicides 2020-2021 = 386
MN homicide rate 2020-21 = 3.381 per 100,000
We know who is committing the lion’s share of homicides in MN, counties that overwhelmingly vote Democrat. The GOP-dominated counties have homicide rates that barely register, but collectively they are well over a million people.
The most violent counties in MN overwhelmingly vote Democrat & the safest counties vote overwhelmingly Republican. It’s getting worse in Gopher Land & the places where it’s getting worse are dominated by the Party of Marx. http://freewebs.com/professor_enigma/covid-increase-homicides
***
The Divorcee Sam Seder #majorityreport #samseder is afraid to debate my friend James Patrick Holding on The Impossible Faith. https://tektonics.org/lp/nowayjose.php Methinks Stan Seder has little confidence in that religion degree from a diploma mill. #samsederwontdebateJPH
America's crime wave is a Democrat Crime Wave, the REAL #insurrection is a Dumocrat #insurrection
171
views
Divorcee Sam Seder flaps his gums about Tyre Nichols (Democrat Insurrection)
According to the FBI, https://cde.ucr.cjis.gov/LATEST/webapp/ the State of Tennessee had from 2016-2021 (505, 545, 512, 515, 663, 672) 3,412 homicides (2016-21), yielding a homicide rate of (collective population 2016-21 = 40,841,672) 8.354 per 100,000.
TN homicide rate 2020 & 2021 = 9.613 per 100,000. The Ferguson Effect & the George Floyd events in Minneapolis were used by #blacklivesmatter to create a culture of hysteria that they intended to exploit. Destabilize communities, harass them, terrorize them & we can get our way via an end to local policing & a national police force.
From 2016-21 in TN, of the 3,313 homicide offenders where the race of the assailant was known (excluding unknown), 69.12% (2,290) of the offenders were… Black. Of the 3,395 victims where race was known, 64.8% (2,200) of them were… Black. Let’s see divorcee Sam Seder get off his fat ass & lay wreaths at the graves of those people instead of being a social media vegetable.
According to the 2020 Census, TN is only 17% Black.
According to the FBI, Memphis had (200, 186, 188, 194, 289, 306) 1,363 homicides 2016-2021, yielding (2016-21 cumulative population 3,866,978) a homicide rate of 35.247 per 100,000. #blacklivesmatter #saytheirnames Say the names of all the young black men murdered in Memphis Democrats, Say Their Names.
Memphis Homicide Rate 2020-21 = 47.209 per 100,000. Memphis is actually worse than Chicago, it is one of America’s most dangerous cities & it has beaucoup black on black homicide.
Just to give you a hint of the havoc being wreaked in Memphis, from 2012-21 (FBI data) >93% of the homicide offenders where the race of the offender was known were… Black. >86% of the victims were… Black.
Memphis was ~61% Black in 2010 & 64.6% Black in 2020.
According to the FBI, Nashville had (81, 110, 89, 85, 113, 99) 577 homicides 2016-21, which equals (cumulative 2016-21 population 4,177,485) a homicide rate of 13.812 per 100,000.
Nashville Homicide Rate 2021-21 = 14.931 per 100,000.
From 2016-21, Memphis & Nashville had 19.69% of TN’s population, but 56.85% of its homicides. YIKES! In 2020-21, Nashville & Memphis had 19.3% of TN’s population, but a staggering 60.44% of all its homicides.
Homicide rate in TN OUTSIDE of Memphis & Nashville from 2016-21 was 4.488 per 100.000.
According to TN State Data http://freewebs.com/professor_enigma/sam-seder-ilhan-omar-racism3 https://www.tn.gov/content/tn/tbi/divisions/cjis-division/recent-publications.html Memphis had (183, 183, 186, 191, 290, 306) 1,339 homicides 2016-2021. Local Memphis PD data is in dire need of an update.
According to TN State Data Nashville had (81, 111, 89, 84, 113, 101) 579 homicides 2016-2021. Nashville PD data https://www.nashville.gov/sites/default/files/2022-07/UCR1963-2021CriminalOffenses.pdf https://www.nashville.gov/departments/police/news-and-reports/crime-statistics/nashville-crime-statistics (83, 111, 89, 84, 114, 102) says 583 homicides 2016-2021.
Just to give you several different sources & see how well they correlate (or not). The problem areas in TN are Shelby & Davidson counties, primarily Memphis & Nashville, the latter being Davidson County itself.
The U.S. Murder/Non-Negligent Manslaughter rate https://www.statista.com/statistics/191134/reported-murder-and-nonnegligent-manslaughter-cases-in-the-us-since-1990/ (112,650 homicides, 1,966,196,900 cumulative population) from 2016-2021 = 5.729 per 100,000.
***
Previous data I elucidated on the Volunteer State: http://freewebs.com/professor_enigma/covid-increase-homicides According to the FBI (1,659 criminal homicides), TN had a homicide rate (2018-2020) of (7.4, 7.3, 9.6) 8.1 per 100,000. That is not good folks. TN State Data says 1,649 criminal homicides.
You’ve seen from my data that Memphis is very pro-Dumocrat & they have one of the highest homicides rates for big cities. But Memphis is not all of Shelby County.
Shelby & Davidson counties had a collective population of (2018-2020) 4,903,819 & according to TN’s state reports those counties had [287 for Davidson & 688 for Shelby according to state data] 975 criminal homicides, which equals a homicide rate of 19.882 per 100,000.
Tennessee’s homicide rate OUTSIDE of Shelby & Davidson Counties (674 homicides) = 4.318 per 100,000. Seen this movie before? If COVID-19 is causing crime to be out of control, it forgot to cause those problems in uber-White, Pro-Trump counties. Whoops!
***
That said, I could not find a reliable list of Memphis homicide victims for various years, so I could read off the names of all the children that were beaten to death by live-in boyfriends or murdered in drive by shootings, so let us look at another reliable merchant of death – Chicago & the Sun-Times, which chronicles these murders. https://graphics.suntimes.com/homicides/
Will the divorcee Stan Seder sit on his fat duff reading these names? Here are all the Black children that were murdered in Chicago, 2022. There were 85 black people 19 years of age or younger murdered in Chi-town in 2022. We’ll restrict our list to folks 17 & under – all 53 of them. Say their names fat Democrats who live in small apartments & have empty, useless lives – say their names.
How many interstates did these pukes shut down for these black children who lives were snuffed out? Did Black Lives Matter sycophants burn down any car dealerships, any furniture stores – did they burn down any hardware stores or set fire to any courthouses over these murders?
***
The Divorcee Sam Seder #majorityreport #samseder is afraid to debate my friend James Patrick Holding on The Impossible Faith. https://tektonics.org/lp/nowayjose.php Methinks Stan Seder has little confidence in that religion degree from a diploma mill.
America's crime wave is a Democrat Crime Wave, the REAL #insurrection is a Dumocrat #insurrection
235
views

Divorcee Sam Seder & The Democrat Insurrection (Burlington, VT)
https://cde.ucr.cjis.gov/LATEST/webapp/#/pages/explorer/crime/crime-trend (Vermont & Burlington data)
https://rumble.com/v20kbfy-woke-progressivism-brings-record-murders-to-burlington-vt..html
https://www.mychamplainvalley.com/news/local-news/burlington-community-members-react-to-rise-in-crime-in-2022/
https://www.wcax.com/2023/01/11/vt-homicide-rate-22-highest-nearly-3-decades/
https://www.foxnews.com/us/vermonts-largest-city-pays-bloody-price-cutting-police-force
https://www.vnews.com/Burlington-council-approves-30--cut-in-police-staffing-levels-35019811
https://www.census.gov/quickfacts/fact/table/chittendencountyvermont/PST045222
https://archive.ph/jkany
https://vtdigger.org/2020/06/30/burlington-council-approves-30-cut-in-police-staffing-levels/
https://thebaffler.com/latest/the-crime-wave-that-wasnt-schwenk
https://www.clayandbuck.com/cnn-downplays-violent-antifa-riot-in-atlanta/
Burlington, VT homicides 2011-2022 (3, 0, 0, 0, 1, 0, 3, 1, 2, 1, 0 & 5) = 16
Burlington Homicide Rate 2016-2022 (0, 7.102, 2.331, 4.670, 2.234, 0 & 11.155) = 3.927 per 100,000.
NOTE: When calculating Burlington’s homicide rate, I used the 2021 population figure for 2022 plus the 38 residents it added since 2021 (Census Data).
Burlington has a homicide rate much lower than the national rate, but it is one of VT’s problem areas. Over the past 3 years, since they began shrinking their police department, their homicide rate has run a bit hotter than the 7-year average.
According to the FBI, 2012 - 2021, there were 9 homicide incidents, and 10 offenses reported by the Burlington Police Department. Of the 15 offenders for those heinous crimes, 40% (6) of them were Black & 40% of the victims were black in a county & city that is uber-white.
According to the FBI, 2012-2021, of the 108 homicide offenders where the race of the offender is known, 12.96% (14) of those offenders were Black. Of the 122 homicide victims, 8.19% (10) of the victims were Black.
Vermont is a low homicide jurisdiction overall, but like most states that have a low homicide rate, there are pockets of violence. Iowa has the same issue, but in handful of cities named Des Moines, Fort Dodge, Waterloo, Cedar Rapids & Marshalltown.
Vermont Homicides 2011-2021 (11, 8, 10, 13, 13, 16, 17, 11, 12, 14, 8) = 133 I am NOT including 2022, because the news articles I read are including justifiable homicides in the total & I do not want those.
Vermont homicide rate 2016-2021 (2.2, 2.7, 1.8, 1.8, 2.2 & 1.236) = 1.989 per 100,000
We do need one more year of data for 2023 to determine if Burlington’s spike in murder/non-negligent manslaughter is an outlier or a new normal. However, it is quite odd (and if Democrats are going to autistically-repeat that correlation does not equal causation, then say that exact same thing the next time someone complains about the US’ rising homicide rate over the past few years & the number of guns in this country) that not long after they severely cut the number of police officers there, they saw a spike in murder.
Now for a questionable article by a clown named Katya Schwenk.
Here’s one of the money lines: “Studying crime data is like staring into an inkblot, an amorphous cloud that can be distorted to fit any narrative.”
Will Katya call out Chuck Schumer or the mentally-deficient #AOC the next time they say we have a crime epidemic? We have seen our homicide rate go up substantially 2020-2022, but there are still a boatload of counties http://freewebs.com/professor_enigma/covid-increase-homicides (and I do not intend to cover all this data again, as I would be here for eternity) – ~45% of all counties as recently as 2020-21 had ZERO homicides & almost 23 million folks live there. I estimate in 2016-2017 roughly two-thirds of all counties has <2 homicides.
Again, will Katya Schwenk call out those carnival barkers like the overweight Black Hawk County, Iowa Supervisor Chris Schwartz who say, “We are not safe anywhere”? I doubt she will.
If crime data can be spindled, folded & mutilated to mean whatever you want it to mean then there are a lot of Democrats who have had their entire narrative on gun control demolished.
I do know that the most violent counties in America tend to skew towards the Democrat Party & Black Men tend to kill Black Men at an alarming rate http://freewebs.com/professor_enigma/black-lives-do-not-matter – much higher than any other demographic, period.
That rate is even more pronounced in cities that have a lot of poor black folks that have been run by the Democrat Party for decades (East St. Louis, St. Louis, Flint, Detroit, Baltimore, Chicago, Cleveland, Memphis, Camden, Wilmington, etc., etc.)
She brings out that line to try & undermine anyone who says, “see, see, defunding the police has exacerbated our homicide problems.” It has to an extent. Black Lives Matter & their mob has contributed to it as well.
That leads us into the next quote from Schwenk’s article: “But murders are up across Vermont, and indeed, across the country.” But not in every county – there are fewer counties w/ less than two homicides today than 6 years ago & far fewer counties w/ no homicides today than in the 1980s when homicide was a much, much bigger problem than today. Homicides were much more concentrated in the 80s & 90s than they have been in the last 6 or 7 years.
What would she have said in the period 1985-1992 when it was much, much worse? Just blather, “They be up everywhere.” Uh no, they are not.
Burlington is one of the problem cities in Vermont & I would wager it has been for a while. Vermont is uber-white too & just a bit of the picture. Cook County & St. Clair County are the consistent problem areas in Illinois & have been for some time, even though homicide spiked in the Land of Lincoln too.
I found these two statements interesting, here is the first one: “Sarah George, the top prosecutor in Chittenden County, which includes Burlington, is frustrated by the way the issues have been presented in the press, as she emphasized to me recently. George is staunchly reformist, often called one of the most progressive prosecutors in the country, with the typical priorities of her peers: expanding diversion programs and ending cash bail and so forth… “We have, for example, this uptick in people stealing cars,” she told me (this is another highlight of crime coverage in Burlington). “What I see a lot as a prosecutor getting those cases is that people are stealing them to live in them. And—what am I going to do about that? What does accountability look like when someone is stealing a car to live in it?”
And the second statement: “Any power that the trendlines hold is trumped by visceral anecdotes that serve as evidence of some nebulous problem: a split lock, a shattered window, a stabbing in the night, each one the bellwether of something worse. The Times’ reporting on crime in Burlington leads with bicycle thefts, but the article ends with something more sinister: a young man shot execution-style in a park, his distraught girlfriend beside him. Implicit here is the argument that these faceless bike thieves, the subject of the article, will soon, too, become killers, should they be allowed to continue unchecked — that poverty that becomes visible, should it remain seen, will turn into violence.”
If a person steals a car to live in it, they are prosecuted for the same crime as an upper middle class man stealing a car to strip it & make some money. That’s what accountability looks like.
What is the root cause of homelessness, to quote your fat VP? Drugs and/or a lack of a father, which also lead to not finishing school. It’s not always the cause of course, some children turn out just fine despite the fact that they only had one parent active in their life, but what if every child was raised by one parent who was a drug addict vs. every child being raised by two parents who were there every night to tell them, “I love you junior, now finish your homework please & brush your teeth.”
As far as bike thieves, not every bike thief is a murderer, but almost every murderer did not start killing people as their first offense against society.
They likely engaged in some larceny, some vandalism, maybe stole a car or two, aggravated assault & it worked its way up to criminal homicide.
It’s the broken windows policing policy where the police don’t let “small things” slide like vagrancy in front of Fred’s Hardware Store, men blocking the street to clean your windshield, people pissing all over the sidewalk & spray painting the backsides of buildings in the alley.
If you start to let those things slide, it is a slippery slope paved w/ soap.
Nobody is saying that Junior should be put away for 15 years for spray painting “F the Police” on the side of Larry’s Used & Abused Cars, but if you let that go, it will snowball. That pro-active policing is one of the main reasons Rudy Giuliani was able to clean up NYC.
No more squeegee men, no more tolerating spray paint artists, no more peeing on the sidewalk, no more sleeping in front of the restaurant (forgetting about whether you are in favor of “Stop, Question & Frisk”) – eventually NYC became a very safe place.
Does Katya really think there should be no punishment for stealing a bike? There is a cost to that, some kid doesn’t have his bike to do the paper route (even though I am not sure paper boys even exist anymore)?
Stealing a car has a cost, what if Tammy needs it to drop off her & Tommy’s youngest child at daycare before going off to her job selling real estate? Now she cannot drop Junior off & she misses the showing of the house to a prospective buyer.
The article quotes someone saying that it is hard to tell if crime has increased in Burlington since the summer of 2020 when the police had their ranks cut. Well, looking at the homicide numbers 2020-2022 & comparing them to the previous 4 years, the answer is yes.
Here is another questionable quote: “The conundrum was this: despite fearmongering by elites about the imagined impacts of reductions to the immense resources of cops in a country with some of the best-resourced police agencies in the world, no cities had meaningfully defunded their police. This made fearmongering more difficult. Enter: Burlington.”
This means to say if you haven’t completely demolished your police department & replaced them with “whatever” then you have not “meaningfully defunded” it & thus your argument is B.S.
I call B.S. on that as a number of departments (like Seattle, like Portland) have seriously reduced the number of LEOs & they are reaping the rewards of that. It’s akin to saying that because Bill Clinton & Congress did not hike personal income tax rates to the perch they attained under the Carter Administration “The Republicans won” & Clinton-era tax hikes were of null effect.
I should also mention again that this article argues that crime is up everywhere & in almost the same breath says crime statistics are like an ink blot that can be tortured into whatever result you want. Doesn’t make sense, but then again I don’t think many of the authors at the Baffler make much sense.
Their stupidity & bad logic is indeed, baffling.
“And one more quote from the piece: “When a loose coalition of activists and organizers, led by an organization called the Vermont Racial Justice Alliance, launched a campaign for reform in Burlington, they listed a 30 percent reduction in uniformed officers as a key demand. Yet the request was shorthand for a more powerful vision, “an immediate restructuring of the entire public safety apparatus,” reparations, change. The cuts were voted through. Much of the rest was quickly trapped in a bureaucratic snarl of committees, reports, and consultants. The cops left, but nothing took their place; an “assessment” that was intended to suggest alternatives was delayed for more than a year, and then proved decidedly uncreative in scope, critiquing racial disparities in the agency’s policing but recommending that the department partially reverse its cuts and hire more cops—advice the city has been trying to heed. The creation of a limited crisis intervention team staffed by social workers has been promised but has not yet come to fruition… Progressive city councilors have won elections defending the police cuts. The discontent is imported, broadcasted, notching some victories, yes, but yet it has not yet won, and, for now, the cops have not yet returned. Their absence has become a sounding board, a tool, for those interested in preserving the status quo, but it was not meant to be. City leadership promised something new in their absence—not a lukewarm critique by high-paid consultants, not a social worker or two, but a sincere challenge to the institution of policing. For that, we are still waiting.”
Makes me hearken back to something Thomas E. Woods said a few years ago – If you are going to replace the police, I want to hear what you’re going to replace it with before I sign on.
It sounds like Burlington, in typical Progressive fashion (and referring to Democrats in Burlington as “right wing” because they’re only opposed by Regressives would be akin to referring to Hitler as “right wing” because he wasn’t a Communist) just burned the building down (metaphorically speaking) without having any blue prints, without hiring anyone or having any plan to construct a new building. You will reap what you sow Burlington & what you sow, so shall you reap.
In closing, the crime wave in America is largely a Democrat Crime Wave & it has several facets.
One, defund the police/reduce the number of LEOs OR intimidate the police into no pro-active policing in high crime areas. This makes it much harder to apprehend carjackers, purse snatchers, meth dealers & vagrants who assault old ladies because the police won’t be anywhere near the crime scene. They know where the crime is occurring, they need to be there. This also ensures that the next time the fatherless #blacklivesmatter terrorists go on a rampage to intimidate the public into giving them what they want or else –the police will not be there to stop them.
Two, when Kyle Rittenhouse or another good guy w/ a gun goes out & stops the next riot that happens, the Democrats want to jail him for murder. This ensures that the next time the fatherless #blacklivesmatter terrorists go on a rampage to intimidate the public into giving them what they want or else – nobody (including the police) will not be there to stop them.
Three, Soros-backed prosecutors will continue to let violent criminals out of jail so they can go back into society & terrorize the public.
Do you think that CHAZ/CHOP crap that went on for 3 weeks would have lasted more than a few hours in Iowa? If these lunatics tried to cordon off an area in rural Iowa (after driving their in their rusted-out Priuses) do you think the locals would tolerate that?
No, they would not & the County Sheriff would be there very soon to disband it because he knows the locals will do it for him if he doesn’t.
That’s why that crap was able to continue in Seattle for so long, because they have a #blacklivesmatter culture & the stench of racism always fills their nostrils, even if it is their upper lip providing the odor.
It will be interesting to see how it goes in Burlington over the next few years, I personally hope they do this again, so they can be another petri dish demonstrating what happens when you eschew law-and-order for chaos.
Mr. Chairman, I Yield Back
NOTE: Sarah George indeed wants to end cash bail & allow some violent, dangerous people back on the streets https://www.sevendaysvt.com/OffMessage/archives/2020/09/16/states-attorney-sarah-george-to-end-cash-bail-in-chittenden-county https://vtdigger.org/2020/09/17/prosecutor-ends-requests-for-cash-bail-aiming-to-make-justice-system-more-fair/ https://www.vermontpublic.org/vpr-news/2020-09-18/why-chittenden-county-states-attorney-sarah-george-wants-to-end-cash-bail https://www.acluvt.org/en/news/guest-blog-ending-cash-bail-sarah-george This is a YUUUGE problem
My essays on homicide demonstrate that Seattle is having issues because of a reduction of police officers due to demonization & that’s why you won’t see a police officer show up quickly if your car is stolen, provided there are no violent crimes going along w/ that.
Baltimore has seen 60+ more homicides because violent lunatics were not required to serve their full sentences. In Dallas, 1 in 3 murder suspects are being released after posting bail https://www.fox4news.com/news/dallas-violent-crime-bail-murder https://www.dallasnews.com/opinion/editorials/2022/11/21/violent-suspects-released-too-often-in-dallas-county/ and this is particularly alarming: “Other stats are disturbing, as well. According to this sampling, a person arrested in the robbery of a business or of an individual or who had been charged with a weapons violation is more likely to be rearrested and more likely to commit a violent crime while awaiting trial than a person charged with murder.”
So, it’s those who are jailed for offenses inferior to homicide (how many cars does one have to steal before you lock them away for decades & how many aggravated assaults does one have to commit before he gets 25 years?) that are posting an even greater risk.
New York City has seen eye-popping amounts of criminal recidivism because of Soros-backed prosecutors & Minneapolis is seeing increased response times due to their demonization of the police.
Burlington, VT might be on that same road. Sarah George is pushing policies that have turned New York City, San Francisco & Los Angeles from basically safe large cities into a Mad Max wasteland. You made your bed, now sleep in it.
The real #INSURRECTION is a Democrat #INSURRECTION
#samseder #majorityreport Stan Seder is afraid to debate my friend James Patrick Holding on The Impossible Faith. https://tektonics.org/lp/nowayjose.php Methinks Stan lacks confidence in that religion degree from a diploma mill #samsederwontdebateJPH
76
views

Divorcee Sam Seder vs. UTubekookdetector (Iowa Homicide)
Continuing my long series (which will have a playlist at some point) on the most violent jurisdictions in America. They have lots of black on black homicide & they overwhelmingly vote Democrat.
#samseder #majorityreport
The Divorcee Sam Seder has already conceded this as a fact. Why are his voters so violent?
Iowa is a low homicide state w/ a lot of black on black crime -- the cities w/ the worst homicide rates tend to elect or vote for a lot of Democrats. Different state, same story. The U.S. crime wave is a Democrat Crime Wave. #blacklivesmatter
http://freewebs.com/professor_enigma/covid-increase-homicides http://freewebs.com/professor_enigma/votechrisschwartz-black-hawk
Sam Seder is afraid to debate my friend James Patrick Holding on The Impossible Faith. https://tektonics.org/lp/nowayjose.php Methinks Stan has little confidence in that religion degree from a diploma mill.
***
The most violent cities in Iowa…. Vote Democrat
This is a follow-up to material already posted @ http://freewebs.com/professor_enigma/covid-increase-homicides http://freewebs.com/professor_enigma/votechrisschwartz-black-hawk
https://icrime.dps.state.ia.us/CrimeInIowa/Report/DrillDownReports (NOTE to self & everyone, DO NOT use this, as the counts may not match up – there is even a note explaining this but I ignored it to my own peril. I’m glad I use multiple sources)
I do need to mention this at the outset, I tried to replicate my data & then I was going to add Marshalltown (a friend notified me that I should add it was well) & tally the number of murder/non-negligent manslaughter incidents using *state* data.
The State of Iowa data has oddly changed drastically & the number of incidents for those cities is much lower. Why? I am not sure, but I thought I should mention that. I even have screenshots of some of my previous data to prove to you that I saw what I saw & now the total is different. Frustrating, to say the least. http://freewebs.com/professor_enigma/covid-increase-homicides
You will also see that sometimes Murder/Non-Negligent Manslaughter counts change as authorities explore a crime more thoroughly and/or a suspect goes to court & ends up getting charged & convicted on something like negligent manslaughter, which would change the tally.
I used this https://icrime.dps.state.ia.us/CrimeInIowa/Report/MurderCrimeByORIReport (make sure you exclude everything except Murder/Non-Negligent Manslaughter, DO NOT include Justifiable Homicides or Negligent Manslaughter) to check Ames, Cedar Rapids, Council Bluffs, Davenport, Des Moines, Fort Dodge, Iowa City, Marshalltown & Waterloo.
Here is the Murder/Non-Negligent Manslaughter tally (2016-21): Waterloo (31), Des Moines (I cannot get any data for them now with the link above or with https://icrime.dps.state.ia.us/CrimeInIowa/Report/AgencySummaryReport so that is likely the origin of my issue & why my count cannot be replicated!), Ames (8), Cedar Rapids (40), Council Bluffs (13), Davenport (48), Fort Dodge (11), Iowa City (9) & Marshalltown (7).
That’s comes to (if I use DSM PD data et al. data to fill in the blanks they had 94 murders 2016-21) 261 criminal homicides (cumulative 2016-21 population of those cities = 4,644,190) & a homicide rate = 5.619 per 100,000 – well beyond the Iowa state average.
Those same cities 2016-2021, according to the FBI https://cde.ucr.cjis.gov/LATEST/webapp/ (update your bookmarks) those same cities: Ames (8), Cedar Rapids (41), Council Bluffs (13), Davenport (46), Des Moines (94), Fort Dodge (11), Iowa City (9), Marshalltown (6) & Waterloo (32) = 260. 55.55% of all Iowa homicides & very close to the Iowa State Data.
FUN FACT (using FBI Murder totals): Waterloo (2016-21 cumulative population 405,041) had a homicide rate of 7.9 per 100,000. Fort Dodge (2016-21 cumulative population 146,403) had a homicide rate of 7.513 per 100,000. Des Moines (2016-21 cumulative population 1,290,251) had a homicide rate of 7.285 per 100,000. Davenport (2016-21 cumulative population 611,344) had a homicide rate of 7.524 per 100,000. Marshalltown had a 2016-21 cumulative population of 163,340 & a homicide rate of 3.5673 per 100,000. If they had one more homicide (as the Iowa data claims), it would push it to 4.285, which is a big deal for a city that size. One homicide in Detroit isn’t even a rounding error. Cedar Rapids (2016-21 cumulative population 804,222) had a homicide rate of 5.098 per 100,000.
Davenport, Des Moines, Marshalltown, Fort Dodge, Cedar Rapids & Waterloo had a cumulative 2016-21 population of 3,420,601 & 230 homicides in the same time frame (homicide rate = 6.723 per 100,000). Those cities had (Iowa population 2016-21 is 18,960,057) 18.041% of Iowa’s population, but 49.14% of all its homicides. Let that sink in – they are the worst of the worse in the Hawkeye State & most of the state is very safe.
According to the FBI (I tallied this incorrectly prior & will correct it in my previous essays) Iowa (cumulative 2016-2021 population is 18,960,057) had 468 homicide offenses (74, 98, 45, 70, 111, 70) 2016-2021, which is a homicide rate of 2.468 per 100,000.
The U.S. rate https://www.statista.com/statistics/191134/reported-murder-and-nonnegligent-manslaughter-cases-in-the-us-since-1990/ (112,650 homicides, 1,966,196,900 cumulative population) from 2016-2021 = 5.729 per 100,000.
Now for election data showing who these entities vote for, most of it will not surprise you. https://sos.iowa.gov/elections/results/index.html
Well, if your name is the bi-polar divorcee Sam Seder or a fat toad from Black Hawk County, Iowa named Chris Schwartz, it may surprise you.
***
Let us start w/ Iowa City. I am not going to tally all the percentages because I am lazy, but this will give you a good idea though
2014 Gubernatorial: Branstad/Reynolds 6,777 * Hatch/Vernon 15,766
2018 Gubernatorial: Reynolds/Gregg 6,402 * Brain Dead Fred Hubbell 26,855
2022 Gubernatorial: Reynolds/Gregg 5,574 * The Fat Little Hobbit DeJear 23,573
2016 POTUS: Donald Trump 7,332 * Mrs. Bill Clinton 26,476
2020 POTUS: Donald Trump 7,522 * Kid Sniffer Joe Biden 31,260
I don’t even have to cover any State House races, these totals are indicative that Iowa City is part of Crazy Town, period.
Waterloo
2014 Gubernatorial: Branstad/Reynolds 9,768 * Hatch/Vernon 11,385
2018 Gubernatorial: Reynolds/Gregg 8,895 * Brain Dead Fred Hubbell 14,132 (All 3 House District races were won easily by Democrats in Waterloo)
2022 Gubernatorial: Reynolds/Gregg 9,255 * The Fat Little Hobbit DeJear 10,136 (State House Districts 61 & 62, which are part of Waterloo were won easily by the Dumocrat) I am doing this tally as Reynolds won Black Hawk County, but not Waterloo. Black Hawk County is one of the high homicide counties in Iowa, but most of that is hood rat on hood rat violence in…. Waterloo. (wink wink)
2016 POTUS: Donald Trump 10,952 * Mrs. Bill Clinton 16,707
2020 POTUS: Donald Trump 11,810 * Kid Sniffer Joe Biden 17,853 (all 3 State House District elections in Waterloo saw Democrats either run unopposed or win decidedly there)
Des Moines
2014 Gubernatorial: Branstad/Reynolds 23,455 * Hatch/Vernon 36,840
2018 Gubernatorial: Reynolds/Gregg 22,121 * Brain Dead Fred Hubbell 54,682
2022 Gubernatorial: Reynolds/Gregg 20,849 * The Fat Little Hobbit DeJear 42,216 (All Iowa House races that were all or part of Des Moines saw Democrats win overwhelmingly among Des Moines voters. It has been this way for some time, peruse the Excel files from past election cycles if you do not believe me. Des Moines is the capital of Iowa & is also the capital of Crazy Town)
2016 POTUS: Donald Trump 27,178 * Mrs. Bill Clinton 56,858
2020 POTUS: Donald Trump 30,328 * Kid Sniffer Joe Biden 64,531
Des Moines has some very dangerous neighborhoods & a bevy of drug addicts – they all vote Democrat. Surprise!!!
Fort Dodge
2014 Gubernatorial: Branstad/Reynolds 4,541 * Hatch/Vernon 3,076
2016 POTUS: Donald Trump 5,456 * Shillary Clintonoid 4,403 (House District 9 was won by the Dumocrat in Fort Dodge easily)
2018 Gubernatorial: Reynolds/Gregg 4,156 * “Brian Dead” Fred Hubbell 4,099 (This particular Excel format is much better than previous years) You’ll see Megan L. Srinivas had to move (she won Fort Dodge proper in House District 9, but lost the overall race) to crazy town so she could get elected. Megan fits in well w/ mentally ill people who think they can hang out in the women’s restroom, even if they have a penis. She lost bigly outside Fort Dodge.
2020 POTUS: Donald Trump 5,860 * “Lunch Bucket” Joe Biden 4,594 (House District 9 won by GOP handily in Fort Dodge)
2022 Gubernatorial: Reynolds/Gregg 4,496 * “Bilbo Baggins” Deidre DeJear 2,674 (House District 8, the Dums did not even bother running anyone)
I will have to say, I did not think Fort Dodge skewed that much towards the GOP, you can see how it has shifted mightily in less than a decade
Ames (Does not have a high homicide rate compared to the national average or for Iowa, but just keep this bookmarked, I think it is going to get worse there)
2014 Gubernatorial: Branstad/Reynolds 8,799 * Some idiot named Jack Hatch 9,834
2016 POTUS: Donald Trump 10,352 * “Bimbo Alert Squad” Hillary Clinton 18,956 (House District 45 won by Democrat in Ames handily)
2018 Gubernatorial: Kim Reynolds 8,470 * An idiot named Fred Hubbell 18,065 (House Districts 45 & 46 easily won by the Dums in Ames)
2020 POTUS: Donald Trump 9,721 * “Plugs” Biden 21,036 (Ames overwhelmingly voted for the Dums in Iowa House Districts 45 & 46)
2022 Gubernatorial: Kim Reynolds 7,442 * Overweight Deidre DeJear 14,262 (Ames overwhelmingly voted for the Dumocrat in Iowa House Districts 49 & 50)
Marshalltown
2014 Gubernatorial: Branstad/Reynolds 4,075 * Some idiot named Jack Hatch 3,875
2016 POTUS: Donald Trump 4,875 * “Bimbo Alert Squad” Hillary Clinton 4,739 (The Democrat running for House District 71 won easily, ran unopposed)
2018 Gubernatorial: Kim Reynolds 3,734 * An idiot named Fred Hubbell 4,743 (The Democrat won Marshalltown’s portion of House District 71 easily)
NOTE: I AM NOT sure the totals for 2016 & 2014 are totally correct because the ways the county used to identify the polling location in those years make it uber-difficult to determine where exactly inside the county the polling location is. SORRY!
2020 POTUS: Donald Trump 4,783 * “Plugs” Biden 5,741 (Marshalltown voted overwhelmingly for the Dumocrat in House District 71)
2022 Gubernatorial: Kim Reynolds 3,648 * Overweight Deidre DeJear 3,075 (Dumocrat nominee in Iowa House District 52 was unopposed)
Council Bluffs (has a high homicide rate compared to the Iowa average)
2014 Gubernatorial: Branstad/Reynolds 18,452 * Jack Hatched a plan to make himself look stupid 5,324
2016 POTUS: The Donald 13,111 * The Cackling Troglodyte 10,554 (House District 16, CB voted for the GOP candidate)
2018 Gubernatorial: Reynolds 9,958 * Brain Dead Fred 9,639 (GOP wins Iowa House District 16 in CB, the Dummycrat won House District 15 decisively)
2020 POTUS: The Donald 13,960 * The Kid Sniffer 12,563 (Dumocrat wins IA House District 15, GOP wins District 16)
2022 Gubernatorial: Reynolds 9,161 * The Hobbit 6,818 (CB votes for GOP candidate in House District 19, The Dem won District 20)
Davenport
2014 Gubernatorial: Branstad/Reynolds 17,277 * “Village Idiot” Jack Hatch 13,865 (Dumocrat runs unopposed in House Districts 89 & 90, wins Districts 92 & 93 in Davenport. Districts 89 & 90 are the biggest chunk of Davenport. 89 & 90 remained in Dumocrat hands until redistricting)
2016 POTUS: The Donald 18,222 * Mrs. Bill Clinton 24,775
2018 Gubernatorial: Kim Reynolds 14,640 vs. “Brain Dead” Fred Hubbell 20,681
2020 POTUS: Orange Man Bad vs. “Dementia” Joe Biden ** I am NOT tallying this as the form is supposed to be Excel (which makes it easy for me to tabulate), but it comes out as a PDF. Trump did not win many precincts in Davenport, so a cursory evaluation tells me Biden won & it was substantial. However, I am not going to be exact because it would take too much time. Pfft!
2022 Gubernatorial: Reynolds 14,666 * “Bilbo Baggins” DeJear 15,495 (GOP wins IA House District 81 in a nailbiter, Districts 97 & 98 were easy Democrat wins)
Cedar Rapids
2014 Gubernatorial: Branstad/Reynolds 22,801 * “Outback” Jack Hatch 24,208 (Dumocrats win Districts 65, 66, 69 & 70 unopposed, those Districts cover the lion’s share of CR. Those seats remained in Dumocrat hands until redistricting)
2016 POTUS: The Donald 24,579 * The Cackling Old Hillary 36,527
2018 Gubernatorial: Reynolds 21,018 * Barney Hubbell 34,650
2020 POTUS: The Donald 26,418 * The Dementia Patient Joe Biden 43,419
2022 Gubernatorial: Reynolds 20,473 * The Fat Lady 28,657 (Dummycrats won House Districts 74, 77, 78, 79 & 80 easily, the latter four cover most of CR)
Cedar Rapids has a growing homicide problem, is one of Iowa’s very few dangerous cities, they have a lot of black on black violence & they overwhelmingly vote Democrat. Surprised?
This concludes another essay on the most violent jurisdictions in America – they vote Democrat. Does not matter if it is Missouri, Michigan, Illinois, Tennessee or ever Iowa – elect Democrats & your cities will turn into Portland.
429
views
3
comments

Eric Swallwell loses bets to UTubekookdetector & Senator Ted Cruz
Eric Swallwell opens mouth, inserts feet & knees.
Eric Swallwell loses two bets, one to Senator Ted Cruz & the other to You Tube’s official Kook Detector, UTubekookdetector
I will bet Eric Swallwell that the black on black homicide rate in 2023 will be >2X the white on white rate & that the most violent jurisdictions in America have lots of black on black homicide & they vote Democrat overwhelmingly.
Concession accepted Eric!!!!
http://freewebs.com/professor_enigma/covid-increase-homicides
http://freewebs.com/professor_enigma/sam-seder-ilhan-omar-racism3
34
views

Divorcee Sam Seder Debunked on "Republican Voter Suppression"
A talking point that is oft-repeated by mentally ill divorcees like Sam Seder #samseder #majorityreport gets debunked
Republican Voter Suppression?
Iowa
https://www.ncsl.org/research/elections-and-campaigns/voter-id.aspx
https://www.ncsl.org/research/elections-and-campaigns/voter-id-chronology.aspx
https://ballotpedia.org/Voter_ID_in_Iowa
https://apnews.com/article/f0591c6afacb4fb1b83e9bdae79740de
https://www.radioiowa.com/2019/10/01/judge-upholds-id-requirement-for-election-day-voting-in-iowa/
https://uselectionatlas.org/RESULTS/
See the notes on some of these states as some Photo ID Voter laws were rolled out in phases and/or challenged in court by Democrats who want people willy-nilly voting sans any identification.
I have provided some links to articles about these Voter ID/Photo ID Voting laws & it’s the same song from the Regressive Communists no matter what – voters are being suppressed & it is poor minorities who vote Democrat.
They do not want people removed from voter rolls if they fail to vote in 3 Federal Elections, they do not want people giving any sort of identification (although a lot of states allow for numerous types of ID), they do not want ID’s presented, they do not want people disqualified from voting in the wrong precinct, they do not like it when there are not dropboxes everywhere for folks to dump dozens votes in at 3AM & if you don’t have a million early voting days & months & months of voting prior to Election Day they have a hissy fit.
They do NOT want people being identified at the polls or anywhere else for that matter, period. Just autistically-repeating, “drop boxes increase turnout, therefore good unga bunga” is nonsense. I’m sure if the government dropped PSAs every hour on the hour to get free training for a firearm & purchase one, we would have a lot more folks buying guns, but doing X just to do X is nonsense.
I will be focusing on POTUS elections years & also midterm elections. If the state I am examining does NOT have a gubernatorial race in a midterm, I will use the years (most Gubernatorial races are either at the midterm or a POTUS election) that they do have a Gubernatorial contest & compare those increases/decreases in turnout w/ national results.
I am purposely going back to at least 1992 for POTUS elections (unless their voter id law does not go back very far) as the # of raw votes decreased in the next POTUS election cycle, we’ll compare that to increases/decreases in those states that are “engaging in Republican voter suppression.”
Let us begin!
Iowa
2000 IA POTUS election, total votes cast = 1,315,563
2004 IA POTUS election, total votes cast = 1,506,908 [+14.55%]
2008 IA POTUS election, total votes cast = 1,537,123 [+2.01%]
2012 IA POTUS election, total votes cast = 1,582,180 [+2.93%] *Iowa bucked the 2012 trend of less raw votes, but in 1996 about 120,000 less votes were cast, relative to 1992 (that was a national trend). Iowa also bucked the national trend in 2016, as less votes were cast, relative to 2012*
2016 IA POTUS election, total votes cast = 1,566,031 [-1.02%]
2002 IA Gubernatorial election, total votes cast = 1,025,802
2006 IA Gubernatorial election, total votes cast = 1,053,255 [+2.67%]
2010 IA Gubernatorial election, total votes cast = 1,122,013 [6.53% increase in total votes cast]
2014 IA Gubernatorial election, total votes cast = 1,131,258 [+0.825%]
2018 IA Gubernatorial election, total votes cast = 1,327,638 [+17.35%]
***Voter ID law fully implemented in 2019***
2022 IA Gubernatorial election, total votes cast = 1,221,864 [-7.97%]
2020 IA POTUS election, total votes cast = 1,690,871 [+7.97%]
Average increase/decrease in IA POTUS elections 2000-2020 = +5.288%. That is lower than the 2020 increase, sorry there is not more data to peruse, it is what it is.
Average increase/decrease in IA Gubernatorial elections, 2002-2022 = +3.881%.
That is much higher than the one gubernatorial election after the Photo ID law. Now, the bi-polar divorcee Sam Seder might say, “Aha, voter suppression.”
Or it could be that the fat lady that Iowa Democrats nominated (because nobody apparently wanted this task) was a horrible speaker & a race trader that even her party could not get excited about.
She had no political experience (not that it is necessarily bad) & it showed, a lot. Fred Hubbell at least was a successful businessman; he got a lot more votes than Deidre DeJear & the only folks who pulled the lever for her were already lifetime inmates in Crazy Town.
It may not be voter suppression, but lack of excitement about a flawed candidate who had a deck full of race cards.
***
Indiana
1992 IN Gubernatorial election, total votes cast = 2,229,116
1996 IN Gubernatorial election, total votes cast = 2,110,047 [-5.34%]
2000 IN Gubernatorial election, total votes cast = 2,179,268 [+3.28%] *2000 turnout LOWER than 1992 turnout*
2004 IN Gubernatorial election, total votes cast = 2,448,498 [+12.35%]
1992 IN POTUS election, total votes cast = 2,305,871
1996 IN POTUS election, total votes cast = 2,135,842 [-7.373%]
2000 IN POTUS election, total votes cast = 2,199,302 [+2.97%] *2000 turnout LOWER than 1992 turnout*
2004 IN POTUS election, total votes cast = 2,468,002 [+12.22%]
Photo ID law christened by the SCOTUS, despite the grinding of yellow Democrat teeth
2008 IN Gubernatorial election, total votes cast = 2,703,752 [+10.42%]
2012 IN Gubernatorial election, total votes cast = 2,581,053 [-4.54%]
2016 IN Gubernatorial election, total votes cast = 2,719,968 [+5.38%]
2020 IN Gubernatorial election, total votes cast = 3,020,388 [+11.045%]
2008 IN POTUS election, total votes cast = 2,756,658 [+11.7%]
2012 IN POTUS election, total votes cast = 2,633,143 [-4.48%]
2016 IN POTUS election, total votes cast = 2,760,375 [+4.83%]
2020 IN POTUS election, total votes cast = 3,039,781 [+10.12%]
Average decrease/increase in raw votes, IN Gubernatorial elections 1992-2020 = +4.656% [National average = +7.352%]
Average decrease/increase in raw votes, IN Gubernatorial elections, AFTER VOTER ID, 2008-2020 = +5.576% [National Avg. = +7.829%]
Average decrease/increase in raw votes, IN Gubernatorial elections PRIOR TO VOTER ID, 1992-2004 = +3.43% [National Average = +6.713%]
Average decrease/increase in raw votes, IN POTUS elections 1992-2020 = +4.283% [National average = +6.465%]
Average decrease/increase in raw votes, IN POTUS elections after VOTER ID LAW, 2008-2020 = +5.542% [National avg. = +6.888%]
Average decrease/increase in raw votes, IN POTUS elections PRIOR TO VOTER ID LAW, 1992-2004 = +2.605% [National Average = +5.902%]
It would be hard for bi-polaroids like the divorcee Sam Seder to argue that Photo ID requirements in Indiana are disenfranchising voters as their raw vote increases were much larger after they strengthened voting requirements.
Notice how IN’s increases (relative to the baselines I established) were always lower than the national increases, they always lagged behind sans Voter ID or with it ensconced.
***
Wisconsin
2000 WI POTUS election, total votes cast = 2,598,607
2004 WI POTUS election, total votes cast = 2,997,007 [+15.34%]
2008 WI POTUS election, total votes cast = 2,983,417 [-0.454%]
2012 WI POTUS election, total votes cast = 3,068,434 [+2.85%] *notice how their turnout increases/decreases in the 2008, 2012 & 2016 POTUS elections were contrary to the national trend*
1998 WI Gubernatorial election, total votes cast = 1,756,014
2002 WI Gubernatorial election, total votes cast = 1,775,349 [+1.1%]
2006 WI Gubernatorial election, total votes cast = 2,161,700 [+21.76%]
2010 WI Gubernatorial election, total votes cast = 2,160,832 [-0.04%]
2014 WI Gubernatorial election, total votes cast = 2,410,314 [+11.55%]
Evil Photo ID law rolled out in WI
2016 WI POTUS election, total votes cast = 2,976,150 [-3.007%]
2020 WI POTUS election, total votes cast = 3,298,041 [+10.815%]
2018 WI Gubernatorial election, total votes cast = 2,673,308 [+10.907%]
2022 WI Gubernatorial election, total votes cast = 2,656,490 [-0.63%]
Average increase/decrease in raw votes, WI Gubernatorial elections 1998-2022 = +7.411% [National Avg. = +8.320%]
Average increase/decrease in raw votes, WI Gubernatorial elections, PRIOR TO PHOTO ID Law, 1998-2014 = +8.592% [National average = +2.851%]
NOTE: I used 1998 as my baseline, so averaged the 2002, 2006, 2010 & 2014 election years, remember that!
Average increase/decrease in raw votes, WI Gubernatorial elections, AFTER PHOTO ID Law, 2018 & 2022 = +5.138% [National average = +19.258%]
Average increase/decrease in raw votes, WI POTUS elections 2000-2020 = +5.108% [National avg. = 8.844%]
Average increase/decrease in raw votes, WI POTUS elections 2016 & 2020, AFTER PHOTO ID LAW = +3.904% [National avg. = 10.877%]
Average increase/decrease in raw votes, WI POTUS elections, PRIOR TO PHOTO ID LAW, 2000-2012 = +5.912% [National average = +7.827%]
I wish I had one more election cycle after Photo ID, I think it would be more informative & I tried to balance this out (equal number of cycles before & after) when I averaged it.
A Democrat will definitely try to argue that WI’s voter ID laws are stifling turnout. A Republican could say, “You won WI in 2020 & won the Gubernatorial races in the last 2 cycles, what’s the problem?”
There could still be voter suppression even if the party that is declaring it wins, just as voter fraud could still be a problem, even if Republicans do well.
WI bucked national trends in 2008, 2021 & 2016 as noted above & two cycles were prior to Photo ID.
~13,500 less votes were cast in 2008 than in 2004 in Badgerville. Was that voter suppression or more likely the fact that Republican voters were NOT excited about John McCain as he received 215,000 less votes than George W. Bush 4 years prior? Combine that with turnout for Obama was much better than it was for the French-looking candidate, John Francois Kerry.
***
Tennessee
1994 TN Gubernatorial election, total votes cast = 1,487,130
1998 TN Gubernatorial election, total votes cast = 976,236 [-34.354%]
2002 TN Gubernatorial election, total votes cast = 1,653,167 [+69.34%]
2006 TN Gubernatorial election, total votes cast = 1,818,549 [+10%]
2010 TN Gubernatorial election, total votes cast = 1,601,549 [-11.93%]
1992 TN POTUS election, total votes cast = 1,982,638
1996 TN POTUS election, total votes cast = 1,894,105 [-4.465%]
2000 TN POTUS election, total votes cast = 2,076,181 [+9.61%]
2004 TN POTUS election, total votes cast = 2,434,949 [+17.28%]
2008 TN POTUS election, total votes cast = 2,601,982 [+6.86%]
***2012 Photo ID law rolled out***
2014 TN Gubernatorial election, total votes cast = 1,353,728 [-15.47%]
2018 TN Gubernatorial election, total votes cast = 2,243,294 [+65.71%]
2022 TN Gubernatorial election, total votes cast = 1,737,454 [-22.55%]
2012 TN POTUS election, total votes cast = 2,460,904 [-5.42%]
2016 TN POTUS election, total votes cast = 2,508,027 [+1.92%]
2020 TN POTUS election, total votes cast = 3,053,851 [+21.752%]
Average increase/decrease in raw votes, TN Gubernatorial elections 1994-2022 = +8.678% [National avg. = +6.617%]
Average increase/decrease in raw votes, TN Gubernatorial elections after evil Photo ID law rolled out, 2014-2022 = +9.23% [National Average = +10.010%]
Average increase/decrease in raw votes, TN Gubernatorial elections PRIOR TO Photo ID law, 1994-2010 = 8.264% [National avg. = +4.075%]
Average increase/decrease in raw votes, TN POTUS elections 1992-2020 = +6.791% [National avg. = +6.465%]
Average increase/decrease in raw votes, TN POTUS elections AFTER VOTER ID, 2012-2020 = +6.084% [National avg. = +6.684%]
Average increase/decrease in raw votes, TN POTUS elections PRIOR TO VOTER ID, 1992-2008 = +7.321% [National average = +6.301%]
***
Mississippi
1999 MS Gubernatorial, total votes cast = 763,937
2003 MS Gubernatorial, total votes cast = 894,487 [+17.08%]
2007 MS Gubernatorial, total votes cast = 744,039 [-16.82%]
2011 MS Gubernatorial, total votes cast = 891,952 [+19.88%]
2000 MS POTUS election, total votes cast = 994,926
2004 MS POTUS election, total votes cast = 1,152,365 [+15.82%]
2008 MS POTUS election, total votes cast = 1,289,939 [+11.94%]
2012 MS POTUS election, total votes cast = 1,285,584 [-0.34%]
***2014 Voter ID law takes effect***
2015 MS Gubernatorial, total votes cast = 718,185 [-19.48%]
2019 MS Gubernatorial, total votes cast = 884,911 [+23.21%]
2016 MS POTUS election, total votes cast = 1,211,088 [-5.79%]
2020 MS POTUS election, total votes cast = 1,314,475 [+8.54%]
Average increase/decrease in raw votes, MS Gubernatorial contests 1999-2019 = +4.774% [National average = +4.262%]
Average increase/decrease in raw votes, MS Gubernatorial contests PRIOR TO VOTER ID, 1999-2011 = +6.713% [National average = +2.831%] NOTE: Remember, on the national level I am also using 1999 as my baseline, so it’s the average increases in the 2003, 2007 & 2011 contests.
Average increase/decrease in raw votes, MS Gubernatorial contests after Voter ID law 2015 & 2019 = +1.865% [National average = +19.191%]
Average increase/decrease in raw votes, MS POTUS contests 2000-2020 = +6.034% [National avg. = 8.844%]
Average increase/decrease in raw votes, MS POTUS PRIOR TO Voter ID, 2000-2012 = +9.14% [National avg. = +7.827%]
Average increase/decrease in raw votes, MS POTUS after Voter ID 2016 & 2020 = +1.375% [National average = +10.877%]
As is the case w/ TN, MS elections have seen wild fluctuations in raw vote totals sans or with a Voter ID Law. MS is an anomaly, while their 2012 turnout was lower, fitting w/ the national trend, their 2016 turnout plummeted in a state that has been leaning Republican (prior to 2010, the Democrats had a stranglehold on the State Legislature) for several years.
Donald Trump received about 10,000 fewer votes than Romney yet won the state +17.5 & Romney won MS +11.5. This indicates both sides were not excited about their candidate, especially MS Democrats who flocked to vote for Barack Obama twice & abandoned elderly, wrinkled white trash Hillary Clinton in 2016.
I wish I had one more post-Voter ID election to hash out as that would give us a better idea. For what it’s worth, their 1995 Gubernatorial tilt had a lot more votes cast than 4 years later.
***
Kansas
1998 KS Gubernatorial, total votes cast = 742,665
2002 KS Gubernatorial, total votes cast = 835,690 [+12.52%]
2006 KS Gubernatorial, total votes cast = 849,700 [+1.689%]
2010 KS Gubernatorial, total votes cast = 838,790 [-1.286%]
1992 KS POTUS election, total votes cast = 1,157,236
1996 KS POTUS election, total votes cast = 1,074,300 [-7.167%]
2000 KS POTUS election, total votes cast = 1,072,216 [-0.195%]
2004 KS POTUS election, total votes cast = 1,187,756 [+10.78%]
2008 KS POTUS election, total votes cast = 1,238,873 [+4.3%]
***2012 Voter ID law enforced****
2014 KS Gubernatorial, total votes cast = 869,502 [+3.66%]
2018 KS Gubernatorial, total votes cast = 1,054,622 [+21.299%]
2022 KS Gubernatorial, total votes cast = 994,477 [-5.705%]
2012 KS POTUS election, total votes cast = 1,157,532 [-6.57%]
2016 KS POTUS election, total votes cast = 1,197,570 [+3.46%]
2020 KS POTUS election, total votes cast = 1,377,484 [+15.02%]
Average increase/decrease in raw votes KS Gubernatorial elections 1998-2022 = +5.362% [National average during those years = +8.320%]
NOTE: I am using 1998 as my baseline, therefore I’m averaging the increases in raw totals for the 2002-2022 elections, REMEMBER THAT! I had to redo some totals because I made that mistake myself!
Average increase/decrease in raw votes KS Gubernatorial elections PRIOR TO VOTER ID law, 1998-2010 = +4.307% [National average = +6.63%]
Average increase/decrease in raw votes KS Gubernatorial elections after Voter ID law, 2014-2022 = +6.418% [National avg. = +10.010%]
I did not include this, but the 1994 KS Governor’s race had a lot more votes cast then the 1998 edition. That would have skewed it more in my favor. Voter suppression or lack of interest in the candidates and/or the entire political process?
Increases in raw votes for Gubernatorial contests increased substantially overall after Voter ID laws, making it hard for the Dummycrats to argue “voter suppression.” Yet, they are still making that argument in Kansas.
Average increase/decrease in raw votes KS POTUS elections 1992-2020 = +2.84% [National avg. = +6.465%]
Average increase/decrease in raw votes KS POTUS elections after evil Voter ID law, 2012-2020 = +3.97% [National avg. = +6.684%]
Average increase/decrease in raw votes KS POTUS elections PRIOR TO evil Voter ID law, 1992-2008 = +1.929% [National average = +6.301%]
The increases were higher after Voter ID, making it much more difficult to argue for “voter suppression.” KS’ increases prior to Voter ID in POTUS elections was lagging well behind national trends, so this is not news after Voter ID.
***
North Dakota
2004 ND Gubernatorial, total votes cast = 309,873
2008 ND Gubernatorial, total votes cast = 315,692 [+1.88%]
2012 ND Gubernatorial, total votes cast = 317,812 [+0.675%]
2016 ND Gubernatorial, total votes cast = 339,601 [+6.857%]
2004 ND POTUS contest, total votes cast = 312,833
2008 ND POTUS contest, total votes cast = 317,738 [+1.57%]
2012 ND POTUS contest, total votes cast = 322,627 [+1.54%]
2016 ND POTUS contest, total votes cast = 344,360 [+6.735%]
***Voter ID law in 2018***
2020 ND Gubernatorial, total votes cast = 357,659 [+5.319%]
2020 ND POTUS contest, total votes cast = 361,819 [+5.07%]
Not a large swath of post-Voter ID info to cover, but for what it is worth.
Average increase/decrease in raw votes, ND Gubernatorial Elections 2004-2020 = +3.682%. The 2020 increase was higher.
Average increase/decrease in raw votes, ND POTUS Elections 2004-2020 = +3.728%. The 2020 increase was higher. I guess the voter suppression in ND will happen during Sam Seder’s next failed marriage.
***
Georgia
1994 GA Gubernatorial, total votes cast = 1,545,297
1998 GA Gubernatorial, total votes cast = 1,792,882 [+16.02%]
2002 GA Gubernatorial, total votes cast = 2,028,251 [+13.13%]
2006 GA Gubernatorial, total votes cast = 2,124,598 [+4.75%]
1992 GA POTUS election, votes cast = 2,321,133
1996 GA POTUS election, votes cast = 2,299,071 [-0.95%]
2000 GA POTUS election, votes cast = 2,596,804 [+12.95%]
2004 GA POTUS election, votes cast = 3,304,481 [+27.25%]
***2008 Georgia Voter ID Law*** https://www.heritage.org/election-integrity/commentary/georgias-voter-id-lawsuit-seven-years-later-disenfranchised-or-still https://law.georgia.gov/press-releases/2011-03-08/georgia-supreme-court-declares-voter-id-law-constitutional
2010 GA Gubernatorial, total votes cast = 2,576,161 [+21.255%]
2014 GA Gubernatorial, total votes cast = 2,550,648 [-0.9904%]
2018 GA Gubernatorial, total votes cast = 3,939,409 [+54.996%]
2022 GA Gubernatorial, total votes cast = 3,953,408 [+0.3553%]
2008 GA POTUS election, votes cast = 3,932,158 [+18.995%]
2012 GA POTUS election, votes cast = 3,908,369 [-0.6049%]
2016 GA POTUS election, votes cast = 4,146,825 [+6.103%]
2020 GA POTUS election, votes cast = 4,999,960 [+20.573%]
Average increase/decrease in raw votes, GA Gubernatorial contests prior to Voter ID law, 1994-2006 = +11.3% [National average = +3.599%]
Average increase/decrease in raw votes, GA Gubernatorial contests 1994-2022 = +15.645% [National avg. = +6.617%]
Average increase/decrease in raw votes, GA Gubernatorial contests after Voter ID law, 2010-2022 = +18.903% [National average = +8.911%]
Average increase/decrease in raw votes, GA POTUS contests 1992-2020 = +12.045% [National avg. for 1992-2020 was +6.465%]
Average increase/decrease in raw votes, GA POTUS contests after Voter ID law, 2008-2020 = +11.266% [National avg. during those same years = +6.888%]
Average increase/decrease in raw votes, GA POTUS contests PRIOR TO Voter ID law 1992-2004 = +13.083% [National Average = +5.902%]
Even after Voter ID/Photo ID laws, Georgia increases continued to outstrip national averages & in Governor’s clashes, it got even better.
In POTUS races, their turnout increases weren’t as high after Voter ID, but still much better than the national average, so much for the voter suppression narrative in GA.
***
Ohio
1994 OH Gubernatorial, total votes = 3,346,238
1998 OH Gubernatorial, total votes = 3,354,213 [+0.2388%]
2002 OH Gubernatorial, total votes = 3,228,992 [-3.733%]
1992 OH POTUS election, total votes = 4,939,964
1996 OH POTUS election, total votes = 4,534,434 [-8.209%]
2000 OH POTUS election, total votes = 4,705,457 [+3.772%]
2004 OH POTUS election, total votes = 5,627,908 [+19.603%]
***Voter ID law implemented in 2006*** https://www.nytimes.com/2006/11/01/us/politics/appeals-court-backs-ohio-on-voter-id.html https://publicintegrity.org/politics/elections/us-polling-places/ohio-voters-list-purges-strict-id-law-suppress-turnout/
2006 OH Gubernatorial, total votes = 4,022,754 [+24.583%]
2010 OH Gubernatorial, total votes = 3,852,469 [-4.233%]
2014 OH Gubernatorial, total votes = 3,055,913 [-20.676%]
2018 OH Gubernatorial, total votes = 4,435,820 [+45.155%]
2022 OH Gubernatorial, total votes = 4,134,877 [-6.7842%]
2008 OH POTUS election, total votes = 5,721,831 [+1.67%]
2012 OH POTUS election, total votes = 5,590,934 [-2.287%]
2016 OH POTUS election, total votes = 5,536,547 [-0.973%]
2020 OH POTUS election, total votes = 5,932,446 [+7.15%]
Average raw votes cast decrease/increase on OH Gubernatorial Elections 1994-2022 = +4.935% [National avg. = +6.617%]
Average raw votes cast decrease/increase on OH Gubernatorial Elections after Voter ID legislation 2006-2022= +7.608% [National avg. = +8.424%]
Average raw votes cast decrease/increase on OH Gubernatorial Elections PRIOR TO VOTER ID 1994-2002 = -1.747% [National avg. = +2.103%]
I will again mention that Donald Trump being POTUS or being on the ballot caused a massive surge in turnout.
Average raw votes cast decrease/increase on OH POTUS Elections 1992-2020 = +2.960% [National avg. for 1992-2020 was +6.465%]
Average raw votes cast decrease/increase on OH POTUS Elections after Voter ID legislation 2008-2020 = +1.39% [National avg. during that time frame = +6.888%]
Average increase/decrease in raw votes, POTUS elections for 1992-2004 = +5.902%. Ohio POTUS elections during that time frame = +5.055%
Ohio has suffered (unless you are worried about overpopulation) from anemic population growth over the past couple decades, this could be the explanation as to why their vote increases are not on par w/ national trends, not voter suppression.
Ohio average increases *always* lagged behind national trends as well, prior to or after Voter ID. I did not include this, but the 1990 OH Gubernatorial had a higher raw vote total than the 1994 Gubernatorial election & the national trend was the other way.
To conclude that OH’s flagging number of voters going to the polls is because of “vote suppression” is the area of mentally ill conspiracy theorists like Sam Seder who want everyone to vote sans ID.
***
National Data
First, the midterm traditional Gubernatorial contests. Most Governors’ races are contested in these years
1994 Gubernatorial elections, total votes cast [36 contests] = 60,108,805
1998 Gubernatorial elections, total votes cast = 57,945,780 [-3.599% decrease in votes from prior election cycle]
2002 Gubernatorial elections, total votes cast = 62,469,272 [+7.806%]
2006 Gubernatorial elections, total votes cast = 66,511,382 [+6.471%]
2010 Gubernatorial elections, total votes cast [I omitted the votes in UT from the grand total as that was a special election] = 70,244,753 [+5.613%]
2014 Gubernatorial elections, total votes cast = 64,284,317 [-8.485%]
2018 Gubernatorial elections, total votes cast = 91,918,835 [+42.988%]
2022 Gubernatorial elections, total votes cast = 87,809,411 [-4.471%]
Average raw votes cast decrease/increase, Midterm Gubernatorial elections 1994-2022 = +6.617%
You can see how Donald Trump being POTUS or being on the ballot caused turnout to surge.
Now for the Gubernatorial elections that take place in concert w/ POTUS contests
1992 Gubernatorial elections, total votes cast [11 contests, omitting RI due to their switch to 4-year terms after 1992, instead of 2-year terms] = 12,650,441
1996 Gubernatorial elections, total votes cast = 12,048,067 [-4.76%]
2000 Gubernatorial elections, total votes cast = 13,228,851 [+9.8%]
2004 Gubernatorial elections, total votes cast = 15,226,325 [+15.1%]
2008 Gubernatorial elections, total votes cast = 16,706,361 [+9.72%]
2012 Gubernatorial elections, total votes cast = 16,707,808 [+0.009%]
2016 Gubernatorial elections, total votes cast = 19,579,201 [+17.187%]
2020 Gubernatorial elections, total votes cast = 20,442,969 [+4.411%]
Average raw votes cast decrease/increase, POTUS-Year Gubernatorial elections 1992-2020 = +7.352%
Now for “off-year” Gubernatorial elections [KY, MS & LA have Gubernatorial contests in these years – I will omit any state (such as WV) that had “special elections” in these years]
1995 Gubernatorial elections, total votes cast = 3,353,628
1999 Gubernatorial elections, total votes cast (3 contests, KY, MS, LA) = 2,639,216 [-21.303%]
2003 Gubernatorial elections, total votes cast = 3,385,772 [+28.285%]
2007 Gubernatorial elections, total votes cast = 3,097,204 [-8.523%]
2011 Gubernatorial elections, total votes cast = 2,748,254 [-11.267%]
2015 Gubernatorial elections, total votes cast = 2,844,741 [+3.51%]
2019 Gubernatorial elections, total votes cast = 3,836,818 [+34.873%]
Average raw votes cast decrease/increase, off-year Gubernatorial elections 1995-2019 = +4.2625%
Now for POTUS elections
1992 POTUS election, total votes cast = 104,426,611
1996 POTUS, total votes cast = 96,275,640 [-7.805% decrease in votes relative to previous election cycle]
2000 POTUS, total votes cast = 105,425,985 [+9.504%]
2004 POTUS, total votes cast = 122,303,590 [+16.009%]
2008 POTUS, total votes cast = 131,473,705 [+7.498%]
2012 POTUS, total votes cast = 129,237,642 [-1.7008%]
2016 POTUS, total votes cast = 137,143,218 [+6.117%]
2020 POTUS, total votes cast = 158,590,894 [+15.6385%]
Average raw votes cast decrease/increase, POTUS elections 1992-2020 = +6.465%
You might ask, “Why are you not focusing on turnout averages?” There are a lot of states (Judicial Watch has exposed this more than a handful of times) that are lax at voter roll maintenance, failing to remove people who have moved, people who are dead, people who have not voted in a decade & they should not be on the voter rolls.
If a Voter ID law is passed by State X, mentally-ill folks like Sam Seder, the drug-addled hippie w/ no teeth (Old Fart Rants) & the people they copy talking points from will say, “That be goin’ to suppress der vote.”
When turnout spikes in the next few election cycles, they’ll still claim it, even when they have no proof.
Not everyone who is not locked up in prison or an insane asylum should vote, period. There are a lot of low-information (unfortunately, I know some people who are successful, but refuse to vote because they’re lazy, disinterested, don’t want to do the necessary work to become informed (and some of them know this) or just do not care/do not think they will make a difference) idiots out there (we saw this in the Obama years as turnout waned in 2012 because many of his supporters realized that his ascendence to the White House did not result in their lives suddenly becoming better) who rarely vote or never vote.
The Democrats do everything they can (even voting for them) to get them to the polls, everything but inform them on the issues. They give them some boilerplate talking points, some soft bigotry of low expectations – without government they cannot succeed.
Imagine if they did the same amount of work Thomas Sowell did to make his decisions on whom to vote for or if they did the same amount of work my friend James Patrick Holding https://www.tektonics.org/lp/nowayjose.php did to conclude that Jesus Christ was The Word in the Flesh, born of a virgin & resurrected for his sins?
They would be informed & likely would not be Democrats. But most people (even a lot of good people) do not want to do the necessary work – they’re lazy.
Ergo, just focusing on turnout is a non-starter. Groomer Democrats are *consistently* whining about suppression, even if turnout spikes beyond levels seen prior to numerous states instituting some form of Voter ID Law.
There are plenty of election deniers in the Dumocrat Party pushing the Big Lie, the lie of voter suppression, “not all the votes were counted” etc. https://rumble.com/v1ou9vw-kari-lake-decimates-the-democrat-media-on-the-big-lie.html
They’ve been parroting The Big Lie about allegedly stolen elections for decades, now they’re accusing others of what they habitually do & screeching like banshees about voter suppression is par-for-the-course.
***
Now for the grand finale, in states where I have enough, balanced data let us calculate them altogether (GA, IN, OH, KS & TN) versus national data.
For all elections in those entities *after* a Voter ID/Photo ID law was ensconced in Gubernatorial & POTUS elections the avg. increase in raw votes was (this is 37 data points kids) +8.562%. The Population Standard Deviation was +17.779%.
The NATIONAL average for POTUS elections (using 1992 as my baseline) & Gubernatorial elections (also using 1992 as my baseline or 1994 for midterms) for POTUS years & midterms (this is 21 data points) = +6.811%. The Population Standard Deviation was +11.164%.
Raw voter turnout increased in the states that engaged in “voter suppression, although the swings (large decrease, followed by mammoth increase) were wilder than national data en masse.
I could go further (If State A has raw vote increases that were below national averages prior to Voter ID & after Voter ID, that does not mean Voter ID is suppressing turnout), but I think this demonstrates that the states that cranked down (and where I had 3 elections prior to & after Voter ID) on potential voter fraud had raw vote increases larger than the national data en masse.
This data is NOT perfect, but it is a good chink in the armor of bi-polaroids like the divorcee Sam Seder & his underemployed autistics who screech “voter suppression” whenever a Democrat loses an election.
POTUS, Gubernatorial elections POTUS years & Midterm Gubernatorial elections
-7.805
9.504
16.009
7.498
-1.7008
6.117
15.6385
-4.76
9.8
15.1
9.72
0.009
17.187
4.411
-3.599
7.806
6.471
5.613
-8.485
42.988
-4.471
Data for GA, IN, OH, KS & TN
21.255
-0.9904
54.996
0.3553
18.995
-0.6049
6.103
20.573
10.42
-4.54
5.38
11.045
11.7
-4.48
4.83
10.12
24.583
-4.233
-20.676
45.155
-6.7842
1.67
-2.287
-0.973
7.15
3.66
21.299
-5.705
-6.57
3.46
15.02
15.47
65.71
-22.55
-5.42
1.92
21.752
Let us add a few Democrat-leaning states for the bi-polaroid Sam Seder who has an affinity for Roman Polanski & see how they fared in vote increase/decreases.
California
CA 1994 Gubernatorial election, total raw votes = 8,665,375
CA 1998 Gubernatorial election, total raw votes = 8,381,871 [-3.2717%]
CA 2002 Gubernatorial election, total raw votes = 7,474,030 [-10.831%] *Massive Declines in votes for 2 straight election cycles, Sam Seder’s bi-polar rage will be percolating over that “voter suppression” in the Golden State*
CA 2006 Gubernatorial election, total raw votes = 8,679,416 [+16.1275%]
CA 2010 Gubernatorial election, total raw votes = 10,095,485 [+16.315%]
CA 2014 Gubernatorial election, total raw votes = 7,317,581 [-27.516%]
CA 2018 Gubernatorial election, total raw votes = 12,464,235 [+70.333%]
CA 2022 Gubernatorial election, total raw votes = 10,933,009 [-12.2848%]
CA 1992 POTUS election, total raw votes = 11,131,721
CA 1996 POTUS election, total raw votes = 10,019,484 [-9.992%]
CA 2000 POTUS election, total raw votes = 10,965,856 [+9.445%]
CA 2004 POTUS election, total raw votes = 12,421,859 [+13.277%]
CA 2008 POTUS election, total raw votes = 13,583,083 [+9.349%]
CA 2012 POTUS election, total raw votes = 13,055,815 [-3.882%]
CA 2016 POTUS election, total raw votes = 14,243,449 [+9.097%]
CA 2020 POTUS election, total raw votes = 17,512,265 [+22.95%]
CA average increase/decrease in raw votes POTUS election cycles = +7.177%
CA average increase/decrease in raw votes Gubernatorial election cycles = +6.981%
***
Illinois
1994 IL Gubernatorial election, total raw votes = 3,106,566
1998 Gubernatorial election, total raw votes = 3,358,657 [+8.115%]
2002 Gubernatorial election, total raw votes = 3,538,891 [+5.361%]
2006 Gubernatorial election, total raw votes = 3,487,989 [-1.44%]
2010 Gubernatorial election, total raw votes = 3,729,987 [+6.934%]
2014 Gubernatorial election, total raw votes = 3,627,690 [-2.741%]
2018 Gubernatorial election, total raw votes = 4,559,563 [+25.69%]
2022 Gubernatorial election, total raw votes = 4,107,075 [-9.924%]
1992 IL POTUS election, total raw votes = 5,050,157
1996 POTUS election, total raw votes = 4,311,391 [-14.628%]
2000 POTUS election, total raw votes = 4,742,123 [+9.99%]
2004 POTUS election, total raw votes = 5,274,322 [+11.224%]
2008 POTUS election, total raw votes = 5,530,179 [+4.85%]
2012 POTUS election, total raw votes = 5,251,432 [-5.04%]
2016 POTUS election, total raw votes = 5,595,279 [+6.548%]
2020 POTUS election, total raw votes = 6,049,500 [+8.119%]
Illinois average increase/decrease in raw votes POTUS election cycles = +3.009%
Illinois average increase/decrease in raw votes Gubernatorial election cycles = +4.570%
***
New York
1994 NY Gubernatorial, total votes cast = 5,203,764
1998 Gubernatorial, total votes cast = 4,735,236 [-9.004%]
2002 Gubernatorial, total votes cast = 4,579,078 [-3.298%]
2006 Gubernatorial, total votes cast = 4,437,220 [-3.097%]
2010 Gubernatorial, total votes cast = 4,657,955 [+4.975%]
2014 Gubernatorial, total votes cast = 3,819,086 [-18.01%] *lower voter participation in 2014 than in 1998 or 1994! Must be voter suppression in the Empire State*
2018 Gubernatorial, total votes cast = 6,104,477 [+59.84%]
2022 Gubernatorial, total votes cast = 5,912,286 [-3.1482%]
1992 NY POTUS election, total votes cast = 6,926,925
1996 POTUS election, total votes cast = 6,316,129 [-8.818%]
2000 POTUS election, total votes cast = 6,831,178 [+8.155%]
2004 POTUS election, total votes cast = 7,391,954 [+8.21%]
2008 POTUS election, total votes cast = 7,640,948 [+3.369%]
2012 POTUS election, total votes cast = 7,081,536 [-7.321%]
2016 POTUS election, total votes cast = 7,721,795 [+9.04%]
2020 POTUS election, total votes cast = 8,632,255 [+11.791%]
NY average increase/decrease in raw votes POTUS election cycles = +3.489%
New York average increase/decrease in raw votes Gubernatorial election cycles = +4.036%
***
If I now average out ALL the data from CA, NY & IL we have the following average decrease/increase in all POTUS & Gubernatorial (no special elections were allowed) elections = +4.877% & The Population Standard Deviation = +17.343%
-9.992
9.445
13.277
9.349
-3.882
9.097
22.95
-3.2717
-10.831
16.1275
16.315
-27.516
70.333
-12.2848
-14.628
9.99
11.224
4.85
-5.04
6.548
8.119
8.115
5.361
-1.44
6.934
-2.741
25.69
-9.924
-8.818
8.155
8.21
3.369
-7.321
9.04
11.791
-9.004
-3.298
-3.097
4.975
-18.01
59.84
-3.1482
The Standard Deviation was close to the election average in the states that engaged in Voter ID/Photo ID/voter suppression, but their average/increase in raw votes was much lower than the national average & was lower than the states w/ tighter Voter ID laws – was that VOTER SUPPRESSION?
In states that either do next-to-nothing to stop voter fraud (CA, NY, IL) or the states that cranked down on it (GA, IN, OH, KS & TN), their increases/decreases in raw votes swung wildly both ways, much more than the national average en masse.
In conclusion, if you see a mentally ill, divorced, functionally retarded mouth breather screeching about “voter suppression” the data above indicates that is not true.
I could give them all the raw data points & not tell them which batch was which (Voter ID states vs. CA, NY, or IL vs. national data) & they would not have a clue, or they would probably guess wrong.
It reminds me of Tom Woods’ COVID-19 chart challenge https://www.covidchartsquiz.com/ where he shows graphs of states that had mask mandates & lockdowns vs. states that did not & he asks you to guess which ones are which & often the states w/ lower case rates per 100,000 did not have lockdowns.
They can’t do it, they have to Monday Morning Quarterback it, they’re a “teach the test” person who can autistically-repeat talking points but once you get them off that they’re like a blind man in a dark room, flailing away like a madman.
There is no truth to this “voter suppression” talking point (aside from creating a narrative) that divorced losers like Sam Seder repeat constantly because they don’t spend any time w/ their now ex-wife & kids, but they do spend a lot of time on social media.
Mr. Chairman, I Yield Back!
***
The mentally ill divorcee Sam Seder has already conceded to me -- he concurs that the most violent counties in America have lots of black on black homicide & they overwhelmingly vote Democrat. http://freewebs.com/professor_enigma/covid-increase-homicides
Sam Seder is afraid to debate my friend James Patrick Holding on The Impossible Faith. https://tektonics.org/lp/nowayjose.php Methinks Stan Seder has no confidence in that religion degree from a diploma mill #samsederwontdebateJPH
590
views
1
comment

Senator Rand Paul raises the alarm on our coming fiscal calamity
Senate votes to “Waive All Applicable Budgetary Discipline”
[X] indicates vote to waive was successful. Under the vote I will include the # of Republicans (e.g. 23 of 50 R) & Democrats (e.g. 33 of 50 D) that voted to “Waive All Applicable Budgetary Discipline”.
117th Congress - 2nd Session (2022)
https://www.senate.gov/legislative/LIS/roll_call_votes/vote1172/vote_117_2_00408.htm [X]
16 of 50 R – 49 of 50 D
https://www.senate.gov/legislative/LIS/roll_call_votes/vote1172/vote_117_2_00314.htm
7 of 50 R – 50 of 50 D
https://www.senate.gov/legislative/LIS/roll_call_votes/vote1172/vote_117_2_00311.htm
50 of 50 R – 4 of 50 D
https://www.senate.gov/legislative/LIS/roll_call_votes/vote1172/vote_117_2_00310.htm
1 of 50 R – 4 of 50 D
https://www.senate.gov/legislative/LIS/roll_call_votes/vote1172/vote_117_2_00300.htm
49 of 50 R – 0 of 50 D
https://www.senate.gov/legislative/LIS/roll_call_votes/vote1172/vote_117_2_00290.htm
50 of 50 R- 5 of 50 D
https://www.senate.gov/legislative/LIS/roll_call_votes/vote1172/vote_117_2_00288.htm
0 of 50 R – 1 of 50 D
https://www.senate.gov/legislative/LIS/roll_call_votes/vote1172/vote_117_2_00270.htm [X]
17 of 50 R – 47 of 50 D
117th Congress - 1st Session (2021)
https://www.senate.gov/legislative/LIS/roll_call_votes/vote1171/vote_117_1_00311.htm [X]
14 of 50 R – 50 of 50 D
https://www.senate.gov/legislative/LIS/roll_call_votes/vote1171/vote_117_1_00286.htm [X]
22 of 50 R – 50 of 50 D
https://www.senate.gov/legislative/LIS/roll_call_votes/vote1171/vote_117_1_00224.htm [X]
23 of 50 R – 49 of 50 D
https://www.senate.gov/legislative/LIS/roll_call_votes/vote1171/vote_117_1_00139.htm [X]
14 of 50 R – 50 of 50 D
https://www.senate.gov/legislative/LIS/roll_call_votes/vote1171/vote_117_1_00097.htm
48 of 50 R – 1 of 50 D (should biological men be competing w/ biological women in sports?)
https://www.senate.gov/legislative/LIS/roll_call_votes/vote1171/vote_117_1_00094.htm
49 of 50 R - 3 of 50 D
https://www.senate.gov/legislative/LIS/roll_call_votes/vote1171/vote_117_1_00083.htm
49 of 50 R - 2 of 50 D
https://www.senate.gov/legislative/LIS/roll_call_votes/vote1171/vote_117_1_00077.htm
48 of 50 R – 0 of 50 D
https://www.senate.gov/legislative/LIS/roll_call_votes/vote1171/vote_117_1_00074.htm
0 of 50 R - 42 of 50 D
https://www.senate.gov/legislative/LIS/roll_call_votes/vote1171/vote_117_1_00050.htm
50 of 50 R - 1 of 50 D
https://www.senate.gov/legislative/LIS/roll_call_votes/vote1171/vote_117_1_00041.htm
40 of 50 R – 0 of 50 D (no more employment-based visas until the labor force reaches pre-plandemic levels)
https://www.senate.gov/legislative/LIS/roll_call_votes/vote1171/vote_117_1_00037.htm
50 of 50 R – 0 of 50 D
https://www.senate.gov/legislative/LIS/roll_call_votes/vote1171/vote_117_1_00036.htm
50 of 50 R – 0 of 50 D (contra stacking the SCOTUS)
https://www.senate.gov/legislative/LIS/roll_call_votes/vote1171/vote_117_1_00029.htm
49 of 50 R – 0 of 50 D
https://www.senate.gov/legislative/LIS/roll_call_votes/vote1171/vote_117_1_00025.htm
50 of 50 R – 2 of 50 D (To establish a deficit-neutral reserve fund relating to prioritizing taking into custody aliens charged with a crime resulting in death or serious bodily injury)
https://www.senate.gov/legislative/LIS/roll_call_votes/vote1171/vote_117_1_00024.htm
50 of 50 R – 0 of 50 D
https://www.senate.gov/legislative/LIS/roll_call_votes/vote1171/vote_117_1_00023.htm
50 of 50 R – 2 of 50 D (To establish a deficit-neutral reserve fund relating to improving health care to prohibit a health care practitioner from failing to exercise the proper degree of care in the case of a child who survives an abortion or attempted abortion)
25 attempts in the 117th Congress to “Waive All Budgetary Discipline”, flip the bird to actual taxpayers & 6 succeeded. Democrats want to end the filibuster because it is one of the reasons we are able to stop a lot of horrendous spending from becoming law. Sans the filibuster, it would be easier for public sector goons who never had a real job (e.g., Bernie Sanders) in the private sector to spend us into a financial apocalypse.
Democrats also want to end the Filibuster & neuter precedents like https://crsreports.congress.gov/product/pdf/RL/RL30862 https://www.heritage.org/budget-and-spending/report/consequential-decisions-reconciliation-and-the-byrd-rule The Byrd Rule https://www.conservapedia.com/Byrd_rule so they can use the reconciliation process to tack on garbage that is not germane (e.g. attaching a minimum wage hike or card check to a bill dedicated to education or defense spending) & do that with 50 votes. The overweight Kamala Harris or some troglodyte like her would cast the tie-breaking vote.
The filibuster & the roadblocks tied to it https://crsreports.congress.gov/product/pdf/RL/97-865 serve a purpose. Can you imagine how crazy these lunatics would get w/ your money if they could spindle & mutilate budgetary discipline & abuse the reconciliation process w/ 50 votes?
There’s a lot of really bad legislation that gets through, but some is stopped because folks like Rand Paul demand that spending on X have an offset. https://www.heritage.org/budget-and-spending/commentary/congress-guts-budget-rules-and-misses-chance-cut-spending This requires 60 votes & all too often there are 60 people in the Senate who are not thinking of your grandchildren when they vote “yea.”
Now, back to the game.
116th Congress - 2nd Session (2020)
https://www.senate.gov/legislative/LIS/roll_call_votes/vote1162/vote_116_2_00013.htm [X]
31 of 53 R – 47 of 47 D
https://www.senate.gov/legislative/LIS/roll_call_votes/vote1162/vote_116_2_00118.htm [X]
22 of 53 R – 46 of 47 D
116th Congress - 1st Session (2019)
https://www.senate.gov/legislative/LIS/roll_call_votes/vote1161/vote_116_1_00414.htm [X]
26 of 53 R – 38 of 47 D
https://www.senate.gov/legislative/LIS/roll_call_votes/vote1161/vote_116_1_00399.htm [X]
43 of 53 R – 39 of 47 D
https://www.senate.gov/legislative/LIS/roll_call_votes/vote1161/vote_116_1_00128.htm [X]
38 of 53 R – 46 of 47 D
5 for 5 in the 116th Congress
115th Congress - 2nd Session (2018)
https://www.senate.gov/legislative/LIS/roll_call_votes/vote1152/vote_115_2_00192.htm [X]
22 of 51 R – 46 of 49 D (this one was a budget buster deluxe)
https://www.senate.gov/legislative/LIS/roll_call_votes/vote1152/vote_115_2_00059.htm
0 of 51 R - 21 of 49 D
https://www.senate.gov/legislative/LIS/roll_call_votes/vote1152/vote_115_2_00053.htm [X]
50 of 51 R - 17 of 49 D
15th Congress - 1st Session (2017)
https://www.senate.gov/legislative/LIS/roll_call_votes/vote1151/vote_115_1_00324.htm [X]
43 of 52 R – 48 of 48 D
https://www.senate.gov/legislative/LIS/roll_call_votes/vote1151/vote_115_1_00322.htm
51 of 52 R – 0 of 48 D
https://www.senate.gov/legislative/LIS/roll_call_votes/vote1151/vote_115_1_00247.htm [X]
33 of 52 R – 48 of 48 D
https://www.senate.gov/legislative/LIS/roll_call_votes/vote1151/vote_115_1_00174.htm
50 of 52 R – 0 of 48 D
https://www.senate.gov/legislative/LIS/roll_call_votes/vote1151/vote_115_1_00172.htm
10 of 52 R – 0 of 48 D
https://www.senate.gov/legislative/LIS/roll_call_votes/vote1151/vote_115_1_00168.htm
43 of 52 R – 0 of 48 D
https://www.senate.gov/legislative/LIS/roll_call_votes/vote1151/vote_115_1_00024.htm
51 of 52 R – 1 of 48 D
https://www.senate.gov/legislative/LIS/roll_call_votes/vote1151/vote_115_1_00022.htm
51 of 52 R – 1 of 48 D
https://www.senate.gov/legislative/LIS/roll_call_votes/vote1151/vote_115_1_00019.htm
49 of 52 R – 0 of 48 D
https://www.senate.gov/legislative/LIS/roll_call_votes/vote1151/vote_115_1_00018.htm
1 of 52 R – 47 of 48 D
https://www.senate.gov/legislative/LIS/roll_call_votes/vote1151/vote_115_1_00017.htm
51 of 52 R – 0 of 48 D
https://www.senate.gov/legislative/LIS/roll_call_votes/vote1151/vote_115_1_00016.htm
47 of 52 R – 0 of 48 D
https://www.senate.gov/legislative/LIS/roll_call_votes/vote1151/vote_115_1_00013.htm
50 of 52 R – 0 of 48 D
https://www.senate.gov/legislative/LIS/roll_call_votes/vote1151/vote_115_1_00011.htm
51 of 52 R – 0 of 48 D
https://www.senate.gov/legislative/LIS/roll_call_votes/vote1151/vote_115_1_00009.htm
51 of 52 R – 0 of 48 D
https://www.senate.gov/legislative/LIS/roll_call_votes/vote1151/vote_115_1_00008.htm
1 of 52 R – 47 of 48 D
https://www.senate.gov/legislative/LIS/roll_call_votes/vote1151/vote_115_1_00007.htm
0 of 52 R - 47 of 48 D
https://www.senate.gov/legislative/LIS/roll_call_votes/vote1151/vote_115_1_00006.htm
1 of 52 R – 48 of 48 D
https://www.senate.gov/legislative/LIS/roll_call_votes/vote1151/vote_115_1_00005.htm
31 of 52 R – 0 of 48 D
4 for 22 in the 115th Congress
***
114th Congress - 2nd Session (2016)
https://www.senate.gov/legislative/LIS/roll_call_votes/vote1142/vote_114_2_00139.htm [X]
40 of 54 R – 45 of 46 D
https://www.senate.gov/legislative/LIS/roll_call_votes/vote1142/vote_114_2_00115.htm [X]
53 of 54 R – 32 of 46 D
https://www.senate.gov/legislative/LIS/roll_call_votes/vote1142/vote_114_2_00079.htm [X]
40 of 54 R – 44 of 46 D
https://www.senate.gov/legislative/LIS/roll_call_votes/vote1142/vote_114_2_00076.htm [X]
25 of 54 R – 45 of 46 D
https://www.senate.gov/legislative/LIS/roll_call_votes/vote1142/vote_114_2_00053.htm
33 of 54 R – 0 of 46 D
https://www.senate.gov/legislative/LIS/roll_call_votes/vote1142/vote_114_2_00030.htm
5 of 54 R – 43 of 46 D
https://www.senate.gov/legislative/LIS/roll_call_votes/vote1142/vote_114_2_00029.htm
2 of 54 R – 44 of 46 D
114th Congress - 1st Session (2015)
https://www.senate.gov/legislative/LIS/roll_call_votes/vote1141/vote_114_1_00338.htm [X]
37 of 54 R – 36 of 46 D
https://www.senate.gov/legislative/LIS/roll_call_votes/vote1141/vote_114_1_00328.htm
1 of 54 R – 45 of 46 D
https://www.senate.gov/legislative/LIS/roll_call_votes/vote1141/vote_114_1_00327.htm
0 of 54 R - 45 of 46 D
https://www.senate.gov/legislative/LIS/roll_call_votes/vote1141/vote_114_1_00326.htm
52 of 54 R – 0 of 46 D
https://www.senate.gov/legislative/LIS/roll_call_votes/vote1141/vote_114_1_00322.htm
2 of 54 R – 45 of 46 D
https://www.senate.gov/legislative/LIS/roll_call_votes/vote1141/vote_114_1_00321.htm
4 of 54 R – 44 of 46 D
https://www.senate.gov/legislative/LIS/roll_call_votes/vote1141/vote_114_1_00320.htm
52 of 54 R – 1 of 46 D
https://www.senate.gov/legislative/LIS/roll_call_votes/vote1141/vote_114_1_00319.htm
1 of 54 R – 44 of 46 D
https://www.senate.gov/legislative/LIS/roll_call_votes/vote1141/vote_114_1_00318.htm
53 of 54 R – 2 of 46 D
https://www.senate.gov/legislative/LIS/roll_call_votes/vote1141/vote_114_1_00317.htm
2 of 54 R – 45 of 46 D
https://www.senate.gov/legislative/LIS/roll_call_votes/vote1141/vote_114_1_00315.htm
0 of 54 R - 46 of 46 D
https://www.senate.gov/legislative/LIS/roll_call_votes/vote1141/vote_114_1_00313.htm
0 of 54 R - 45 of 46 D
https://www.senate.gov/legislative/LIS/roll_call_votes/vote1141/vote_114_1_00293.htm [X]
18 of 54 R – 46 of 46 D
https://www.senate.gov/legislative/LIS/roll_call_votes/vote1141/vote_114_1_00276.htm [X]
50 of 54 R – 21 of 46 D
https://www.senate.gov/legislative/LIS/roll_call_votes/vote1141/vote_114_1_00142.htm
13 of 54 R – 45 of 46 D
https://www.senate.gov/legislative/LIS/roll_call_votes/vote1141/vote_114_1_00123.htm
5 of 54 R – 46 of 46 D
https://www.senate.gov/legislative/LIS/roll_call_votes/vote1141/vote_114_1_00097.htm
4 of 54 R – 0 of 46 D
(To increase new budget authority for fiscal years 2016 and 2017 and modify outlays for fiscal years 2016 through 2022 for National Defense (budget function 050) with offsets.) This was a huge vote & displayed how much pull the Military Industrial Crony Capitalist Public/Private Partnership Taxpayer-funded Trough has in Washington. I am not shocked the vote failed, but I am shocked at how few people were willing to vote along w/ Rand Paul.
https://www.senate.gov/legislative/LIS/roll_call_votes/vote1141/vote_114_1_00096.htm
31 of 54 R - 1 of 46 D
https://www.senate.gov/legislative/LIS/roll_call_votes/vote1141/vote_114_1_00090.htm
2 of 54 R – 44 of 45 D
https://www.senate.gov/legislative/LIS/roll_call_votes/vote1141/vote_114_1_00084.htm
6 of 54 R – 45 of 46 D
https://www.senate.gov/legislative/LIS/roll_call_votes/vote1141/vote_114_1_00143.htm [X]
25 of 54 R – 46 of 46 D
https://www.senate.gov/legislative/LIS/roll_call_votes/vote1141/vote_114_1_00140.htm
0 of 54 R - 43 of 46 D
https://www.senate.gov/legislative/LIS/roll_call_votes/vote1141/vote_114_1_00138.htm
4 of 54 R – 46 of 46 D
https://www.senate.gov/legislative/LIS/roll_call_votes/vote1141/vote_114_1_00129.htm
47 of 54 R – 2 of 46 D
8 of 31 in the 114th
***
113th Congress-1st session (2013)
https://www.senate.gov/legislative/LIS/roll_call_votes/vote1131/vote_113_1_00207.htm
14 of 46 R – 54 of 54 D
https://www.senate.gov/legislative/LIS/roll_call_votes/vote1131/vote_113_1_00162.htm
14 of 46 R – 54 of 54 D
113th Congress-2nd session (2014)
https://www.senate.gov/legislative/LIS/roll_call_votes/vote1132/vote_113_2_00253.htm [X]
34 of 45 R – 52 of 55 D
https://www.senate.gov/legislative/LIS/roll_call_votes/vote1132/vote_113_2_00252.htm
0 of 45 R – 50 of 55 D
https://www.senate.gov/legislative/LIS/roll_call_votes/vote1132/vote_113_2_00229.htm
44 of 45 R - 4 of 55 D
https://www.senate.gov/legislative/LIS/roll_call_votes/vote1132/vote_113_2_00186.htm [X]
22 of 45 R – 53 of 55 D
https://www.senate.gov/legislative/LIS/roll_call_votes/vote1132/vote_113_2_00099.htm [X]
5 of 45 R – 55 of 55 D
https://www.senate.gov/legislative/LIS/roll_call_votes/vote1132/vote_113_2_00092.htm [X]
10 of 45 R – 54 of 55 D
https://www.senate.gov/legislative/LIS/roll_call_votes/vote1132/vote_113_2_00046.htm
2 of 45 R – 54 of 55 D
https://www.senate.gov/legislative/LIS/roll_call_votes/vote1132/vote_113_2_00015.htm [X]
9 of 45 R – 55 of 55 D
5 of 10 in the 113th Congress
***
Of the 93 votes above to Waive All Budgetary Discipline from 2013-2022 (113th-117th Congress) 30.107% (28) of them were successful. Remember, these votes have a 3/5 threshold, so it always needed some votes from the opposition to be successful.
Of those 93 votes, Republicans voted “yea” 52.36% (2,504 of 4,782) of the time. If a Senator was absent from the vote, I assumed he/she was against it & did not bother voting.
In votes where the amendment to waive budgetary discipline was *SUCCESSFUL* the GOP voted “yea” (782 of 1,428) 54.76% of the time.
Of those 93 votes to Waive All Budgetary Discipline from 2013-2022 (113th-117th Congress), Democrats voted “yea” 55.789% (2,520 of 4,517) of the time.
In votes where the amendment to waive budgetary discipline was *SUCCESSFUL* the Dumbasscrats voted “yea” (1,254 of 1,372) 91.399% of the time. The Dummycrats stick together much better than the GOP & in votes where they are close to en masse support they pick off enough GOP squishes to make it happen.
I could also say the GOP could stop many of these votes, but not enough of them do so & they cross over, giving the Democrats victory. The reverse does not happen often.
We do not have enough Rand Paul or Mike Lees in the Senate to stop this madness. The GOP is like a football team that drives the ball down the field with ease, but they falter in the red zone & have to kick a lot of field goals.
The Communists however, are scoring a lot more touchdowns in the red zone.
Be careful when perusing this on the Senate website, you cannot always search for “waive all applicable budgetary discipline” because whomever puts this up does NOT always use the same verbiage. Ergo, that is why some of my votes are out-of-order, I always check my work several times & found this later (e.g., sometimes “Motion to Waive All Applicable Budget Points of Order” is used & it will muck up your research).
***
Let us do the 112th & 111th Congress too!
112th Congress-2nd session (2012)
https://www.senate.gov/legislative/LIS/roll_call_votes/vote1122/vote_112_2_00246.htm
5 of 47 R- 50 of 53 D
https://www.senate.gov/legislative/LIS/roll_call_votes/vote1122/vote_112_2_00238.htm
2 of 47 R – 49 of 53 D
https://www.senate.gov/legislative/LIS/roll_call_votes/vote1122/vote_112_2_00227.htm
2 of 47 R – 48 of 53 D
https://www.senate.gov/legislative/LIS/roll_call_votes/vote1122/vote_112_2_00204.htm
1 of 47 R – 49 of 53 D
https://www.senate.gov/legislative/LIS/roll_call_votes/vote1122/vote_112_2_00193.htm
5 of 47 R – 53 of 53 D
https://www.senate.gov/legislative/LIS/roll_call_votes/vote1122/vote_112_2_00171.htm [X]
13 of 47 R – 50 of 53 D
https://www.senate.gov/legislative/LIS/roll_call_votes/vote1122/vote_112_2_00069.htm [X]
9 of 47 R – 53 of 53 D
https://www.senate.gov/legislative/LIS/roll_call_votes/vote1122/vote_112_2_00047.htm
41 of 47 R - 1 of 53 D
https://www.senate.gov/legislative/LIS/roll_call_votes/vote1122/vote_112_2_00044.htm
40 of 47 R – 0 of 53 D (To lower the FY13 discretionary budget authority cap as set in the Balanced Budget and Emergency Deficit Control Act of 1985 by $11,000,000,000 in order to offset the general fund transfers to the Highway Trust Fund.) This was not even touching entitlements but was an offset to funds being shifted to highways. Apparently, Democrats are as attached to Discretionary funding as they are bankrupt entitlements
https://www.senate.gov/legislative/LIS/roll_call_votes/vote1122/vote_112_2_00035.htm [X]
14 of 47 R – 52 of 53 D
112th Congress-1st session (2011)
https://www.senate.gov/legislative/LIS/roll_call_votes/vote1121/vote_112_1_00110.htm [X]
18 of 47 R – 53 of 53 D
https://www.senate.gov/legislative/LIS/roll_call_votes/vote1121/vote_112_1_00009.htm
47 of 47 R – 0 of 53 D
https://www.senate.gov/legislative/LIS/roll_call_votes/vote1121/vote_112_1_00008.htm [X]
(To repeal the expansion of information reporting requirements for payments of $600 or more to corporations, and for other purposes.) I can see why Parkay Teeth Bernie Sanders voted “nay”, he’s never had a private sector job, so he does not understand what it’s like to be buried in red tape & paperwork
47 of 47 R - 34 of 53 D
5 of 13 in the 112th Congress
The GOP voted to waive budgetary discipline 39.93% (244 of 611) of the time on all votes & votes where the waiving of budgetary discipline was *SUCCESSFUL* they voted “yea” 42.97% (101 of 235) of the time.
The Dumocrat groomers voted to waive budgetary discipline 71.407% (492 of 689) of the time & on votes where the waiver was *SUCCESSFUL* they voted “yea” 91.32% (242 of 265) of the time.
***
111th Congress-2nd session (2010)
https://www.senate.gov/legislative/LIS/roll_call_votes/vote1112/vote_111_2_00225.htm [X]
2 of 41 R – 59 of 59 D
https://www.senate.gov/legislative/LIS/roll_call_votes/vote1112/vote_111_2_00207.htm [X]
3 of 41 R – 57 of 58 D
https://www.senate.gov/legislative/LIS/roll_call_votes/vote1112/vote_111_2_00193.htm
40 of 41 R – 1 of 59 D
https://www.senate.gov/legislative/LIS/roll_call_votes/vote1112/vote_111_2_00190.htm
0 of 41 R - 45 of 59 D
https://www.senate.gov/legislative/LIS/roll_call_votes/vote1112/vote_111_2_00181.htm
40 of 41 R - 17 of 59 D
https://www.senate.gov/legislative/LIS/roll_call_votes/vote1112/vote_111_2_00179.htm
0 of 41 R - 57 of 59 D
https://www.senate.gov/legislative/LIS/roll_call_votes/vote1112/vote_111_2_00165.htm
39 of 41 R – 12 of 59 D
https://www.senate.gov/legislative/LIS/roll_call_votes/vote1112/vote_111_2_00161.htm [X]
3 of 41 R – 57 of 59 D
https://www.senate.gov/legislative/LIS/roll_call_votes/vote1112/vote_111_2_00151.htm
40 of 41 R - 7 of 59 D
https://www.senate.gov/legislative/LIS/roll_call_votes/vote1112/vote_111_2_00112.htm [X]
1 of 41 R - 59 of 59 D
https://www.senate.gov/legislative/LIS/roll_call_votes/vote1112/vote_111_2_00110.htm
1 of 41 R - 57 of 59 D
https://www.senate.gov/legislative/LIS/roll_call_votes/vote1112/vote_111_2_00102.htm
40 of 41 R - 2 of 59 D
https://www.senate.gov/legislative/LIS/roll_call_votes/vote1112/vote_111_2_00099.htm
39 of 41 R – 0 of 59 D
https://www.senate.gov/legislative/LIS/roll_call_votes/vote1112/vote_111_2_00094.htm
40 of 41 R – 5 of 59 D
https://www.senate.gov/legislative/LIS/roll_call_votes/vote1112/vote_111_2_00093.htm
40 of 41 R – 0 of 59 D
https://www.senate.gov/legislative/LIS/roll_call_votes/vote1112/vote_111_2_00091.htm
37 of 41 R - 3 of 59 D
https://www.senate.gov/legislative/LIS/roll_call_votes/vote1112/vote_111_2_00089.htm
36 of 41 R – 0 of 59 D
https://www.senate.gov/legislative/LIS/roll_call_votes/vote1112/vote_111_2_00088.htm
39 of 41 R – 1 of 59 D
https://www.senate.gov/legislative/LIS/roll_call_votes/vote1112/vote_111_2_00085.htm
39 of 41 R - 3 of 59 D
https://www.senate.gov/legislative/LIS/roll_call_votes/vote1112/vote_111_2_00082.htm
40 of 41 R - 2 of 59 D
https://www.senate.gov/legislative/LIS/roll_call_votes/vote1112/vote_111_2_00077.htm
40 of 41 R - 3 of 59 D
https://www.senate.gov/legislative/LIS/roll_call_votes/vote1112/vote_111_2_00071.htm
40 of 41 R – 0 of 59 D (To enroll Members of Congress in the Medicaid program) I guess no Democrats wanted to take the health care program that they want all their perpetually-unemployed voters to have
https://www.senate.gov/legislative/LIS/roll_call_votes/vote1112/vote_111_2_00059.htm
39 of 41 R – 2 of 59 D
https://www.senate.gov/legislative/LIS/roll_call_votes/vote1112/vote_111_2_00058.htm
0 of 41 R - 27 of 59 D
https://www.senate.gov/legislative/LIS/roll_call_votes/vote1112/vote_111_2_00057.htm
40 of 41 R - 16 of 59 D
https://www.senate.gov/legislative/LIS/roll_call_votes/vote1112/vote_111_2_00054.htm [X]
6 of 41 R – 57 of 59 D
https://www.senate.gov/legislative/LIS/roll_call_votes/vote1112/vote_111_2_00052.htm
36 of 41 R - 5 of 59 D
https://www.senate.gov/legislative/LIS/roll_call_votes/vote1112/vote_111_2_00042.htm
41 of 41 R - 18 of 59 D
https://www.senate.gov/legislative/LIS/roll_call_votes/vote1112/vote_111_2_00041.htm
22 of 41 R – 0 of 59 D
111th Congress-1st session (2009)
https://www.senate.gov/legislative/LIS/roll_call_votes/vote1111/vote_111_1_00383.htm [X]
4 of 40 R – 59 of 60 D (this one was a budget buster deluxe, but hey, we have the money!)
https://www.senate.gov/legislative/LIS/roll_call_votes/vote1111/vote_111_1_00339.htm
24 of 40 R – 8 of 60 D
https://www.senate.gov/legislative/LIS/roll_call_votes/vote1111/vote_111_1_00337.htm
37 of 40 R - 5 of 60 D
https://www.senate.gov/legislative/LIS/roll_call_votes/vote1111/vote_111_1_00303.htm
16 of 40 R - 18 of 60 D
https://www.senate.gov/legislative/LIS/roll_call_votes/vote1111/vote_111_1_00301.htm [X]
1 of 40 R - 60 of 60 D
https://www.senate.gov/legislative/LIS/roll_call_votes/vote1111/vote_111_1_00269.htm [X]
5 of 40 R- 55 of 60 D
https://www.senate.gov/legislative/LIS/roll_call_votes/vote1111/vote_111_1_00268.htm
39 of 40 R – 8 of 60 D
https://www.senate.gov/legislative/LIS/roll_call_votes/vote1111/vote_111_1_00266.htm
37 of 40 R- 4 of 60 D
https://www.senate.gov/legislative/LIS/roll_call_votes/vote1111/vote_111_1_00265.htm
39 of 40 R – 7 of 60 D
https://www.senate.gov/legislative/LIS/roll_call_votes/vote1111/vote_111_1_00260.htm [X]
4 of 40 R – 56 of 60 D
https://www.senate.gov/legislative/LIS/roll_call_votes/vote1111/vote_111_1_00253.htm [X]
15 of 40 R – 56 of 60 D
https://www.senate.gov/legislative/LIS/roll_call_votes/vote1111/vote_111_1_00251.htm
22 of 40 R – 12 of 60 D
https://www.senate.gov/legislative/LIS/roll_call_votes/vote1111/vote_111_1_00244.htm
37 of 40 R – 1 of 60 D
https://www.senate.gov/legislative/LIS/roll_call_votes/vote1111/vote_111_1_00209.htm [X]
4 of 40 R – 56 of 59 D
https://www.senate.gov/legislative/LIS/roll_call_votes/vote1111/vote_111_1_00192.htm
40 of 40 R - 19 of 59 D (To enhance public knowledge regarding the national debt by requiring the publication of the facts about the national debt on IRS instructions, Federal websites, and in new legislation.)
https://www.senate.gov/legislative/LIS/roll_call_votes/vote1111/vote_111_1_00191.htm
1 of 40 R – 32 of 59 D
https://www.senate.gov/legislative/LIS/roll_call_votes/vote1111/vote_111_1_00183.htm
39 of 40 R - 11 of 59 D
https://www.senate.gov/legislative/LIS/roll_call_votes/vote1111/vote_111_1_00150.htm
34 of 41 R - 2 of 58 D (To provide for a point of order against any appropriations bill that fails fully fund the construction of the Southwest border fence.) Democrats had begun their “let us make it as easy as possible for illegal immigration to occur” metamorphosis
https://www.senate.gov/legislative/LIS/roll_call_votes/vote1111/vote_111_1_00149.htm
24 of 41 R - 4 of 58 D
https://www.senate.gov/legislative/LIS/roll_call_votes/vote1111/vote_111_1_00145.htm [X]
40 of 41 R – 23 of 58 D
https://www.senate.gov/legislative/LIS/roll_call_votes/vote1111/vote_111_1_00144.htm
41 of 41 R - 5 of 58 D
https://www.senate.gov/legislative/LIS/roll_call_votes/vote1111/vote_111_1_00125.htm
0 of 41 R - 42 of 58 D
https://www.senate.gov/legislative/LIS/roll_call_votes/vote1111/vote_111_1_00084.htm
26 of 41 R – 0 of 58 D
https://www.senate.gov/legislative/LIS/roll_call_votes/vote1111/vote_111_1_00063.htm [X]
3 of 41 R – 58 of 58 D (this one was a budget buster deluxe)
https://www.senate.gov/legislative/LIS/roll_call_votes/vote1111/vote_111_1_00060.htm [X]
3 of 41 R – 58 of 58 D (this one was also a budget buster)
https://www.senate.gov/legislative/LIS/roll_call_votes/vote1111/vote_111_1_00058.htm
35 of 41 R – 0 of 58 D
https://www.senate.gov/legislative/LIS/roll_call_votes/vote1111/vote_111_1_00055.htm [X]
23 of 41 R – 58 of 58 D
https://www.senate.gov/legislative/LIS/roll_call_votes/vote1111/vote_111_1_00049.htm
37 of 41 R – 0 of 58 D
https://www.senate.gov/legislative/LIS/roll_call_votes/vote1111/vote_111_1_00048.htm
35 of 41 R – 0 of 58 D
https://www.senate.gov/legislative/LIS/roll_call_votes/vote1111/vote_111_1_00045.htm
40 of 41 R – 0 of 58 D
https://www.senate.gov/legislative/LIS/roll_call_votes/vote1111/vote_111_1_00043.htm
37 of 41 R – 2 of 58 D
https://www.senate.gov/legislative/LIS/roll_call_votes/vote1111/vote_111_1_00042.htm
37 of 41 R – 0 of 58 D
https://www.senate.gov/legislative/LIS/roll_call_votes/vote1111/vote_111_1_00041.htm
37 of 41 R – 1 of 58 D
https://www.senate.gov/legislative/LIS/roll_call_votes/vote1111/vote_111_1_00040.htm
40 of 41 R - 4 of 58 D
https://www.senate.gov/legislative/LIS/roll_call_votes/vote1111/vote_111_1_00038.htm
36 of 41 R – 0 of 58 D
https://www.senate.gov/legislative/LIS/roll_call_votes/vote1111/vote_111_1_00036.htm
33 of 41 R - 9 of 58 D
https://www.senate.gov/legislative/LIS/roll_call_votes/vote1111/vote_111_1_00035.htm [X]
31 of 41 R – 40 of 58 D
https://www.senate.gov/legislative/LIS/roll_call_votes/vote1111/vote_111_1_00033.htm
2 of 41 R – 56 of 58 D
16 of 67 in the 111th Congress
Of those 67 votes to eschew budgetary discipline, GOP Senators voted (1,741 of 2,730)
“yea” 63.772% of the time. On votes where the waiver was *SUCCESSFUL* the GOP voted “yea” (148 of 650) 22.769% of the time.
Of those 67 votes to ignore budgetary discipline, Dumbasscrat Senators voted “yea” (1,401 of 3,944) 35.53% of the time. Pertaining to votes where the waiver was *SUCCESSFUL* Dummycrats voted “yea” (868 of 943) 92.046% of the time.
We can see from that, who is better at sticking together to ignore fiscal responsibility – it is no contest.
Adding the 112th & 111th Congress’ together, GOP Senators voted to ignore budgetary discipline (1,985 of 3,341) 59.413% of the time.
When waiver votes were *SUCCESSFUL* GOP Senators voted “yea” (249 of 885) 28.135% of the time.
Adding the 112th & 111th Congress’ together, Democrat Senators voted to ignore budgetary discipline (1,893 of 4,633) 40.859% of the time.
When waiver votes were *SUCCESSFUL* Democrat Senators voted “yea” (1,110 of 1,208) 91.887% of the time.
AGAIN, we can see who sticks together to avoid budgetary discipline & they stick together much better than the GOP does. Granted, those 2 Congress’ had sizeable Dumocrat majorities, but the story is always the same.
There are enough George Voinovich, Susan Collins (and yes, I would prefer Susan over Sara Gideon, but Collins is a squish) & Arlen Specter characters in the GOP that they convince a few of these squishes & are able to win some of these votes.
In the 111th & 112th there were 80 attempts to waive fiscal sanity (21 successful), whereas from the 113th-117th there were only 93 (28 successful). You can see when the Dums had bigger majorities, they went crazy & they were drunk w/ power trying to ram though (and sticking together when the minority had an amendment, some good, some bad) anything & everything.
This is why they must be stopped & I will again appeal to any voters living in MT, WV, AZ or OH. You will have GOP Senate primaries in the summer of 2024 – if there is a Rand Paul, Mike Lee or Thomas Massie type candidate running, you owe it to this country to get to your primary & support them. ALL THOSE RACES ARE WINNABLE! Do you want more Susan Collins’ in the Senate or more Rand Paul’s? Do you want more George Voinovich & Mitt Romney or more Mike Lee?
If you are in UT, do everything to make sure next year is Mitt Romney’s last full year in the Senate. Capiche?
It was Democrat dark money (that they abhor of course) that was funding these fly-by-night websites (the Fix the Senate site has not been updated for 8 months, likely another offshoot will pop up & then go up in smoke) demanding that the filibuster be ended. It was not grassroots, it is AstroTurf. https://www.influencewatch.org/non-profit/sixteen-thirty-fund/ https://www.theepochtimes.com/big-left-wing-dark-money-groups-fund-schumers-secretive-anti-filibuster-ally_4192441.html https://www.theepochtimes.com/preeminent-washington-network-raised-over-1-5-billion-in-dark-money-for-funding-liberal-causes_4866732.html
***Fix Our Senate, the obscure outfit leading a coalition of 70 liberal advocacy groups backing Senate Majority Leader Chuck Schumer’s (D-N.Y.) anti-filibuster drive, is a left-wing “dark-money pop-up,” according to a political nonprofit finance expert.
“Fix Our Senate may present itself as a standalone, grassroots activist group, but it’s actually a front for the Sixteen Thirty Fund, itself part of a $1.7 billion left-wing ‘dark- money pop-up’ empire run by the shadowy consulting firm Arabella Advisors,” said Capital Research Center (CRC) senior investigative researcher Hayden Ludwig.
“We call these fronts ‘pop-ups’ because they’re websites which pop into existence, run attack campaigns, and disappear in an instant and almost never reveal their connection to Arabella or its nonprofits,” Ludwig told The Epoch Times on Jan. 4. [NOTE: This likely explains their site being in limbo for 8 months now]…
Schumer promised earlier this week to seek a vote by Jan. 17 on abolishing or reforming the filibuster—the Senate’s “cloture” rule that requires 60 votes to end debate and vote on a proposal—if Senate Republicans block consideration of two election reform packages that are top priorities of the Democrats’ progressive, or far-left, faction.
Republicans argue the reforms—the John R. Lewis Voting Rights Advancement Act and the Freedom to Vote Act—severely limit or eliminate entirely the use of photo IDs and related ballot security measures, and require that all proposed changes to state election laws have prior Department of Justice (DOJ) approval.
Measures such as strengthening voter identification requirements are highly popular with the public, with recent surveys by Rasmussen, Monmouth, Pew, and AP-NORC finding 72 to 80 percent support for requiring photo IDs to vote.
Fix Our Senate describes itself as a “coalition of more than 70 organizations (and counting) representing millions of Americans fighting to eliminate the filibuster and fix the Senate so our elected officials can finally start delivering on their promises.”
While no individuals are identified as officials on Fix Our Senate’s website, Eli Zupnick is identified by The Hill as a “spokesman.” He’s cited as praising Schumer for making “the choice clear: Senate Democrats must now choose between protecting our democracy or stubbornly preserving an outdated and abused Senate rule.”
The Epoch Times received no response to its questions submitted through the “Press Inquiries” contact form on the Fix Our Senate website by press time. Zupnick, who identifies himself with Fix Our Senate on his Twitter profile page, didn’t respond to multiple requests for comment.
He’s the former longtime communications director for Sen. Patty Murray (D-Wash.), working for her in various positions from 2009 until 2019. He also was briefly in 2019 the managing principal for Precision Strategies, a Washington and New York City political consulting and marketing firm co-founded by Stephanie Cutter, who identifies herself as the former deputy campaign manager for President Barack Obama’s 2012 reelection campaign.
Among the 70 organizations participating in the Fix Our Senate coalition are the American Muslim Civil Rights Center, Citizens for Responsibility and Ethics in Washington (CREW), Equal Justice Society, Faith in Public Life, Friends of the Earth, League of Conservation Voters, Peoples’ Action, Right to Health Action, and United We Dream. Many of the participating groups are locally focused activists groups such as the Long Beach Alliance for Clean Energy and Mid-Ohio Valley Climate Action.
Many of the coalition members, whether nationally or locally focused, share one thing in common—significant funding from the Sixteen Thirty/Arabella Fund dark money network, according to Ludwig.
“Because Fix Our Senate and other ‘pop-ups’ aren’t real nonprofits, they don’t file IRS Form 990 disclosures or publicly report their budgets, boards, or lobbying–making it impossible to trace their donors,” Ludwig explained. “Instead, all that money moves through the Sixteen Thirty Fund, itself created and managed by the for-profit company Arabella Advisors as a way for liberal mega-donors to quietly fund many of the Left’s most extreme causes.”
Ludwig said CRC has “traced about $10 million flowing from Arabella’s network funded by anonymous liberal donors to signatories on Fix Our Senate’s anti-filibuster coalition.”***
And:
***Washington-based consulting firm Arabella Advisors reportedly raised and spent billions in dark money last year to fund left-wing endeavors.
In U.S. politics, dark money refers to anonymous donations aimed at influencing elections. In addition to raising $1.5 billion, Arabella also spent $1 billion to support its causes in 2021, according to a Fox News report that cited tax documents.
In an interview with the media outlet, Caitlin Sutherland, the executive director of Americans for Public Trust, pointed to tax returns as proof that Arabella is the “largest dark money player” in U.S. politics.
“This network has established itself as the preeminent hub on the left to finance efforts to defund the police, pack the Supreme Court, enforce radical green energy policies, and prop up the Biden administration’s failing agenda,” Sutherland said.
Arabella is set up as a limited liability company (LLC), meaning that it is privately owned and thus does not come under the purview of disclosure laws that are applicable to political advocacy groups and nonprofits.
As such, billionaires, for example, can easily flood money into Arabella, which the organization can then channel to other funds without the public ever knowing the individuals who are financially backing the entity or the agenda.
Arabella manages five nonprofits, which, in turn, have connections with numerous other groups. The New Venture Fund is the largest of the nonprofits, collecting $955 million last year and spending $553 million. [NOTE: Remember that the next time Democrats whine about “dark money”]
Earlier this year, Senate Majority Leader Chuck Schumer (D-N.Y.) pushed forward a campaign to abolish or reform the filibuster, which is the Senate’s “cloture” rule that requires 60 votes to end a debate.
The move to end the filibuster was supported by an outfit called Fix Our Senate. In an interview with The Epoch Times, Hayden Ludwig, a senior investigative researcher at the Capital Research Center, pointed out that even though Fix Our Senate presents itself as a standalone organization, it is actually a “front for the Sixteen Thirty Fund.”
Governing for Impact, a group that works behind the scenes to shape policy in the Biden administration, has connections with Arabella. Financier George Soros is said to have contributed millions to the outfit.
Campaign for Our Shared Future, a group that acted against those who opposed teaching critical race theory in schools, also carries ties with Arabella.
Marc Elias, a top Democrat attorney, who had earlier pushed the “Russia collusion” hoax and previously served as Hillary Clinton’s campaign lawyer, registered Democracy Docket LLC in July 2020 to advocate for liberal election causes.
Elias then formed the Democracy Docket Legal Fund, a fiscally sponsored project of the nonprofit Hopewell Fund that comes under Arabella.***
Fix our Senate & the autistics behind it characterize the filibuster as a relic of Jim Crow & if by Jim Crow you mean Woodrow Wilson, then perhaps (see my section on the “Filibuster” here http://freewebs.com/professor_enigma/bernie-sanders & https://www.youtube.com/watch?v=S9u2U4r4A4s where I demolished a drug addict on YouTube named “Old Fart Rants” on his felonious, foolish, Senate filibuster follies. The old man needs a civics course & then a history class) it is racist. If by “the filibuster is a construct of the modern Senate” they mean “1837”, https://www.realclearpolitics.com/articles/2021/06/07/lets_get_our_filibuster_history_right_145882.html then yes -- the Senate filibuster is a “modern” construct.
If the filibuster not being ensconced in the Constitution or not part of the very first convening of the Senate in 1789 is a problem then I could point out that popular election of Senators was not part of the original Founding as well, but I doubt they would want to go back to State Legislatures appointing Senators as it is tougher for their dark money to have an impact in that scenario.
Was the “previous question” motion a part of the first Senate meeting or first convening of the House? Why did the Senate scuttle it & the House not? A lot of the objections from the fascist, anti-filibuster crown are very adolescent.
How about a simple majority of override a POTUS veto? Fix The Senate & their George Soros allies autistically-repeat the word “Democracy” & then in the next breath whine that the Senate itself is constructed to allow gridlock to flourish. Uh, yeah!
If the Founders (and I raised A LOT of these points in my essay on “Parkay Teeth” Bernie Sanders, no need to fill the amendment tree here) intended on us being a “Democracy” they would not have given each state 2 Senators, period. IT’S NOT A DEMOCRACY dummy! The Electoral College is not “Democracy” & neither is the House & Senate arrangements to choose the POTUS & VP in the even nobody gets a majority (and that’s MAJORITY, NOT PLURALITY) of Electoral Votes.
The Founders gave each state 2 Senators (and the ability to define & reform their own rules – which spawned the filibusters like it or not & it has stuck around, like it or not because most Senators like them – until they don’t like them & want to ram Republic-burning legislation down our throats w/ 51 votes out of 101) because they believed that the smaller states would stick together when the bigger states tried to bully them.
That’s why they did not explicitly give the Senate a filibuster in our founding documents & it has nothing to do w/ racism or Jim Crow & it wasn’t a mistake (unless you’re an idiot who reads book w/ coloring areas in them or a liar).
And that concludes my rambling essay on Senate votes to waive budgetary discipline & why Democrats want to end the filibuster. They want to make it easy (remember, one of the reasons the Byrd Rule was constructed was to prevent a group of Senators from attaching say offshore drilling in the Chukchi Sea to a bill designed to fill potholes on the Interstate because it was not germane) for 50.5% (that’s our overweight VP voting w/ 50 Dumocrats) of that elected body to engage in utter insanity.
Although the filibuster has failed to prevent a lot of fiscal ineptitude, should it be scuttled it will allow even more (if you can believe that) fiscal insanity that will crush your grandchildren like a grape under a steamroller.
Reject these nutcases at the ballot box in 2024!
***
https://www.congress.gov/bill/110th-congress/senate-concurrent-resolution/21/text
***
Further information that you need to read & then probably take a bath
Bernie Sanders WAS worried about the national debt
https://www.c-span.org/video/?15245-1/102nd-congress-preview
https://freebeacon.com/politics/twenty-six-years-ago-bernie-sanders-criticized-national-debt-of-3-trillion/
https://web.archive.org/web/20151003044743/https://www.youtube.com/watch?v=UmY0-AjnLbg
Since the waning days of the George W. Bush regime, “Parkay Teeth” Bernie Sanders has voted to add almost $11 trillion in spending to our federal budget. https://archive.ph/uTsGf Wonder why inflation is becoming a regular problem? This is their plan to rupture the middle class & upper middle class.
Compare that to Rand Paul & Mike Lee (both were not seated until the 112th Congress), who are voting the other way, they don’t want a financial catastrophe to bring down the Republic, which Biden & his cronies (as well as several Republicans) are hell-bent on achieving.
If you are a voter in MT, WV, AZ or OH during the 20214 Senate primaries & there is a Rand Paul or Mike Lee type candidate on the ballot, get involved in that primary & help them defeat anyone that Mitch McConnell endorses. Mitt Romney needs to be primaried out of the Senate as well.
We need more Rand Paul https://archive.ph/J5PqO & Mike Lee https://archive.vn/Bhy0b in the Senate, less Mitch McConnnell & Lisa Murkowski. Capiche? We also need more Thomas Massie https://archive.vn/VD3pS (was not seated until Nov. 2012) as well.
https://drrichswier.com/2021/08/13/death-blow-heres-whats-inside-comrade-bernie-sanders-3-5-trillion-budget/ https://www.senate.gov/legislative/LIS/roll_call_votes/vote1171/vote_117_1_00357.htm https://www.congress.gov/bill/117th-congress/senate-coHilncurrent-resolution/14/text/enr
Parkay Teeth Bernie Sanders loves him some egregious defense spending, look at the allocations for the Pentagon in Bernie’s legislation. Bernie used to be an honest idiot, I respected him for that, now he has become a Swamp Creature, a Beltway Reptilian who loves to spend egregious amounts of money on virtually everything. He does not give a flying squirrel about the fiscal calamity that will befall your grandchildren because his fat butt will be in the ground.
If there are any unemployed Bernie supporters who say, “Those tax cuts were the reason we have deficits”, I suggest you see my Bernie Sanders Tax Hike Challenge, which knocks that out flat. https://rumble.com/v1mjo9w-tell-your-democrat-friends-take-the-bernie-sanders-tax-hike-challenge.html
Nancy Pelosi was worried about the national debt & the deficit at one time, but not any more https://www.youtube.com/watch?v=D7lxL90IRew
Senator Barack Hussein Obama was worried about our coming fiscal calamity, wanted to stop the debt ceiling from being raised https://redstate.com/diary/alanjoelny/2013/01/15/full-text-of-obamas-speech-against-raising-the-debt-ceiling-in-2006-n179786
Hillary Clinton called our national debt “a national security threat.”
https://www.foxnews.com/politics/clinton-national-debt-holding-america-back https://www.theatlantic.com/politics/archive/2016/10/hillary-clinton-national-debt-presidency/504905/ https://www.youtube.com/watch?v=nXd4PhfO3zU https://www.crfb.org/blogs/hillary-clinton-says-national-debt-real-national-security-threat
Hey Hillary Clinton, can we go back to the exact tax rates (personal income, corporate income, capital gains, etc.) that were in force when your husband left office, pare back spending levels to FY2019 & allow 1% federal spending growth UNTIL we shave at least $6 trillion off the national debt? Would you vote for that or not? http://freewebs.com/professor_enigma/sam-seder-aoc-tax-the-rich It’s not the tax rates, it’s the spending stupid!
Senator Harry Reid discovers the national debt is a problem, too bad he didn’t do that during his numerous decades in Congress https://lasvegastribune.net/2019/07/25/former-nevada-senator-discovers-national-debt/ https://www.youtube.com/watch?v=8e05lVXupwY https://www.huffpost.com/entry/harry-reid-debt-ceiling-mitch-mcconnell_n_561d6122e4b0c5a1ce60da4f https://www.congress.gov/congressional-record/volume-152/issue-34/senate-section/article/S2225-5 (read “Dingy” Harry Reid’s remarks on raising the debt ceiling)
The Chuck Schumer of today might want to take the advice of the Chuck Schumer from the George W. Bush Administration. https://www.congress.gov/congressional-record/volume-149/issue-43/senate-section/article/S3815-7 https://townhall.com/tipsheet/guybenson/2021/10/05/flashback-biden-schumer-opposed-raising-the-debt-ceiling-under-unified-gop-government-n2596922
***“Why do we have a Budget Act? Why do we have a budget resolution? It is to set priorities. If we didn't have to set priorities, we could have as many tax cuts as we wanted and as much spending as we wanted and as big a deficit as we wanted, and the country would be in chaos… I, for one, believe tax cuts are appropriate to stimulate the economy. The amendment wisely allows that… Then, if we do have a crowding out, do people prefer, say, Medicare or tax cuts? Do they prefer education or tax cuts? Do they prefer transportation money or tax cuts? That is what a
budget resolution is all about. [note: IF tax cuts stimulate the economy as you say, then why do you have to choose? He contradicted himself]… Last year we were all saying, accountants have to get a whole lot better. Any accountant in his first year of taking an accounting course in college would say: If you have a huge cost coming up--a cost we all support, the cost of the war--don't do other types of things, whether it be spending or cuts, before you know what that cost is.”***
Schumer actually sounds sensible here, as does former Senator Tom Daschle, https://www.congress.gov/congressional-record/volume-149/issue-43/senate-section/article/S3815-7 who called our “exploding federal deficit” a “debilitating debt” for future generations.
That was almost 2 decades ago, how bad is it now? Daschle tries to give himself some wiggle room, by crying about tax cuts for folks who pay the majority of taxes – again, see my Bernie Sanders Tax Hike Challenge.
BONUS: Senator Rand Paul https://www.congress.gov/congressional-record/volume-168/issue-200/senate-section/article/S10062-1 attempted to increase the voting threshold for budget points of order. 13 Republicans joined all Dumocrats in defeating it. Rand Paul wanted to make it more difficult for Congress to engage in deficit spending sans an offset, most of the Senate would have none of it.
There are Senate GOP Primaries in OH, AZ, WV, MT summer of 2024. All those races are winnable for the GOP. If you have a Rand Paul type candidate in that primary, you have a duty to go vote for that person. We need less Lisa Murkowski, less Mitch McConnell & more Rand Paul, more Mike Lee.
Mr. Chairman, I Yield Back.
719
views

Fake News Stephen Colbert thinks Ron DeSantis is a homosexual?
Recently, Fake News Stephen Colbert was talking about Florida Governor Ron DeSantis & gonorrhea. I have to inform Miss Colbert that Ron DeSantis is not a homosexual, ergo, he is unlikely to contract an STD & I elucidated boatloads of CDC data (and the CDC is always right, aren’t they lol) proving that.
Just as black men (especially in counties run by Democrats) disproportionately are the perpetrators of homicide against black men http://freewebs.com/professor_enigma/covid-increase-homicides – homosexuals disproportionately spread STDs (especially HIV) https://rumble.com/vehq2b-what-if-democrats-treated-homosexuals-like-they-treat-taxpayers-and-gun-own.html & Ron DeSantis is not one of those.
Stephen Colbert tries to be funny (and the king of late night Greg Gutfeld actually is funny), but as he does that he illustrates that he isn’t very bright.
56
views

Even Divorcee Sam Seder knows Raphael Warnock is BRICK DUMB (COVID-19)
www.freewebs.com/professor_enigma/covid-19-hysteria
Here are my last few updates (I got tired of doing it) I posted on death rates for various states:
*10/20/21*: National Data: 44,267,934 cases (13.243% of the entire population) & 724,389 deaths, death rate = 216.705 per 100,000. Since 7/19/21 the percentage of the population diagnosed w/ COVID-19 has increased 32.14% & the death rate has increased 20.17%.
The LOCKDOWNS (NY, NJ, CT, MA, DC, RI) had 5,104,127 cases (12.109% of the entire population) & 114,099 deaths, death rate = 270.704 per 100,000. Since 7/19/21 the percentage of the population diagnosed w/ COVID-19 in the LOCKDOWNS has increased 17.06% & the death rate has increased 3.675%.
The LOCKDOWNS PLUS TWO (NY, NJ, CT, MA, DC, RI, DE, MD) had 5,797,203 cases (11.740%) & 126,827 deaths, death rate = 256.844. Since 7/19/21 the percentage of the population diagnosed w/ COVID-19 in the LOCKDOWNS PLUS TWO has increased 17.48% & the death rate has increased 4.371%.
The NON-LOCKDOWNS (IA, ND, SD, UT, WY, NE, AR) had 2,187,422 cases (15.841%) & 26,128 deaths, death rate = 189.224. Since 7/19/21 the percentage of the population diagnosed w/ COVID-19 in the NON-LOCKDOWNS has increased 29.49% & the death rate has increased 23.368%.
The NON-LOCKDOWNS maintain a death rate 43.06% lower than the LOCKDOWNS & 35.74% lower than the LOCKDOWNS PLUS TWO. Those gaps have closed quite a bit over the past year & part of it is likely the NON-LOCKDOWNS are allowing people to actually live.
As I have elucidated many times, the mobility data & unemployment data indicate that. In spite of all the maniacal mitigation efforts, the LOCKDOWNS & LOCKDOWNS PLUS TWO still have much higher death rates & many more folks per capita being paid not to work. Now, back to the game.
*11/3/21*: National Data: 45,252,647 cases (13.537% of the entire population) & 742,388 deaths, death rate = 222.089 per 100,000.
The LOCKDOWNS (NY, NJ, CT, MA, DC, RI) had 5,198,009 cases (12.332% of the entire population) & 114,819 deaths, death rate = 272.412 per 100,000
The LOCKDOWNS PLUS TWO (NY, NJ, CT, MA, DC, RI, DE, MD) had 5,905,660 cases (11.959%) & 127,791 deaths, death rate = 258.796
The NON-LOCKDOWNS (IA, ND, SD, UT, WY, NE, AR) had 2,255,399 cases (16.334%) & 27,015 deaths, death rate = 195.648
THE NON-LOCKDOWNS retain a death rate still much lower than the LOCKDOWNS or LOCKDOWNS PLUS TWO, despite the latter two’s insane efforts to mitigate COVID-19.
At the link above, I have dozens of updates on COVID-19 death rates for various jurisdictions, feel free to peruse them.
Raphael Warlock insinuates that we’re in the “throes” of a plandmic still, yet it seems that some states dealt w/ it much better & they were the ones that had no shelter-in-place or stay at home order.
I will not cover again in detail the labor force participation rate data, but you can look at it here > www.freewebs.com/professor_enigma/old-fart-rants-sam-seder & an update here https://rumble.com/v1nawgu-divorcee-sam-seder-still-trying-to-defend-joe-bidens-economy.html
Compare California (one of the youngest states) & Iowa (one of the oldest states). The latter is doing much better, the former has a lot of lazy people who do not work.
This never-ending plandemic is being used as an excuse to keep in place policies that keep people from working, because we’re paying them not to work.
I think Warlock actually believes what he’s saying & if that is the case, are we ever going to be out of this? How long will Sam Seder supporters be paid to sit on their fat asses in their small apartments eating Cheetos & being paid not to go slice the lunch meat or ask me if I would “like fries w/ that.”
Warlock’s comments also tacitly admits that the vaccines did not work & Joe Biden was not able to shut down a respiratory virus. We can’t shut down the AIDS virus, which is entirely preventable if you don’t have multiple “partners” (cough) & don’t stick needles in your arm on the street corner – what makes these troglodytes think they can shut down a respiratory virus?
Joe Biden did not shut down the virus, but he did shut down the economy as our labor force participation rates stay flaccid. Ignore these idiots who talk about the unemployment rate, they don’t know dung from apple butter.
In closing, Raphael Warnock is a moron, he’s so dumb even the divorcee Sam Seder knows he’s dumb & Sam Seder is a big, dumb goof himself.
295
views

Bill O'Reilly agrees w/ UTubekookdetector on the midterm results
The only links you’ll need folks
https://rumble.com/v1nawgu-divorcee-sam-seder-still-trying-to-defend-joe-bidens-economy.html
https://rumble.com/v1xrhlu-divorcee-sam-seder-and-chuck-schumer-need-more-unemployed-voters.html
http://freewebs.com/professor_enigma/old-fart-rants-sam-seder
http://freewebs.com/professor_enigma/iowa-never-locked-down
https://www.youtube.com/watch?v=UgRqU1YYk_s
This last link is very important as well – when I run Joe Biden’s spending totals (the data should be out circa March) on various metrics & adjust it per 100,000 employed civilians, you will see that he & this Congress has spent enormous amounts of money (so much spending, even George W. Bush, FDR, LBJ & Barack Obongo would say, “Dude, you’re spending a lot”) for an economy that is teetering on disaster. http://freewebs.com/professor_enigma/sam-seder-aoc-tax-the-rich
We are in serious trouble folks!
Anyways, Bill O’Reilly (who I am NOT a big fan of) agree w/ moi pertaining to why the Dumbasscrats did not get their clocks cleaned last month. The COVID-19 lockdowns were a seminal change in American society, the Democrats got exactly what they wanted.
43
views

Buck Shelton on the Georgia Senate Runoff
Buck Shelton asked a question today, "Why did the GOP lose the George Senate Runoff?"
I believe I have the answer & here's a boatload of data for you to peruse:
https://www.youtube.com/watch?v=lliA3ZJZCAY (begin at 6:00) https://freewebs.com/professor_enigma/old-fart-rants-sam-seder https://www.youtube.com/watch?v=WQYA2r7pxVg (begin at 25:00) http://freewebs.com/professor_enigma/iowa-never-locked-down https://rumble.com/v1xrhlu-divorcee-sam-seder-and-chuck-schumer-need-more-unemployed-voters.html https://rumble.com/v1nawgu-divorcee-sam-seder-still-trying-to-defend-joe-bidens-economy.html
America's labor force participation rates are lagging & the COVID-19 plandemic only made it worse
40
views
1
comment
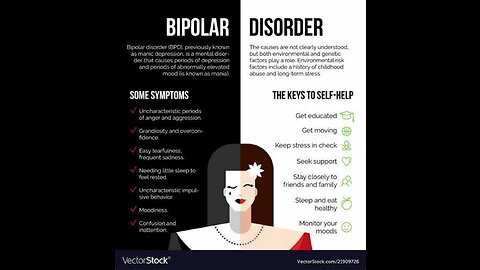
Divorcee Sam Seder won't conduct this analysis of Missouri, Arkansas elections
Sam Seder, Brian Tyler Cohen et al continue to repeat "Red States have higher homicide rates than Blue States" -- they're guilty by omission & the devil is in the details
The only link you'll need http://freewebs.com/professor_enigma/covid-increase-homicides The U.S. crime wave is a Democrat Crime Wave
Here are the counties in Missouri that voted 60% or more for the homely-looking Trudy Busch Valentine: St. Louis City, St. Louis County & Jackson County.
Those counties had a cumulative population of 4,030,266 (2020-21) of & had 1,038 homicides in 2020-21. That is a homicide rate of 25.755 per 100,000. The entire state of MO had 1,351 cases of murder/non-negligent manslaughter (2020-2021) & that’s a homicide rate of 10.963 per 100,000 for that time frame. YIKES!
Here are the counties in MO that vote 60% or more for Eric Schmitt: Adair, Andrew, Atchison, Audrain, Barry, Barton, Bates, Benton, Bollinger, Buchanan, Butler, Caldwell, Callaway, Camden, Cape Girardeau, Carroll, Carter, Cass, Cedar, Chariton, Christian, Clark, Clinton, Cole, Cooper, Crawford, Dade, Dallas, Daviess, DeKalb, Dent, Douglas, Dunklin, Franklin, Gasconade, Gentry, Grundy, Harrison, Henry, Hickory, Holt, Howard, Howell, Iron, Jasper, Jefferson, Johnson, Knox, Laclede, Lafayette, Lawrence, Lewis, Lincoln, Linn, Livingston, McDonald, Macon, Madison, Maries, Marion, Mercer, Miller, Mississippi, Moniteau, Monroe, Montgomery, Morgan, New Madrid, Newton, Nodaway, Oregon, Osage, Ozark, Pemiscot, Perry, Pettis, Phelps, Pike, Polk, Pulaski, Putnam, Ralls, Randolph, Ray, Reynolds, Ripley, St. Clair, Ste. Genevieve, St. Francois, Saline, Schuyler, Scotland, Scott, Shannon, Shelby, Stoddard, Stone, Sullivan, Taney, Texas, Vernon, Warren, Washington, Wayne, Webster, Worth & Wright.
Those counties had a cumulative population 2020-21 of 5,784,221 & had 213 (102 in 2020 & 111 in 2021) homicides in 2020-21. That is a homicide rate of 3.682 per 100,000. By far, the most violent counties in MO vote overwhelmingly for Dumocrats & they alone are the reason the homicide rate there is so high.
The full monty & supplemental info can be found here http://freewebs.com/professor_enigma/covid-increase-homicides
I used https://showmecrime.mo.gov/public/Browse/browsetables.aspx then click on “SRS Crime Rates by County”, then select “Summery Data” (2021 & 2021) & lastly “Summary Offense” (Murder & nonnegligent manslaughter).
Some more data I’ve elucidated for you prior: In Missouri, 51.3% (59 of 115) of its counties had ZERO homicides (2016). An additional 25 counties had one homicide.
13.04% (15 of 115) of MO counties had zero homicides in 2021. 19.13% (only 22 of 115) of MO counties had zero homicides in 2020. They were 8.78% (540,736) of the state population. It was a rough 2 years in the Show Me State.
Let us look at Arkansas. https://www.dps.arkansas.gov/crime-info-support/arkansas-crime-information-center/crime-statistics/ I am going to break my 60% rule a bit on this one as the Democrat nominees for Senate & Governor in AR got smoked.
Here are the 3 counties that were the most lean-Democrat in those recent elections in Razorback land: Phillips, Jefferson & Pulaski. The Dem nominee won 60% of the votes or more only in Pulaski & only in the Gubernatorial race, but considering the Democrats got beat by more than 27% they were definitely outliers.
Those counties had a population of 962,541 (2020-21) & 252 homicides, which equals a homicide rate of 26.180 per 100,000. YIKES!
The GOP received 60% or more in those elections & I usually up the percentage to 66%, so I can focus on outliers. I am going to now tally counties where the GOP received 60% or more of the vote in those races.
Those counties are: Arkansas, Ashley, Baxter, Benton, Boone, Bradley, Calhoun, Clay, Cleburne, Cleveland, Columbia, Conway, Craighead, Crawford, Drew, Faulkner, Franklin, Fulton, Garland, Grant, Greene, Hempstead, Hot Spring, Howard, Independence, Izard, Jackson, Johnson, Lafayette, Lawrence, Lincoln, Little River, Logan, Lonoke, Madison, Marion, Miller, Mississippi, Montgomery, Nevada, Newton, Perry, Pike, Poinsett, Polk, Pope, Prairie, Scott, Searcy, Sebastian, Sevier, Sharp, Stone, Union, Van Buren, White, Woodruff & Yell.
Those counties had a collective population (2020-21) of 4,044,863 & had 277 homicides. That’s a homicide rate of 6.848 per 100,000.
As they say on TV, “That’s not all folks.” As is the case for Missouri, Arkansas’ homicide demographics skew towards one group a lot.
For 2020-21 of the 379 arrestees for Murder/Nonnegligent Manslaughter where the race of the arrestee is known, 66.49% (252) of those arrested were Black. According to the 2020 Census, AR was 15.7% Black. That is what I call disproportionate.
Of AR’s 75 counties, (28) 37.33% had no homicides in 2021. Those counties were 18.97% (574,294) of the state population.
Donald Trump won 26 of those 28 (92.85%) counties in the 2020 election w/ ≥60% of the vote.
Of AR’s 75 counties (24) 32% had zero homicides in 2020.
#samseder #majorityreport The divorcee Stan Seder is still afraid to debate my friend James Patrick Holding on The Impossible Faith https://tektonics.org/lp/nowayjose.php Methinks Stan has no confidence in that religion degree he received from a diploma mill
414
views

Lidia Curanaj & UTubekookdetector debunk Alvin Bragg & Sam Seder (Democrat Crime)
As I have learned over the years, there are a lot of basement-dwellers who simply utilize their free time to yell over everyone who opposes them, even if they've been defeated a dozen times on an issue.
If you see social media vegetables like the divorcee Sam Seder, David "Miss" Pakman, Lollipop Guild Leader Brian Tyler Cohen, or any number of unemployed folks who spend all day on GoogleTube, Facebook or Twitter say "red states have higher homicide rates than blue states" you can rest assured they have done zero research on this issue aside from reading a headline that told them what they wanted to hear.
I have data, they have 24 hrs. of free time & probably a Ritalin prescription to refill. Enjoy!
http://freewebs.com/professor_enigma/covid-increase-homicides https://rumble.com/v1q2eez-joe-scarborough-joy-hofmeister-and-the-democrat-crime-wave.html https://rumble.com/v1tfb1c-chris-schwartz-black-hawk-county-iowa-supervisor-says-were-not-safe-anywher.html https://rumble.com/v1tlfrq-hillary-clinton-parrots-divorcee-sam-seders-parroted-talking-point.html https://rumble.com/v1usbmw-divorcee-sam-seder-wont-conduct-this-analysis-of-michigan-election.html https://rumble.com/v1u66vk-divorcee-sam-seder-wont-have-this-analysis-of-pennsylvania-senate-race.html https://rumble.com/v1nnmn0-divorcee-sam-seder-and-the-democrat-crime-wave.html https://rumble.com/v1oo1bb-divorcee-sam-seder-and-the-democrat-crime-wave-part-ii.html https://rumble.com/v19hafa-brian-tyler-cohen-is-not-very-bright.html
78
views

Divorcee Sam Seder & Chuck Schumer need more unemployed voters
https://ballotpedia.org/Partisan_composition_of_state_legislatures
https://ballotpedia.org/State_government_trifectas
With Chuck Schumer calling for an amnesty & soy boys like the divorcee Sam Seder autistically-repeating that – in an effort to get more voters – let us take a look at some of the most Pro-Republican states vs. some of the most Pro-Dumocrat states & see who is working & who is not.
All the states (and these are all GOP trifectas) that never had a shelter in place or stay at home order will be examined (IA, ND, SD, UT, WY, NE, AR), as well as ID, FL, SC, TX, OH, KS, OK & TN. Those are on the Republican side.
In brackets [] I will put the % of the population that is between (U.S. Census bureau data https://www.census.gov/quickfacts/fact/table/US/PST045221) 18 years of age & 64 years of age so you can get an idea of the “older” & “younger” states. I will also include data on the civilian noninstitutional population (CNP) annual averages (after the *), https://www.bls.gov/lau/rdscnp16.htm https://www.bls.gov/lau/staadata.txt https://www.bls.gov/web/laus/ststdsadata.txt so you can get an idea of what % of those folks are working. I used the annual averages for 2019-2021, courtesy of the Census Bureau & added data for 8 months of 2022 for the en masse average January 2019- August 2022.
If you are wondering why I included states like KS & MA, (the latter just had a GOP Governor defeated, the former had a Dumocrat Governor re-elected), see Ballotpedia’s pages on their state legislature & see who has been running them (even w/ a supermajority much of the time) for the past few decades.
See https://professor_enigma.webs.com/iowa-never-locked-down for some related data on this issue & I also did a video showcasing Hillary Clinton & Joe Biden’s popular vote “victory” & how it is tainted by landslide wins in CA, IL & NY – which have a lot of working age folks taking a break from the labor force. https://rumble.com/v1isntx-david-miss-pakman-debunked-vol.-i.html https://rumble.com/v1nawgu-divorcee-sam-seder-still-trying-to-defend-joe-bidens-economy.html
On the Dumocrat side I will look at CA, IL, NY, NM, HI, NJ, RI, OR, CO, MA, DE & CT.
I am using the Labor Force Participation Rate https://www.bls.gov/cps/definitions.htm#lfpr https://www.bls.gov/cps/definitions.htm#population as it is a better yardstick to determine if our economy is healthy or not.
You may have some folks in their late 60s working because they feel they’ll get fat & die if they stay home too much or they may be working because they had a few divorces earlier in life or made poor financial decisions which force them to work longer than they would like to.
This metric is not perfect, but it will give us a good idea as to which states have more people working as a % of the working age population (40-year-old meth heads who are locked away in an insane asylum are not included in this metric & neither are 50-year-olds who get on disability for “mood disorders” & such) & which ones do not.
Iowa (59.2% * CNP = 2,500,895) Labor Force Participation Rate January 2019-August 2022 (44 months) = 68.05%. 2,500,895 X 0.6805 = 1,701,859
North Dakota (59.9% * CNP = 593,360) Labor Force Participation Rate January 2019-August 2022 = 69.202%. 593,360 X 0.69202 = 410,617
South Dakota (57.9% * CNP = 678,711) Labor Force Participation Rate January 2019-August 2022 = 68.620%. 678,711 X 0.68620 = 465,731
Utah (59.9% * CNP = 2,439,870) Labor Force Participation Rate January 2019-August 2022 = 67.995%. 2,439,870 X 0.67995 = 1,658,990
Wyoming (59.2% * CNP = 451,491) Labor Force Participation Rate January 2019-August 2022 = 64.763%. 451,491 X 0.64763 = 292,399
Nebraska (59% * CNP = 1,504,832) Labor Force Participation Rate January 2019-August 2022 = 69.759%. 1,504,832 X 0.69759 = 1,049,756
Arkansas (59.3% * CNP = 2,349,536) Labor Force Participation Rate January 2019-August 2022 = 57.493%. 2,349,536 X 0.57493 = 1,350,819
Idaho (58.7% * CNP = 1,438,683) Labor Force Participation Rate January 2019-August 2022 = 63.156%. 1,438,683 X 0.63156 = 908,615
Florida (59.2% * CNP = 17,563,495) Labor Force Participation Rate January 2019-August 2022 = 58.561%. 17,563,495 X 0.58561 = 10,285,358
South Carolina (59.9% * CNP = 4,080,702) Labor Force Participation Rate January 2019-August 2022 = 57.547%. 4,080,702 X 0.57547 = 2,348,322
Texas (61.6% * CNP = 22,236,429) Labor Force Participation Rate January 2019-August 2022 = 63.293%. 22,236,429 X 0.63293 = 14,074,103
Ohio (60.1% * CNP = 9,319,129) Labor Force Participation Rate January 2019-August 2022 = 62.018%. 9,319,129 X 0.62018 = 5,779,537
Kansas (59.3% * CNP = 2,251,074) Labor Force Participation Rate January 2019-August 2022 = 66.486%. 2,251,074 X 0.66486 = 1,496,649
Oklahoma (59.7% * CNP = 3,045,832) Labor Force Participation Rate January 2019-August 2022 = 60.663%. 3,045,832 X 0.60663 = 1,847,693
Tennessee (60.9% * CNP = 5,474,708) Labor Force Participation Rate January 2019-August 2022 = 60.897%. 5,474,708 X 0.60897 = 3,333,933
Montana (59.1% * CNP = 873,219) Labor Force Participation Rate January 2019-August 2022 = 62.740%. 873,219 X 0.62740 = 547,858
Mississippi (59.7% * CNP = 2,280,338) Labor Force Participation Rate January 2019-August 2022 = 55.218%. 2,280,338 X 0.55218 = 1,259,157. I do urge my Dumocrat friends (at least the ones who are capable of counting past 10) to run the numbers for MS in the 1980s, 1990s & through even the George W. Bush Administration when the state was run by Dumocrats, see if they’re doing any worse or better now. Point being, MS has always been a state that lags behind the rest of the nation. There’s a slew of Southern states that were run by Dumocrats for decades & decades, but some of those legislatures started to fall under Bill Clinton & George W. Bush.
Missouri (60% * CNP = 4,841,096) Labor Force Participation Rate January 2019-August 2022 = 63.211%. 4,841,096 X 0.63211 = 3,060,105
Kentucky (60.4% * CNP = 3,529,055) Labor Force Participation Rate January 2019-August 2022 = 57.931%. 3,529,055 X 0.57931 = 2,044,417. I do urge my Dumocrat friends (at least the ones who are capable of counting past 10) to run the numbers for KY in the 1980s when the state was run by Dumocrats, see if they’re doing any worse or better now (or relative to the nation en masse). Point being, KY has always been a state that lags behind the rest of the nation.
KY has had its share of Dum Governors (and currently has one) but they do have a GOP supermajority in the legislature & their legislature has been GOP for quite some time.
Alabama (60.1% * CNP = 3,963,972) Labor Force Participation Rate January 2019-August 2022 = 57.134%. 3,963,972 X 0.57134 = 2,264,776
Indiana (60.3% * CNP = 5,299,102) Labor Force Participation Rate January 2019-August 2022 = 63.172%. 5,299,102 X 0.63172 = 3,347,549
Georgia (61.9% * CNP = 8,327,498) Labor Force Participation Rate January 2019-August 2022 = 61.981%. 8,327,498 X 0.61981 = 5,161,467
Arizona (59.5% * CNP = 5,687,398) Labor Force Participation Rate January 2019-August 2022 = 61.304%. 5,687,398 X 0.61304 = 3,486,602
All the above GOP “strongholds” (consult Ballotpedia if you want more info on why I picked those) had a cumulative Civilian Noninstitutional Population (average January 2019-August 2022) of 110,730,425 & averaging out those labor force participation numbers = 61.569% (68,176,312).
If we take the % of the population (2020 Census data) from each of those states above that is in the 18-64 range & combine that we get a total of (1,888,698+466,677+513,380+1,959,698+341,496+1,157,287+1,785,834+1,079,555+12,750,606+3,065,937+17,953,631+7,091,468+1,742,163+2,363,734+4,208,702+640,777+1,767,884+3,692,948+2,721,525+3,019,592+4,091,673+6,630,671+4,255,144) 85,189,080. For what it’s worth that would give us an adjusted labor force participation rate of 80.02% (68176312÷85189080).
Some states are “younger” (CA) & some states are “older” (IA, FL), that’s the reason for that data. That data is not perfect, but it’s a good yardstick using 2020 Census statistics.
Some 68-year-olds may be working because they made some bad financial decisions in their 20s & 30s, so they cannot retire yet. Some 68-year-olds may still be working because they’re afraid if they spend too much time at home, they’ll drink a lot & get fat.
***
California (62.4% * CNP = 31,040,581) Labor Force Participation Rate January 2019-August 2022 = 61.559%. 31,040,581 X 0.61559 = 19,108,271.
Illinois (61.3% * CNP = 10,072,969) Labor Force Participation Rate January 2019-August 2022 = 63.736%. 10,072,969 X 0.63736 = 6,420,108.
New York (61.8% * CNP = 16,083,917) Labor Force Participation Rate January 2019-August 2022 = 59.677%. 16,083,917 X 0.59677 = 9,598,399.
New Mexico (59.1% * CNP =1,658,799) Labor Force Participation Rate January 2019-August 2022 = 57.131%. 1,658,799 X 0.57131 = 947,688.
Hawaii (59.3% * CNP = 1,120,097) Labor Force Participation Rate January 2019-August 2022 = 60.018%. 1,120,097 X 0.60018 = 672,260.
New Jersey (61.3% * CNP = 7,379,202) Labor Force Participation Rate January 2019-August 2022 = 63.159%. 7,379,202 X 0.63159 = 4,660,630.
Rhode Island (62.8% * CNP = 896,239) Labor Force Participation Rate January 2019-August 2022 = 63.631%. 896,239 X 0.63631 = 570,286.
Oregon (61.1% * CNP =3,435,578) Labor Force Participation Rate January 2019-August 2022 = 61.977%. 3,435,578 X 0.61977 = 2,129,268.
Colorado (63.5% * CNP = 4,591,532) Labor Force Participation Rate January 2019-August 2022 = 68.272%. 4,591,532 X 0.68272 = 3,134,731
Massachusetts (63.1% * CNP = 5,729,382) Labor Force Participation Rate January 2019-August 2022 = 65.863%. 5,729,382 X 0.65863 = 3,773,543.
Connecticut (61.8% * CNP = 2,922,495) Labor Force Participation Rate January 2019-August 2022 = 64.975%. 2,922,495 X 0.64975 = 1,898,891.
Washington (62.1% * 6,110,382) Labor Force Participation Rate January 2019-August 2022 = 64.488%. 6,110,382 X 0.64488 = 3,940,463.
Maryland (61.6% * CNP = 4,861,332) Labor Force Participation Rate January 2019-August 2022 = 66.561%. 4,861,332 X 0.66561 = 3,235,751
Delaware (59.1% * CNP = 797,856) Labor Force Participation Rate January 2019-August 2022 = 61.534%. 797,856 X 0.61534 = 490,953.
All the above Dumocrat strongholds had a cumulative Civilian Noninstitutional Population (average January 2019-August 2022) of 96,700,361 & averaging out those labor force participation numbers = 62.648% (60,581,242).
If we take the % of the population (2020 Census data) from each of those states above that is in the 18-64 range & combine that we get a total of (24,671,851+ 7,854,067+ 12,484,372+ 1,251,456+ 862,976+ 5,694,153+ 689,154+ 2,588,963+ 3,666,308+ 4,435,878+ 2,228,473+ 4,784,980+ 3,805,170+ 585,059) 75,602,860. For what it’s worth that would give us an adjusted labor force participation rate of (60581242÷75602860) 80.13%.
Virtually zero difference from the states that are very biased towards the GOP.
***
This is where a bi-polaroid like Sam Seder would declare victory (or a stalemate), but let’s post some info I elucidated previously that focuses on continued unemployment claims per 100,000 nonfarm jobs. https://freewebs.com/professor_enigma/iowa-never-locked-down
Let us average out continued claims per 100,000 Nonfarm jobs for the states I dubbed as the NON-LOCKDOWNS (Iowa, North Dakota, South Dakota, Wyoming, Utah, Nebraska, Arkansas). Their continued claims per 100,000 Nonfarm jobs (from week ending 3/27/2021 to 3/19/2022) = 798.7.
Labor Force Participation Rate for the NON-LOCKDOWNS (IA, ND, SD, UT, WY, NE, AR) April 2021-March 2022 = 65.953%
Continued Claims per 100,000 Nonfarm jobs 2-year average for those states (remember the time frames – week ending 3/10/2018 to 3/9/2019 – week ending 3/16/2019 to 3/14/20) in the 2 time frames PRIOR to pandemic mania beginning (and the Democrats seeing it as an opportunity to literally turn us into East Germany) = 722
Continued Claims per 100,000 Nonfarm jobs in the final time frame (week ending 3/21/20 to 3/20/21) for those states (the NON-LOCKDOWNS) = 3,637.
Let us now average out continued claims per 100,000 Nonfarm jobs for the states I dubbed as the LOCKDOWNS (New York, New Jersey, Rhode Island, DC, Connecticut, Massachusetts). Their continued claims per 100,000 Nonfarm jobs (from week ending 3/27/2021 to 3/19/2022) = 2,409.
Labor Force Participation Rate for the LOCKDOWNS (NY, NJ, CT, MA, DC, RI) April 2021-March 2022 = 64.292%
Now let us run the exact same data for the LOCKDOWNS (NY, NJ, CT, MA, DC, RI):
Continued Claims per 100,000 Nonfarm jobs 2-year average for those states (remember the time frames – week ending 3/10/2018 to 3/9/2019 – week ending 3/16/2019 to 3/14/20) in the 2 time frames PRIOR to pandemic mania beginning (and the Democrats seeing it as an opportunity to literally turn us into East Germany) = 1,634
That is >226% HIGHER than the average in the NON-LOCKDOWNS.
Continued Claims per 100,000 Nonfarm jobs in the final time frame (week ending 3/21/20 to 3/20/21) for those states = 9,464.
Not only were the LOCKDOWNS having a significantly higher number of unemployment continued claims per capita prior to the pandemic (relative to the NON-LOCKDOWNS), but their contraction during the year of the COVID-19 pandemic that I examined was much larger.
Now let’s look at the cumulative Labor Force Participation Rate in the LOCKDOWN (NY, NJ, CT, MA, DC, RI) states for March 2018-February 2019 & March 2019-February 2020 & then compare it to March 2020 to February 2021. I will take each state & average their first two totals & them combine them all at the end.
March 2018-February 2020 Labor Force Participation Rate = 65.614%
March 2020-February 2021 = 63.921%
A much larger contraction than those nasty NON-LOCKDOWNS that wanted people to die.
In closing, if you hear a Joe Biden supporter autistically-repeating, “The Biden economy is good, Brian Stelter’s flabby jowls were jiggling while he said it” you now know that is utter B.S.
As you can see, the COVID-19 plandemic was damaging (I should have run these numbers for a few years prior to the lockdowns & may do that at some point) & even though those Democrat strongholds have a slightly higher labor force participation rate than the GOP strongholds, when you factor in the massive “advantage” those Dumocrat states have pertaining to CONTINUED UNEMPLOYMENT CLAIMS PER 100,000 NONFARM JOBS (>3X the rate in those GOP states from week ending 3/27/2021 to 3/19/2022) that advantage disappears.
Here's the data for California: 2-year average (Continued Claims per 100,000 Nonfarm jobs/employment) = 1,872 (week ending 3/10/2018 to 3/9/2019 & week ending 3/16/2019 to 3/14/20)
There were 11,924 Continued Claims (week ending 3/21/20 to 3/20/21) per 100,000 Nonfarm Employment jobs.
From week ending 3/27/2021 to 3/19/2022 in California there were 3,037 continued claims per 100,000 nonfarm employment jobs. Almost 4X the rate of the NON-LOCKDOWN states. YIKES!
The Joe Biden regime has been suffering from labor force participation rates that are lagging way behind Donald Trump’s, even on some metrics where I include the lockdowns, which did massive damage to our economy. https://rumble.com/v1nawgu-divorcee-sam-seder-still-trying-to-defend-joe-bidens-economy.html
***
Let us run those numbers for each of those states from January-September 2022 (averaged out, seasonally adjusted https://www.bls.gov/web/laus/ststdsadata.txt because we are not doing a full year & I can avoid any preliminary data) & see what how they’re faring under kid sniffer Herr Joe Biden.
We’ll also see who has improved & who has declined relative to the much larger time frame above that I focused on. Let’s begin, shall we?
California Labor Force Participation Rate = 62.088%, CNP = 30,971,183 X 0.62088 = 19,229,388 (monthly average)
Illinois Labor Force Participation Rate = 64.355%, CNP = 10,002,464 X 0.64355 = 6,437,086
New York Labor Force Participation Rate = 59.744%, CNP = 15,817,502 X 0.59744 = 9,450,008
New Mexico Labor Force Participation Rate = 56.677%, CNP = 1,673,156 X 0.56677 = 948,295
Hawaii Labor Force Participation Rate = 60.622%, CNP = 1,113,908 X 0.60622 = 675,273
New Jersey Labor Force Participation Rate = 62.8%, CNP = 7,407,483 X 0.628 = 4,651,899
Rhode Island Labor Force Participation Rate = 63.411%, CNP = 901,324 X 0.63411 = 571,539
Oregon Labor Force Participation Rate = 63.222%, CNP = 3,470,241 X 0.63222 = 2,193,956
Colorado Labor Force Participation Rate = 69.177%, CNP = 4,670,195 X 0.69177 = 3,230,701
Massachusetts Labor Force Participation Rate = 65.877%, CNP = 5,720,387 X 0.65877 = 3,768,419
Connecticut Labor Force Participation Rate = 64.244%, CNP = 2,941,542 X 0.64244 = 1,889,764
Washington Labor Force Participation Rate = 64.833%, CNP = 6,187,880 X 0.64833 = 4,011,788
Maryland Labor Force Participation Rate = 65.711%, CNP = 4,878,983 X 0.65711 = 3,206,029
Delaware Labor Force Participation Rate = 61.133%, CNP = 817,141 X 0.61133 = 499,543
The combined CNP for all those states above is 96,573,389 & their combined labor force participation rate was 62.919% (60,763,688).
***
Now for the GOP states:
Iowa Labor Force Participation Rate = 67.444%, CNP = 2,519,844 X 0.67444 = 1,699,484
North Dakota Labor Force Participation Rate = 69.1%, CNP = 592,688 X 0.691 = 409,547
South Dakota Labor Force Participation Rate = 68.677%, CNP = 691,956 X 0.68677 = 475,215
Utah Labor Force Participation Rate = 67.844%, CNP = 2,533,244 X 0.67844 = 1,718,654
Wyoming Labor Force Participation Rate = 63.511%, CNP = 457,018 X 0.63511 = 290,257
Nebraska Labor Force Participation Rate = 69.888%, CNP = 1,517,764 X 0.69888 = 1,060,735
Arkansas Labor Force Participation Rate = 56.744%, CNP = 2,376,860 X 0.56744 = 1,348,725
Idaho Labor Force Participation Rate = 62.288%, CNP = 1,512,528 X 0.62288 = 942,123
Florida Labor Force Participation Rate = 59.066%, CNP = 17,925,692 X 0.59066 = 10,587,989
South Carolina Labor Force Participation Rate = 57.222%, CNP = 4,179,377 X 0.57222 = 2,391,523
Texas Labor Force Participation Rate = 63.6%, CNP = 22,783,322 X 0.636 = 14,490,193
Ohio Labor Force Participation Rate = 61.777%, CNP = 9,348,910 X 0.61777 = 5,775,476
Kansas Labor Force Participation Rate = 66.277%, CNP = 2,264,814 X 0.66277 = 1,501,051
Oklahoma Labor Force Participation Rate = 60.511%, CNP = 3,089,369 X 0.60511 = 1,869,408
Tennessee Labor Force Participation Rate = 60.766%, CNP = 5,571,598 X 0.60766 = 3,385,637
Montana Labor Force Participation Rate = 62.444%, CNP = 899,905 X 0.62444 = 561,937
Mississippi Labor Force Participation Rate = 55.277%, CNP = 2,284,918 X 0.55277 = 1,263,034
Missouri Labor Force Participation Rate = 62.955%, CNP = 4,881,528 X 0.62955 = 3,073,166
Kentucky Labor Force Participation Rate = 58.066%, CNP = 3,550,033 X 0.58066 = 2,061,362
Alabama Labor Force Participation Rate = 56.966%, CNP = 3,999,731 X 0.56966 = 2,278,487
Indiana Labor Force Participation Rate = 62.8%, CNP = 5,350,348 X 0.628 = 3,360,019
Georgia Labor Force Participation Rate = 62.1%, CNP = 8,476,392 X 0.621 = 5,263,839
Arizona Labor Force Participation Rate = 60.866%, CNP = 5,862,342 X 0.60866 = 3,568,173
The combined CNP for all those states above is 112,670,181 & their combined labor force participation rate was 61.574% (69,376,034).
Remember to circle back & look at the percentages of the population that were 18-64 & also take a gander at the continued unemployment claims per 100,000 nonfarm jobs. When you consider that, the GOP-dominated states do much better than the Dumocrat states, especially the GOP states that never had a shelter-in-place or stay-at-home order during the COVID-19 plandemic.
Chuck Schumer & the demented divorcee Sam Seder want to bring in more unemployed voters so they can have Medicare-for-All, pack the SCOTUS, *try* to take away everyone’s guns, no school choice or vouchers so no poor black kids can escape Detroit, Flint & Chicago’s poor government schools & make all election by mail all the time w/ out-of-precinct voting on a regular basis & of course, no Photo ID.
America’s birth rate has cratered since the Baby Boom Generation & since that time the % of kids growing up sans daddy has skyrocketed. So, we have less births & more dysfunctional children. https://www.youtube.com/playlist?list=PLoA9J0G6s-6owc0S5klji-hEBtbAzbloB
Many of our government schools are churning out idiots who can barely read, but they will vote, this is done on purpose. Our drug overdose death rate has almost monolithically increased since the late 1970s. http://freewebs.com/professor_enigma/america-has-a-drug-problem Too many people in the wagon, not enough productive people to pull it.
Schumer & the divorcee Sam Seder want to fill the void w/ millions of folks who will do nothing but exacerbate our coming entitlement tsunami & many of them are not even literate in their own language.
They do not want immigration via merit https://rumble.com/vdr66v-old-fart-rants-is-dung-now-by-utubekookdetector-illegal-immigration.html because those people are less likely (since they likely have a skill & have something to lose) to vote Democrat so they want to flood this country willy-nilly w/ migrants so they can have a majority for a generation or more.
If you want more data on labor force participation rates over long time frames see https://www.youtube.com/watch?v=lliA3ZJZCAY (begin at 6:00) https://freewebs.com/professor_enigma/old-fart-rants-sam-seder https://www.youtube.com/watch?v=WQYA2r7pxVg (begin at 25:00)
356
views

Brandon Straka & the January 6th Persecution
Two clips, mainly featuring Brandon Straka (on the Larry Elder show & Sebastian Gorka's Reality Check) & the harassment he received from the FBI following his filming of some of the events at the U.S. Capitol on January 6th, 2021 -- the so-called #INSURRECTION.
Other folks are mentioned too & this is being used by the FBI in a Stasi-style crackdown & intimidation tactic.
Ron Paul warned us about the police state decades ago, most people did not listen.
47
views
The Salty Cracker, Arizona Treasurer, Arizona Governor
The Salty Cracker recently made a comment pertaining to the number of votes for the Republican Treasurers candidate in Arizona (Kimberly Yee), relative to the # of votes Kari Lake received. I decided to look this up myself. https://uselectionatlas.org/RESULTS/ https://ballotpedia.org/Arizona https://archive.ph/nxln5 https://uselectionatlas.org/RESULTS/state.php?fips=4&year=2022&f=0&off=8&elect=0
2022 AZ Treasurer total votes = 2,454,904 (R) 1,366,196 (D) 1,088,708 (97.6% as many votes as cast in the Governor’s race)
2022 AZ Governor total votes = 2,515,100 (R) 1,247,859 (D) 1,267,241
2022 AZ Senate total votes = 2,527,944 (R) 1,174,755 (D) 1,300,471
***
2018 AZ Treasurer total votes = 2,301,317 (R) 1,249,120 (D) 1,052,197 (96.83% as many votes as cast in the Governor’s race)
2018 AZ Governor total votes = 2,376,441 (R) 1,330,863 (D) 994,341
2018 AZ Senate total votes = 2,384,308 (R) 1,135,200 (D) 1,191,100
***
2014 AZ Treasurer total votes = 1,063,472 (R) 1,063,472 (unopposed)
2014 AZ Governor total votes = 1,508,919 (R) 805,062 (D) 626,921
2014 AZ Senate total votes = NO RACE
***
2010 AZ Treasurer total votes = 1,527,338 (R) 795,298 (D) 628,436 (88.29%)
2010 AZ Governor total votes = 1,729,736 (R) 938,934 (D) 733,935
2010 AZ Senate total votes = 1,713,334 (R) 1,005,615 (D) 592,011
***
2006 AZ Treasurer total votes = 1,448,328 (R) 821,138 (D) 627,190 (94.43%)
2006 AZ Governor total votes = 1,533,645 (R) 543,528 (D) 959,830
2006 AZ Senate total votes = 1,526,782 (R) 814,398 (D) 664,141
***
2002 AZ Treasurer total votes = 1,166,129 (R) 597,435 (D) 568,694 (95.1%)
2002 AZ Governor total votes = 1,226,111 (R) 554,465 (D) 566,284
2002 AZ Senate total votes = NO RACE
***
1998 AZ Treasurer total votes = 886,508 (R) 714,739 (D) 171,769 (87.11%)
1998 AZ Governor total votes = 1,017,616 (R) 620,188 (D) 361,552
1998 AZ Senate total votes = 1,013,280 (R) 696,577 (D) 275,224
***
1994 AZ Treasurer total votes = 1,051,122 (R) 582,367 (D) 398,892 (93.05%)
1994 AZ Governor total votes = 1,129,607 (R) 593,492 (D) 500,702
1994 AZ Senate total votes = 1,119,060 (R) 600,999 (D) 442,510
***
1990 AZ Treasurer total votes = 992,009 (R) 554,539 (D) 437,470 (93.99% as many votes as cast in the Governor’s race)
1990 AZ Governor total votes = 1,055,406 (R) 523,984 (D) 519,691
1990 AZ Senate total votes = NO RACE
***
I see what The Salty Cracker is getting at & I think it’s hokey & incompetent for these morons (who required everyone to be registered by 10/11/22, so they would KNOW how many ballots you would roughly need & how much time it would take to count that upper limit, assuming turnout is not insanely high https://azsos.gov/elections/about-elections/voter-registration-procedures https://vote.gov/register/az/ ) to be taking 6 days to do what Florida & Iowa did in about 6 hours.
Iowa’s final House race was called at noon on Wednesday, maybe AZ officials need to talk to FL or IA’s Secy. of State on how to conduct an election.
That said, as far back as I went you can see that the number of votes cast for Treasurer overall was always LOWER than the raw number of votes cast for Governor in each case (indicating voters are not as interested in that race obviously) or Senate if there was a Senate contest.
That happened every single time. I should also point out that the Republicans did not lose a Treasurer’s contest in the 9 election cycles I examined. Prior to 2022, they did lose 2 Gubernatorial contests.
Did the AZ Republican Treasurer Candidate (throwing out 2014, as the “R” was unopposed) ever receive more votes than the Republican Gubernatorial nominee? Yes, in 2006 (GOP lost), 2002 (GOP lost), 1998 (GOP won) & 1990 (GOP won).
This is not the first time prior to 2022 that occurred. The % of votes cast in the Treasurers contest as a % of all votes cast for Governor was the highest in the time-frame, but not outlier high, as it was only slightly ahead of 2018 & in 2002 it was >95%.
Arizona definitely needs to talk to Iowa and/or Florida on how you count votes & maybe lay off the absentee voting a bit. You should be required to have a good reason for an absentee ballot (you will be out of state on business because you drive a semi or you are in a nursing home), this willy-nilly mailing of ballots as they do in some states is just a magnet for fraud & then you have a fight over “curing” ballots, which doesn’t happen nearly as much if you vote in-person.
My curiosity was piqued by what The Salty Cracker said & figured I would look it up. He’s usually right, but I don’t think there’s enough evidence there, I would say enough independents voted for the “R” Treasurer Candidate & then voted for Hobbs. Why? I don’t know what is going on in their heads.
Of course, this 6-day ballot counting is going to make people question the integrity of your election, especially when numerous other states wrapped it up in less than 8 hours & even the “close races” were called the next day.
Hand-marked paper ballots are the way to go, I would shelve the touch screen voting crap. If you are in a state where Republicans have a trifecta & you have not done the following things (I will be writing my local officials) 1) You need a reason to vote absentee 2) No local officials allowed to “cure” ballots – if you are going to vote absentee, get it right or show up in person 3) No dropboxes all over the countryside that can be stuffed full of ballots at 3AM 4) No mail-in ballots accepted after the polls close on election day
280
views

Divorcee Sam Seder won't have this analysis of Pennsylvania Senate Race
http://freewebs.com/professor_enigma/covid-increase-homicides https://uselectionatlas.org/RESULTS/
https://www.ucr.pa.gov/PAUCRSPUBLIC/Home/Index
Counties in PA that voted 60% or more for Festerman in 2022: Alleghany, Delaware, Montgomery & Philadelphia.
Cumulative population for those counties 2021 & 2021 = 8,536,526
Cumulative homicides for those counties 2021 & 2020 = 1,413
Homicide rate = 16.552 per 100,000
Counties in PA that voted 60% or more for Oz in 2022: Adams, Armstrong, Bedford, Blair, Bradford, Butler, Cambria, Cameron, Clarion, Clearfield, Clinton, Columbia, Crawford, Elk, Fayette, Forest, Franklin, Fulton, Greene, Huntingdon, Indiana, Jefferson, Juniata, Lebanon, Lycoming, McKean, Mercer, Mifflin, Northumberland, Perry, Potter, Schuylkill, Snyder, Somerset, Sullivan, Susquehanna, Tioga, Venango, Wayne & Wyoming.
Cumulative population for those counties 2021 & 2021 = 5,355,529
Cumulative homicides for those counties 2021 & 2020 = 134
Homicide rate = 2.502 per 100,000
The counties where John Festerman, I mean John Fetterman received 60% or more of the vote had homicide rates >6.5X higher than the counties where Dr. Oz received 60% of the vote or more. Show me your voters, I will show you who you are.
#majorityreport #samseder https://www.tektonics.org/lp/nowayjose.php Stan Seder is afraid to debate my friend James Patrick Holding on The Impossible Faith.
Methinks Sam Seder has some doubts about that religion degree he obtained from a diploma mill
59
views
Divorcee Sam Seder won't conduct this analysis of Michigan election
The most violent jurisdictions in America have lots of black on black homicide, lots of fatherless children & they overwhelmingly vote Democrat.
http://freewebs.com/professor_enigma/covid-increase-homicides
Counties in MI that voted ≥60% for Gretchen Whitmer in the 2022 MI Gubernatorial election: Ingham, Kalamazoo, Marquette, Oakland, Washtenaw & Wayne.
Those counties had a cumulative 2020-2021 population of 8,078,269
Those counties had 880 homicides 2020-21, which is a homicide rate of 10.893 per 100,000. That’s more than 6.5X the rate of the very pro-GOP counties. Joe Biden, show me your voters, show me counties that your party has dominated for decades & I will show you who you are.
Your lot is a violent, sadistic, selfish, slothful group that blames everyone else for your failures. People like Rashida Tlaib have been getting elected in Detroit for over half a century, wonder why nothing changes. The homicide rate fluctuates a bit, but nothing else changes.
Counties in MI that voted ≥60% for Tudor Dixon: Alcona, Arenac, Barry, Branch, Cass, Dickinson, Gladwin, Hillsdale, Huron, Kalkaska, Lapeer, Luce, Menominee, Missaukee, Montcalm, Montmorency, Newaygo, Ogemaw, Osceola, Oscoda, Sanilac, Tuscola & Wexford.
Those counties had a cumulative 2020-2021 population of 1,537,461
Those counties had 25 homicides 2020-21, which is a homicide rate of 1.626 per 100,000
In 2020-2021 in Michigan, there were 716 arrests for Murder/Nonnegligent Manslaughter where the RACE of the arrestee was known. Of those 716 (536), 74.86% of the arrestees were Black. Michigan is only 14.1% Black. #blacklivesmatter
In 2020 & 2021, of the 1,492 murder victims in the Wolverine State where the race of the victim was known, 72.18% (1,077) of those victims were Black.
Much of that is Oakland & Wayne counties, don’t forget, #blacklivesmatter Lots of black on black violence in Democrat strongholds like Pontiac, Flint & Detroit.
Some of my previous info repeated
MI counties that were 60% or more for Donald Trump in 2016 & 2020.
Those counties are: Alcona, Allegan, Alpena, Antrim, Arenac, Baraga, Barry, Branch, Cass, Cheboygan, Clare, Crawford, Dickinson, Gladwin, Gratiot, Hillsdale, Huron, Ionia, Iosco, Iron, Kalkaska, Lapeer, Livingston, Luce, Mackinac, Menominee, Missaukee, Montcalm, Montmorency, Newaygo, Oceana, Ogemaw, Ontonagon, Osceola, Oscoda, Otsego, Presque Isle, Roscommon, St. Clair, St. Joseph, Sanilac, Schoolcraft, Tuscola & Wexford.
Homicides for those counties 2018-2020 = (26 in 2020, 32 in 2019, 23 in 2018) 81
Cumulative Population for those counties 2018-2020 = 5,003,167
Homicide Rate 2018-2020 = 1.618 per 100,000. Notice the difference from the uber-Democrat areas of Michigan versus the uber-Republican areas?
Counties in MI that had ZERO murders/non-negligent manslaughter events in 2021 (make sure you read the notes): Alcona, Alger, Antrim, Baraga, Benzie, Charlevoix, Cheboygan, Crawford, Delta, Dickinson, Emmet, Gladwin, Hillsdale, Houghton, Huron, Iron, Kalkaska, Keweenaw, Lake, Leelanau, Mason, Mecosta, Menominee, Midland, Montmorency, Newaygo, Oceana, Ogemaw, Ontonagon, Osceola, Oscoda, Otsego, Presque Isle, Roscommon, Schoolcraft, Shiawassee & Wexford.
37 of MI’s 83 counties (44.57%) had ZERO murders in 2021.
Counties in MI that had ZERO murders/non-negligent manslaughter events in 2020: Alcona, Alger, Antrim, Arenac, Baraga, Barry, Cass, Clare, Clinton, Crawford, Delta, Dickinson, Gladwin, Gogebic, Grand Traverse, Gratiot, Houghton, Iosco, Iron, Kalkaska, Keweenaw, Lake, Lapeer, Leelanau, Luce, Mackinac, Marquette, Mason, Mecosta, Menominee, Missaukee, Monroe, Montmorency, Newaygo, Oceana, Ogemaw, Ontonagon, Osceola, Oscoda, Sanilac, Shiawassee & Tuscola.
42 of MI’s 83 counties (50.6%) had zero homicides (2020) & that was 13.98% of the state population (1,409,262).
Donald Trump won 32 of those 42 (76.19%) counties ≥60% of the vote in 2020.
39 of Michigan’s 83 counties (46.98%) had zero homicides in 2016. An additional 20 counties had ONE homicide.
Sam Seder is afraid to debate my friend James Patrick Holding on The Impossible Faith #samsederwontdebateJPH #samseder #majorityreport https://tektonics.org/lp/nowayjose.php
241
views
4
comments

Joanna Mellinthin (Facebook Idiots on Parade)
Another Deidre DeJear supporter (Joanna Mellonheadthin aka Joanna Mell) gets squashed. Who needs data when you have emoticons, memes, crayons, coloring books & 47 cats in your apartment? http://freewebs.com/professor_enigma/facebook-idiots-on-parade http://freewebs.com/professor_enigma/covid-increase-homicides
28
views

Hillary Clinton parrots Divorcee Sam Seder's parroted talking point
Sam Seder #samseder #majorityreport recently parroted a fake, undetailed talking point that was parroted by Brianna Tyler Cohen, Joe Scarborough, the DNC. et al. https://rumble.com/v1q2eez-joe-scarborough-joy-hofmeister-and-the-democrat-crime-wave.html
Just autistically-repeating "Red States have higher homicide rates than Blue States" doesn't cut it. Nations that vote for Joe Biden have higher homicide rates than nations that vote for Donald Trump.
Let's look at the demographics of homicide & let us begin looking at county-level & city data.
Now, the cackling troglodyte Hillary Clinton has regurgitated this talking point, so let's nuke it..... again.
http://freewebs.com/professor_enigma/covid-increase-homicides
51
views

Chris Schwartz (Black Hawk County, Iowa Supervisor) says we're not safe anywhere
http://freewebs.com/professor_enigma/votechrisschwartz-black-hawk cross posted http://freewebs.com/professor_enigma/covid-increase-homicides
Here is THE ENTIRE SPIEL for your pleasure
The following is a total & complete debunking of Black Hawk County, Iowa Supervisor Chris Schwartz & his lack of an education on guns. The dumb comments he made can be found https://archive.ph/x4S0k & https://rumble.com/v1jns2a-chris-schwartz-black-hawk-county-iowa-supervisor-and-the-real-democrat-insu.html.
Chris Schwartz hits all the usual points that people who have never used a firearm & don’t understand the 2nd Amendment. The dumbest statement is likely the “we’re not safe anywhere” line, which is gross Freudian Projection.
Then next dumbest line is the whining about the gun lobby. As I will prove further in this essay, it is not white, rural counties won overwhelmingly by Republicans that are the problem. It’s a small segment of America (usually decaying inner-city cesspools) that overwhelmingly votes Democrat – those are the areas of America that are really deteriorating & have had homicide rates well above the national average for decades.
Later in this essay I will debunk him on a national level, let us look at some data from Iowa & since I have good county & city data from 2016-2021, I will focus on that.
I did a previous video on Iowa’s uber-low homicide rates https://rumble.com/vfvmzh-story-county-iowa-supervisor-latifah-faisal-and-iowas-constitutional-carry-.html before I discovered new information. That is simply a supplemental to this & all the data came from the Iowa Legislature.
Here are the demographics of some of the Iowa cities I will be examining
https://www.census.gov/quickfacts/fact/table/councilbluffscityiowa,davenportcityiowa,desmoinescityiowa,iowacitycityiowa,fortdodgecityiowa,waterloocityiowa/PST045221
https://www.census.gov/quickfacts/fact/table/amescityiowa,cedarrapidscityiowa,davenportcityiowa,desmoinescityiowa,iowacitycityiowa,fortdodgecityiowa/PST045221
Let us begin!
***
According to the FBI, https://ucr.fbi.gov/crime-in-the-u.s/ https://crime-data-explorer.app.cloud.gov/pages/explorer/crime/crime-trend (I used the latter) Iowa had (2016-2021) 422 homicide incidents (67, 90, 41, 62, 96, 66), which is a homicide rate of 2.194 per 100,000 – well below the national average.
Iowa state data says https://icrime.dps.state.ia.us/CrimeInIowa/Report/CrimeDensityReports https://icrime.dps.state.ia.us/CrimeInIowa/Report/AnnualTrendReport https://icrime.dps.state.ia.us/CrimeInIowa/Report/CrimeTrends (select “Murder and Nonnegligent Manslaughter” & then the reporting period should be January 2016-December 2021) there were 483 occurrences of Murder/Nonnegligent Manslaughter.
Not sure why there’s basically a difference of 10 homicides per year, but that would push the Iowa rate a bit higher, but still well below the national rate.
Iowa of course, like most states is not homogenous (as you will see later, ~2/3 of Iowa’s counties have ZERO homicides in a given year) – some areas are dangerous, most are not.
Let’s look at arrests for Murder/Nonnegligent Manslaughter in Iowa 2016-2021. https://icrime.dps.state.ia.us/CrimeInIowa/Report/ArrestDistribution Select “Murder & Nonnegligent Manslaughter”, report by County, time frame is 1/1/16 to 12/31/2021 & Arrestee Race.
Boom! Of the 313 arrestees where the race of the arrestee was known, 47.28% of the arrestees were Black. According to the Census Bureau, Iowa is 4.3% Black https://www.census.gov/quickfacts/fact/table/IA/PST045221 in 2020. https://archive.ph/0P4MA
https://icrime.dps.state.ia.us/CrimeInIowa/Report/CrimeDistributionReport According to Iowa state data, (2016-21) of the 473 victims where the race of the victim was known, 39.54% (191) of them were Black. https://archive.ph/xaz75
According to the FBI, https://crime-data-explorer.app.cloud.gov/pages/explorer/crime/crime-trend of the 503 homicide offenders in Iowa (2016-2021) where the race of the assailant is known, 48.111% (242) of the arrestees were Black. Of the 468 victims of homicide in Iowa (2016-2021), 40.38% (189) of the victims were Black.
That’s called disproportionate kids!
Now let us look at the most Democrat-dominated counties in Iowa (and they are few & far between) & see how they rank against the entire state pertaining to homicide. If you want to look at more data on House Districts (which are much smaller & a good gauge of the voting preferences of a county) then see https://www.legis.iowa.gov/legislators/house. Some Iowa House Districts overlap into other counties though, but the primary county is the one listed & feel free go through archived versions in the WayBack Machine to see how they have changed.
I will be fudging my ≥60% of the vote method a bit. Johnson County voted ≥60% for the Dumocrat nominee for Governor & POTUS (“Brain Dead” Fred Hubbell & Senile Biden), no other county did that.
I will also be including some Democrat-leaning counties that get close, especially when one considers Iowa State House Districts. You can also see (if you do the research) that cities within some of these counties differ quite markedly.
I know this will come as a shock to mentally ill MSNBC contributors that the entire U.S. isn’t like New York City, a Borg Hive Mind.
The counties I am examining are Johnson, Story, Linn, Polk & Black Hawk (Hello Chris Schwartz).
According to Iowa State Data https://icrime.dps.state.ia.us/CrimeInIowa/Report/DrillDownReports (I selected 1/1/16-12/31/21 as my Incident Data time frame, Report By County, Time of Day, “Murder & Nonnegligent Manslaughter” then those counties listed above & “Day of Week” to get all this data) those counties had 231 occurrences of “Murder/Nonnegligent Manslaughter” from 2016-21. https://archive.ph/acgpJ
According to the Census Bureau https://www.census.gov/data/datasets/time-series/demo/popest/2010s-counties-total.html https://www.census.gov/data/datasets/time-series/demo/popest/2020s-counties-total.html those counties had a collective (2016-21) population of 6,559,677 & that yields a homicide rate of 3.521 per 100,000.
That is lower than the national average (higher than the IA average), now let’s drill down to some of the most homicide-riddled cities in Iowa & I will be adding Davenport (Scott County) because Scott county en masse is not as Democrat-leaning as Davenport is.
Council Bluffs is a problem area within Pottawattamie County, so they will be included as well.
The individual cities I will now be examining (and I will supplement it, if possible, with local police data later) are Waterloo, Cedar Rapids, Des Moines, Davenport, Ames, Council Bluffs & Iowa City. https://icrime.dps.state.ia.us/CrimeInIowa/Report/DrillDownReports
Those entities had 246 homicides (50.93% of all Iowa homicides comparing to other state data) 2016-2021. They had a collective population of 4,334,466 in those years which gives us a cumulative homicide rate of 5.675 per 100,000. Much, much, MUCH higher than the Iowa state average & higher than the national average in that time frame. https://archive.ph/b7lao
I could’ve added Fort Dodge & they alone (cumulative population of 146,403 from 2016-21) had 11 homicides 2016-21, yielding a homicide rate of 7.513 per 100,000. YIKES!
Webster County is a GOP county, but Fort Dodge is a lean-Dumocrat or break-even city. If you want to dig through this data & find proof go to https://sos.iowa.gov/elections/results/precinctvotetotals2020general.html or https://sos.iowa.gov/elections/results/precinctvotetotals2016general.html & look up the precinct results for the 2016 (this one was a lot closer) or 2020 (Senile Biden won decisively) in Webster County. Outside Fort Dodge, Webster County is decisively Republican. Feel free to peruse other races, you will see Fort Dodge is break-even or lean Democrat.
Their long time Mayor Matt Bemrich https://www.messengernews.net/news/local-news/2019/12/buttigieg-in-fd/ endorsed Pete Buttigieg for POTUS. YUCK!
If I now add Fort Dodge w/ Waterloo, Cedar Rapids, Des Moines, Davenport, Ames, Council Bluffs & Iowa City we have a cumulative population of 4,480,869 (2016-21) & 257 homicides, 53.2% of Iowa’s homicides. Homicide rate for those entities = 5.735 per 100,000. The decisively exceeds the national average for that time frame. Those jurisdictions are <24% of Iowa’s population. Let that sink in.
https://icrime.dps.state.ia.us/CrimeInIowa/Report/ArrestDistribution How about arrests for Murder/Nonnegligent Manslaughter in Black Hawk, Johnson, Linn, Polk & Story counties 2016-21?
Of the 163 arrests for that offense, 57.05% (93) of them were Black. https://archive.ph/aBHOC
As I presumed (and not gratuitously), the vast majority of the Great State of Iowa is as safe as a baby in its mother’s arms because we don’t largely demonize police or gunowners. Most of Iowa does not have a hood rat, meth head culture, but the worst areas in Iowa have homicide rates above the national average so let’s can this “red states have higher homicide rates than blue states” crap that tossed around at the local pool hall.
You can see the problem children in Iowa & all of them (the only exception might be Council Bluffs, but I would wager that city leans Democrat, while the county does not. The Council Bluffs-Omaha Metropolitan area is a dangerous place, if you don’t believe me peruse Omaha’s annual police reports https://police.cityofomaha.org/crime-information/annual-reports) are Democrat-leaning cities.
The data from the Council Bluffs Police Dept. is https://www.councilbluffs-ia.gov/2505/Crime-Statistics basically worthless.
Now for some local data that will also be uncomfortable for woke, LGBT Iowa Democrats or Dumocrats in general.
According to the FBI https://crime-data-explorer.app.cloud.gov/pages/explorer/crime/crime-trend (Select “Iowa” & then your jurisdiction) here are the number of reported homicides 2016-21 for Waterloo (32), Fort Dodge (11), Cedar Rapids (41), Des Moines (94), Davenport (46), Ames (8), Council Bluffs (13) & Iowa City (9) = 254 homicides, only 3 less than State of Iowa data.
I already covered Davenport & Des Moines https://professor_enigma.webs.com/sam-seder-ilhan-omar-racism3 & had local data for them, here’s local police dept. data if I can find it. Already informed you local Council Bluffs data is useless.
The Waterloo Police Dept. https://web.archive.org/web/20220000000000*/https://waterloopolice.com/images/recordsreports/ucrstats.pdf reports 29 cases of Murder/nonnegligent Manslaughter 2016-21.
Waterloo’s Mayor is a Democrat https://www.ci.waterloo.ia.us/government/mayor/index.php who appears to be making a career of being Mayor of one of Iowa’s most dangerous cities. https://www.democraticmayors.org/pressandmediablog/the-gazette-mayor-quentin-hart-how-biden-democrats-are-helping-iowans He presses all the right “cradle-to-grave” care buttons on the Democrat agenda & even endorsed “Rear Admiral” Pete Buttigieg. https://www.kwwl.com/news/waterloo-mayor-quentin-hart-endorses-pete-buttigieg-for-president/article_63977270-4908-513e-9df7-0278aee2621c.html
How about Cedar Rapids? https://www.cedar-rapids.org/local_government/departments_g_-_v/police/annual_report.php They tally 33 homicides 2016-20, 2021 data is not yet out.
How about Iowa City? https://www.icgov.org/city-government/departments-and-divisions/police-department/resources-and-documents https://www8.iowa-city.org/WebLink/DocView.aspx?id=2064506&dbid=0&repo=CityofIowaCity&cr=1
From 2017-2021 they list 10 murders in the city.
The Council of Iowa City opposed https://www.thegazette.com/local-government/iowa-city-council-opposes-gun-amendment-on-the-november-ballot/ (as did all House & Senate Democrats, as well as the Johnson County, Linn County Board of Supervisors & the Cedar Rapids School Board https://www.thegazette.com/k/cedar-rapids-school-board-opposes-gun-amendment/, surprise!) Iowa’s Gun Rights Amendment, https://ballotpedia.org/Iowa_Amendment_1,_Right_to_Keep_and_Bear_Arms_Amendment_(2022) which passed easily. Using phrases like “common sense” are just B.S., especially when you consider this contingent, this voting bloc largely thinks it is kosher to allow biological men in the same locker room w/ women.
They just want to use these ambiguous “common sense” moving goalposts to allow for eventual broad confiscation. These people are nuts & I will do a separate debunking of that piece soon.
Why is it the most violent places in Iowa oppose “common sense” proclamations like, “Law-abiding citizen from rural Iowa can have a handgun on his person to defend himself in the unlikely event he gets attacked. If he does to certain parts of Des Moines, Davenport or Waterloo, it becomes a bit more likely.”
They don’t like that, but if they lived in Waterloo or a shady part of Des Moines, they wouldn’t want the tweakers or meth heads to be the only people w/ guns. They oppose the “strict scrutiny” language because they want to codify “red flag” laws, that do not give “due process” the attention it deserves.
In closing, the most violent cities & counties in Iowa are not uber-Republican (although Council Bluffs is in a lean-Republican county, as is Fort Dodge) & when one looks at the homicide & victim data, we can conclude that it is not white, rural Iowa. ~2/3 of Iowa’s counties in any given year have ZERO homicides.
When 24% of the population is committing 53.2% of the homicides & the arrestees are disproportionately Black, the Democrats need to use a phrase they are fond of, “Common Sense.”
Chris Schwartz (Black Hawk County, Iowa Supervisor), along w/ most Democrats is completely confused/Fascist on firearms & the Second Amendment. Make no mistake Iowans, this lunatic et al. want to confiscate firearms from every law-abiding citizen in Iowa.
It won’t happen, but that doesn’t mean the pudgy little Hobbit won’t make the attempt. The next time some Fascist screeches, “We are not safe anywhere”, feel free to use this essay as a blowback.
I’ve elucidated this in my essays on homicide (this entire spiel will be crossposted @ http://freewebs.com/professor_enigma/covid-increase-homicides ) & let me go a bit further w/ data going way back.
The racial characteristics of homicide in these United States has been commonplace for many decades, unless you’re a fatherless #blacklivesmatter terrorist & your head is ensconced in one of your orifices.
https://stacks.cdc.gov/view/cdc/12871 & https://www.cdc.gov/nchs/data/series/sr_20/sr20_006acc.pdf
https://stacks.cdc.gov/view/cdc/65093 & https://www.ncbi.nlm.nih.gov/pmc/articles/PMC1435670/pdf/pubhealthrep00160-0005.pdf
The homicide rate in these United States saw a YUUUGE spike in the 1910s-1920s & then dropped substantially in the 1930s. During those Roaring Twenties, it was substantially higher than it has been over the last few years. During the 1950s it was lower than it has been the last few years, just some food for thought.
Some things have not changed: “The upward trend for homicide victims from 1960 to 1974 is the primary focus of this report. This trend is kept in perspective by a comparison of recent homicide rates with the rates for earlier years. Some data concerning persons arrested for homicide and circumstances concerning the violent deaths, supplied by the Federal Bureau of Investigation, are also presented. In 1973, 20,465 men, women, and children lost their lives from injuries inflicted by another person or persons with intent to injure or kill (table 1). This figure gives a homicide rate of 9.8 deaths per 100,000 for 1973, the highest ever recorded for the nation. The next highest rate occurred more than 40 years ago in 1933 when the rate reached 9.7 deaths per 100,000 (fig. 1). Provisional data for 1974 show that homicide is still at a high level. It is estimated that the rate for 1974 was at least 9.8 deaths per 100,000, with 20,770 victims of homicide.” […]
“The category "white" includes, in addition to persons reported as white, persons reported to be Mexican or Puerto Rican. The categories "races other than white" and "all other" consist of persons reported as Negro, American Indian, Chinese, and Japanese; other numerically small racial groups; and persons of mixed white and other races. The Bureau of the Census reports that in 1973 about 26,802,000 of the 209,851,000 people in the United States (or 13 percent) belonged to "races other than white." Of the 26,802,000 people, about 23,801,000 (or 89 percent) belonged to the Negro race.”
“For each of the four color-sex groups, the homicide rates declined slowly through the last half of the 1940s and through the 1950s, but the rates turned upward again at the beginning of the 1960s. The upward trend continued through 1973 for three of the four color-sex groups-white males, white females, and females of other races but not for males of other races. For males
other than white, the rate of increase in homicides decelerated from the middle of the 1960s until about 1971, and then the rate turned downward-from 70.1 homicides per 100,000 for 1972 to 65.8 for 1973. The effect on the total homicide rate of this striking downturn in the rate for males of other races, however, was more than offset by the accelerated rise in the rate for the white population. For white persons, the homicide rate rose from 4.9 deaths per 100,000 for 1972 to 5.5 for 1973-representing an increase of more than 1,000 deaths-from 8,976 deaths for 1972 to 9,986 for 1973. The pattern of the trends for age-adjusted death rates for each of the four color-sex groups is similar to the pattern for the unadjusted rates for these four groups (fig. 3, table 2). As measured by age-adjusted death rates, the relative increase of 101.9 percent in the total
homicide rate between 1960 and 1973 reflects the following increases for the four color-sex groups: white male, 123.1 percent; other male, 71.7 percent; white female, 86.7 percent; and other female, 42.9 percent (fig. 3). Despite the larger relative increase in the age-adjusted
homicide rate for white persons, the 1973 rate for other persons was still 7.8 times the corresponding rate for white persons.” […]
“An examination of the mortality pattern for age specific homicide rates for each year from 1933 to 1973 (beginning with the first year that all of the first 48 States were in the death registration area) shows that-with few exceptions for any given year-for each of the four color-sex groups the age group 25-34 had a considerably higher death rate than any other age group. This pattern holds both for years in periods when homicide rates fell and for years in periods when the rates rose.” […]
“Firearms, especially handguns, are the primary means of homicide. According to information on the death certificates of the victims, the percentage of homicides committed by means of firearms and explosives rose from 54.7 in 1960 to 67.2 in 1973-an increase from 4,627 such homicides for 1960 to 13,572 for 1973. (For 1973, the Federal Bureau of Investigation ((1) estimated that 53 percent of the homicides were committed with handguns and about 14 percent with shotguns and other firearms.) On the other hand, information on the death certificates
shows that the percentage of homicides committed with cutting and piercing instruments (especially knives) dropped from 21.7 in 1960 to 15.9 in 1973. This percentage decrease, however, does not reflect an actual decrease in the number of homicides committed with cutting and piercing instruments because the number increased from 1,816 in 1960 to 3,254 in 1973. Rather, the decrease in the percentage is largely a result of the relatively greater increase during 1960-73 in the use of handguns and other firearms and explosives to commit homicide… Other means of injury, including homicidal brawl, poisoning, drowning, and pushing from high places, accounted for about 20 percent of the homicides in 1960, but for only 14.8 percent of such deaths in 1973. Again, the percentage decrease does not reflect an actual decrease in the number of homicides committed in these ways-the number increased from 1,700 in 1960 to 3,083 in 1973.” […]
When all means of injury are considered, there are still more suicides in the United States (25,118 in 1973) than there are homicides (20,465 in 1973). But the gap between the two types of violent death is closing rapidly. Whereas in 1973 more than half of the victims of homicide were among persons of races other than white, about 93 percent of the suicides were among white persons… In 1973 the victims of felony-type murder were 62 percent white, 37 percent Negro, and the remaining 1 percent of other race or race not reported. [NOTE: Take a gander at Tables 7 & 8 that look at homicide rates by region & then a table of homicide rates in the larges U.S. cities. A lot of the usual suspects from today are on that list]
You want more, eh?
“Most of the decline in homicides among the nonwhite population occurred to nonwhite males (fig. 2), From 46 deaths per 100,000 in 1950, their rate fell to 34 in 1961, a decrease of 26 percent in 12 years. The level was still more than seven times the national average… Over half the homicides were by firearms and explosives. Nearly one-fifth of the deaths were classified in the residual category “assault by other means” where the methods of homicide are not tabulated separately (table F) Among the many titles included in this category are homicides from strangulations, fights, and assault by unspecified or other means which cannot be classified in categories E980-E982. Females and white persons had proportionately twice as many homicides in this category as males and nonwhite persons, respectively. On the other hand, nonwhite persons showed almost twice as high a percentage of deaths from cuttings and stabbings as did white victims… In1964 the rates for firearms and explosives and from cutting and stabbing wounds were greater for the nonwhite population than for the white, 8 and 16 times greater, respectively. For ages 25-44, these rates were 10 times greater for firearms and explosives and more than20 times greater for cutting and stabbing wounds.”
Young, dysfunctional (usually nonwhite) men (with or without Roe) tend to be the folks getting murdered disproportionately, even back in the 1930-1960s. They also tend to be the perpetrators of these heinous crimes & the only thing that has changed is over the past ~25 years is the U.S. has enjoyed a homicide rate those who lived in the 1910s-1930s & 1970s-1980s would’ve loved to have.
I surmise if the FBI or CDC published detailed data (such as the FBI’s current “Expanded Homicide Data”) pertaining to the race & gender of the assailant, we would see little has changed, except the U.S. homicide rate has fluctuated massively over the past century.
This concludes my rebuttal to Black Hawk County, Iowa Supervisor Chris Schwartz, may his parroted, uneducated, sophomoronic talking points RIP. Mr. Chairman, I Yield Back.
*** Chrissy shrieks. “We are not safe anywhere.” Speak for yourself Hobbit. Waterloo is one of the most dangerous places in Iowa, has been for a long time & it sits in the County you live in. Quit projecting the immoral, disgusting culture in that city onto white, rural Iowa where we don’t find a body riddled w/ stab wounds and/or gunshots every month or so. ‘
Granted, Waterloo is uber-safe compared to other Democrat-leaning cities outside of Iowa, but as far as Iowa goes, Waterloo is not safe.
Here’s a rundown of counties for various years (as far as I want to go w/ this & depending on if 2021 reports are out) that had ZERO homicides.
Pennsylvania https://www.ucr.pa.gov/PAUCRSPUBLIC/Home/Index
The following PA counties had ZERO cases of Murder/Non-Negligent Manslaughter in 2021: Cameron, Clinton, Centre, Wyoming, Wayne, Union, Tioga, Sullivan, Snyder, Montour, Juniata, Jefferson, Huntingdon, Greene, Fulton, & Forest.
That’s 23.88% (16) of PA’s 67 counties had zero homicides in 2021. They had a population of 592,213 – 4.56% of PA’s total population in 2021.
Donald Trump won 14 of those 16 (87.5%) counties with ≥60% of the vote in 2020.
The following PA counties had ZERO cases of Murder/Non-Negligent Manslaughter in 2020: Armstrong, Bedford, Bradford, Cameron, Centre, Columbia, Forest, Fulton, Greene, Huntingdon, McKean, Mifflin, Union, Wayne & Wyoming.
That’s 22.38% (15) of PA’s 67 counties w/ zero homicides in 2020.
How about Minnesota https://dps.mn.gov/divisions/bca/bca-divisions/mnjis/Pages/uniform-crime-reports.aspx https://www.cde.state.mn.us/
https://dps.mn.gov/divisions/bca/bca-divisions/mnjis/Documents/2020UCR-county_all_offense_data.pdf
Counties in MN that had ZERO homicides for 2020 – those were: Aitken, Becker, Benton, Big Stone, Brown, Carver, Cass, Chippewa, Chisago, Clearwater, Cook, Cottonwood, Crow Wing, Dodge, Douglas, Faribault, Fillmore, Freeborn, Grant, Houston, Hubbard, Isanti, Itasca, Jackson, Kanabec, Kandiyohi, Kittson, Koochiching, Lac qui Parle, Lake, Lake of the Woods, Le Sueur, Lincoln, Lyon, Mahnomen, Marshall, Martin, McLeod, Meeker, Morrison, Murray, Nicollet, Nobles, Norman, Pennington, Pipestone, Polk, Pope, Red Lake, Redwood, Rice, Rock, Sibley, Stevens, Swift, Traverse, Wabasha, Wadena, Waseca, Watonwan, Wilkin, Wright & Yellow Medicine.
That’s 72.41% (63 of 87) of MN’s counties & they had 25.75% of the MN population (1,469,474).
Donald Trump won 77.77% (49 of 63) of those counties in the 2020 election ≥60% of the vote.
Counties in MN that had ZERO homicides in 2021 – those were: Aitken, Becker, Benton, Big Stone, Brown, Cass, Chippewa, Clearwater, Cook, Cottonwood, Dodge, Douglas, Faribault, Fillmore, Freeborn, Goodhue, Grant, Houston, Hubbard, Itasca, Jackson, Kanabec, Kandiyohi, Kittson, Koochiching, Lac qui Parle, Lake, Lincoln, Lyon, Mahnomen, Marshall, Martin, McLeod, Mille Lacs, Murray, Nicollet, Nobles, Norman, Otter Tail, Pennington, Pine, Pipestone, Polk, Pope, Red Lake, Redwood, Rock, Roseau, Sherburne, Sibley, Steele, Stevens, Swift, Traverse, Wadena, Waseca, Watonwan, Wilkin & Yellow Medicine. https://cde.state.mn.us/DownloadData/OffenseCountyMunicipalByCountyDownload
That’s 67.81% (59 of 87) of MN’s counties had ZERO homicides in 2021. Whoops!
How about Michigan? https://www.michigan.gov/msp/divisions/cjic/micr/annual-reports https://www.michigan.gov/msp/-/media/Project/Websites/msp/micr-assets/2021/Offenses-by-County-and-Agency_2021.xlsx
Counties in MI that had ZERO murders/non-negligent manslaughter events in 2021 (make sure you read the notes): Alcona, Alger, Antrim, Baraga, Benzie, Charlevoix, Cheboygan, Crawford, Delta, Dickinson, Emmet, Gladwin, Hillsdale, Houghton, Huron, Iron, Kalkaska, Keweenaw, Lake, Leelanau, Mason, Mecosta, Menominee, Midland, Montmorency, Newaygo, Oceana, Ogemaw, Ontonagon, Osceola, Oscoda, Otsego, Presque Isle, Roscommon, Schoolcraft, Shiawassee & Wexford.
37 of MI’s 83 counties (44.57%) had ZERO murders in 2021.
Counties in MI that had ZERO murders/non-negligent manslaughter events in 2020: Alcona, Alger, Antrim, Arenac, Baraga, Barry, Cass, Clare, Clinton, Crawford, Delta, Dickinson, Gladwin, Gogebic, Grand Traverse, Gratiot, Houghton, Iosco, Iron, Kalkaska, Keweenaw, Lake, Lapeer, Leelanau, Luce, Mackinac, Marquette, Mason, Mecosta, Menominee, Missaukee, Monroe, Montmorency, Newaygo, Oceana, Ogemaw, Ontonagon, Osceola, Oscoda, Sanilac, Shiawassee & Tuscola.
42 of MI’s 83 counties (50.6%) had zero homicides (2020) & that was 13.98% of the state population (1,409,262).
Donald Trump won 32 of those 42 (76.19%) counties ≥60% of the vote in 2020.
How about Wisconsin? https://www.doj.state.wi.us/dles/bjia/ucr-offense-data Counties that had ZERO homicides (or murder/non-negligent manslaughter if you prefer) in 2021: Adams, Barron, Bayfield, Calumet, Clark, Dodge, Door, Douglas, Florence, Forest, Green Lake, Iron, Jackson, Kewaunee, Lafayette, Langlade, Lincoln, Marquette, Menominee, Pepin, Pierce, Price, Richland, Sauk, Shawano, St. Croix, Trempealeau, Vernon, Vilas, Walworth, Washburn & Waushara.
32 of 72 counties in WI (44.44%) counties had ZERO homicides in 2021. They were 17.25% of the state’s population (1,017,265).
Donald Trump won 18 of those 32 counties (56.25%) ≥60% of the vote in 2020.
How about Oklahoma? https://osbi.ok.gov/publications/crime-statistics https://osbi.ok.gov/file/10091/download?token=8SuW41G8
Counties in Oklahoma that had ZERO homicides in 2020: Alfalfa, Atoka, Beaver, Blaine, Caddo, Carter, Cimarron, Coal, Cotton, Craig, Ellis, Grant, Greer, Harmon, Harper, Haskell, Hughes, Jefferson, Kingfisher, Kiowa, Latimer, Love, Major, Marshall, Mayes, Murray, Noble, Pawnee, Payne, Pushmataha, Roger Mills, Sequoyah, Tillman, Woods & Washita.
35 of OK’s 77 counties (45.45%) had zero homicides in 2020.
Counties in Oklahoma that had ZERO homicides in 2019: Alfalfa, Atoka, Beaver, Beckham, Blaine, Caddo, Cimarron, Coal, Cotton, Craig, Delaware, Dewey, Ellis, Garvin, Grant, Greer, Harmon, Harper, Haskell, Hughes, Jefferson, Kay, Kingfisher, Kiowa, Latimer, LeFlore, Love, McIntosh, Major, Nowata, Ottawa, Pawnee, Pushmataha, Roger Mills, Texas, Tillman, Woods, Woodward & Washita.
39 of OK’s 77 counties (50.64%) had zero homicides in 2019, they were 13.76% (544,851) of the state’s population.
Donald Trump won 39 of those 39 counties (100%) in 2020 w/ ≥60% of the vote.
How about Montana? https://web.archive.org/web/20221023204720/https://dataportal.mt.gov/t/MBCC/views/CIM-ViolentCrime/Dash_ViolentCrime_StatsbyCounty?iframeSizedToWindow=true&%3Aembed=y&%3AshowAppBanner=false&%3Adisplay_count=n&%3AshowVizHome=n&%3Aorigin=viz_share_link
Counties in MT that had ZERO murders/non-negligent manslaughter offenses in 2021 (again, when I say “homicide” I mean “murder/non-negligent manslaughter”): Beaverhead, Big Horn, Broadwater, Carbon, Carter, Custer, Dawson, Deer Lodge, Fergus, Hill, Jefferson, Lewis and Clark, Liberty, Lincoln, Madison, Musselshell, Powell, Richland, Rosebud, Sanders, Sweet Grass, Toole, Valley, Judith Basin, Golden Valley, Chouteau, Daniels, Granite, McCone, Meagher, Mineral, Phillips, Pondera, Powder River, Prairie, Stillwater, Treasure, Wheatland & Wibaux.
That’s 39 of MT’s 56 (69.64%) counties had zero homicides in 2021.
Counties in MT that had ZERO murders/non-negligent manslaughter offenses in 2020: Big Horn, Broadwater, Carbon, Carter, Cascade, Custer, Dawson, Deer Lodge, Jefferson, Liberty, Lincoln, Musselshell, Park, Petroleum, Powell, Richland, Rosebud, Sanders, Silver Bow, Sweet Grass, Teton, Toole, Valley, Judith Basin, Golden Valley, Chouteau, Daniels, Granite, McCone, Meagher, Mineral, Phillips, Pondera, Powder River, Prairie, Stillwater, Treasure, Wheatland & Wibaux.
That’s also 39 of MT’s 56 (69.64%) counties had zero homicides in 2020. Those counties were (346,848) 31.99% of MT’s population.
Donald Trump won 34 of those 39 counties (87.17%) in the 2020 election w/ ≥60% of the vote. Be careful when tabulating MT’s data, it will de facto exclude listing counties that had NO HOMICIDES in the time frame you select, so you have to make sure you look at the right side of their interactive board & count counties not listed!
How about Utah? https://bci.utah.gov/utah-crime-statistics/
Counties in UT that had zero homicides in 2020: Beaver, Box Elder, Carbon, Emery, Garfield (the previous two agencies submitted no data, I presume due to their rural nature & no data submission they had ZERO murders), Morgan, Piute, Rich, San Juan, Sanpete, Sevier, Summit, Wasatch & Wayne.
That’s 48.27% (14 of 29) of UT counties w/ ZERO homicides in 2020.
Counties in UT that had zero homicides in 2019: Beaver, Carbon, Dagget, Emery, Garfield, Grand, Iron, Juab, Kane, Morgan, Piute, Rich, San Juan, Sanpete, Sevier, Summit, Uintah, Wasatch & Wayne.
65.51% (19 of 29) of UT counties had zero homicides in 2019. They had 10.17% of the population (326,316).
Donald Trump won 16 of those 19 counties (84.21%) in the 2020 election w/ ≥60% of the vote.
Let’s look at New York state https://www.criminaljustice.ny.gov/crimnet/ojsa/stats.htm https://www.criminaljustice.ny.gov/crimnet/ojsa/indexcrimes/county_totals.htm
Counties in NY that had zero homicides (2021): Chenango, Delaware, Franklin, Hamilton, Lewis, Livingston, Madison, Orleans, Otsego, Putnam, Schuyler, Tioga, Warren, Wyoming & Yates.
15 of 62 (24.19%) NY counties had zero homicides in 2021.
Counties in NY that had zero homicides (2020): Essex, Franklin, Genesee, Greene, Hamilton, Lewis, Livingston, Orleans, Oswego, Otsego, Putnam, Schoharie, Schuyler, Tioga, Tompkins, Warren, Washington & Wyoming.
18 of 62 (29.03%) NY counties had zero homicides in 2020. They were 4.79% (968,215) of the state population.
Donald Trump won 6 of those 18 counties (33.33%) in the 2020 election w/ ≥60% of the vote.
How about Oregon?
https://www.oregon.gov/osp/Pages/Uniform-Crime-Reporting-Data.aspx
As far as I can see Tillamook, Columbia, Lincoln, Polk, Curry, Hood River, Wasco, Sherman, Gilliam, Morrow, Harney, Grant, Crook, Wheeler & Wallowa had zero homicides in 2020.
15 of OR’s 36 counties (41.66%) had zero homicides (2020). They had 8.4% (356,259) of the state population.
Donald Trump won 8 of those 15 counties (53.33%) in the 2020 election w/ ≥60% of the vote.
For 2021: Clatsop, Curry, Wallowa, Union, Baker, Grant, Morrow, Gilliam, Hood River, Wasco, Lake, Harney, Crook, Wheeler & Jefferson had zero homicides.
15 of OR’s 36 counties (41.66%) had zero homicides (2021).
How about the great state of Maine? https://www.maine.gov/dps/msp/about/maine-crime https://www.maine.gov/dps/msp/sites/maine.gov.dps.msp/files/inline-files/Crime%20in%20Maine%202020.pdf
The following counties in ME had zero homicides in 2020: Aroostook, Franklin, Hancock, Knox, Lincoln, Oxford, Sagadahoc, Somerset, Waldo, Washington & York.
68.75% (11 of 16) of ME’s counties had zero homicides in 2020, equaling 48.11% (655,510) of the state population.
Donald Trump won 1 of those 11 counties (9.09%) in the 2020 election w/ ≥60% of the vote.
The following counties in ME had zero homicides in 2019: Franklin, Hancock, Knox, Lincoln, Piscataquis, Somerset, Waldo & Washington.
50% of ME’s counties (8 of 16) had zero homicides (2019). If you’re wondering why ME is such a safe place, look up its demographics & then look at their Constitutional Carry law. That’s likely why there are not shootouts in ME every weekend.
There are not massive “homicide increases everywhere” as some idiots say. Rural, white counties are not the problem, capiche?
How about Florida? https://www.fdle.state.fl.us/CJAB/UCR/Annual-Reports https://www.fdle.state.fl.us/CJAB/UCR/UCR/2020/Annual/Statewide_County_2020A.aspx
Counties in FL that had ZERO criminal homicides in 2020: Flagler, Franklin, Gilchrist, Glades, Gulf, Jefferson, Lafayette & Liberty.
8 of 67 (11.94%) FL counties had zero homicides in 2020.
Counties in FL that had ZERO criminal homicides in 2019: Baker, Franklin, Gilchrist, Glades, Jackson, Lafayette, Madison, Taylor, Union, Wakulla & Washington.
11 of 67 (16.41%) FL counties had zero homicides in 2019. They had 1.13% (243,075) of the state population.
Donald Trump won 10 of those 11 counties (90.9%) in the 2020 election w/ ≥60% of the vote.
How about Arkansas? https://www.dps.arkansas.gov/crime-info-support/arkansas-crime-information-center/crime-statistics/
In 2021, the following counties had ZERO homicides: Calhoun, Clay, Cleburne, Cleveland, Conway, Crawford, Dallas, Faulkner, Franklin, Grant, Greene, Hempstead, Izard, Jackson, Lafayette, Lawrence, Lee, Lincoln, Nevada, Perry, Pike, Polk, Randolph, Searcy, Sharp, Van Buren, Woodruff & Yell.
Of AR’s 75 counties, (28) 37.33% had no homicides in 2021. Those counties were 18.97% (574,294) of the state population.
Donald Trump won 26 of those 28 (92.85%) counties in the 2020 election w/ ≥60% of the vote.
In 2020, the following counties had ZERO homicides: Calhoun, Clark, Clay, Cleveland, Conway, Crawford, Cross, Dallas, Grant, Izard, Lafayette, Lincoln, Logan, Madison, Perry, Pike, Polk, Prairie, Saline, Searcy, Sevier, Stone, Van Buren & Woodruff.
Of AR’s 75 counties (24) 32% had zero homicides in 2020.
How about Missouri? https://showmecrime.mo.gov/public/ (Select “SRS Crime Rates by County” then “Summary Offense” then “Murder and Nonnegligent Homicide” & lastly “Show Report. You can also use the “NIBRS Reports”, which are more thorough. I compared BOTH and I was glad I did because some NIBRS reports had zero homicides & the SRS reports did not. In that case, I eliminated that county)
MO counties w/ ZERO homicides in 2021: Cole, Franklin, Gasconade, Grundy, Howard, Howell, Miller, Perry, Ripley, Sainte Genevieve, Shannon, Stone, Wayne, Webster & Wright.
13.04% (15 of 115) of MO counties had zero homicides in 2021.
[NOTE: St. Louis City is an “Independent City” & thus MO technically has 115 counties]
MO counties w/ ZERO homicides in 2020: Bollinger, Butler, Caldwell, Camden, Carter, Cedar, Dade, Grundy, Laclede, Lincoln, Miller, Oregon, Perry, Randolph, Ray, Saint Francois, Sainte Genevieve, Sullivan, Vernon, Warren, Webster & Wright.
19.13% (only 22 of 115) of MO counties had zero homicides in 2020. They were 8.78% (540,736) of the state population. It was a rough 2 years in the Show Me State.
Donald Trump won all 22 of those counties (100%) in the 2020 election w/ ≥60% of the vote.
What about Washington? https://www.waspc.org/crime-statistics-reports
https://www.waspc.org/assets/CJIS/2021%20CIW.pdf
Counties in WA that had zero homicides in 2021: Clallam, Columbia, Douglas, Ferry, Garfield, Kittitas, Lincoln, Okanogan, Pacific, Pend Oreille, San Juan & Wahkiakum.
Of WA’s 39 counties (12) 30.76% had zero homicides in 2021.
Counties in WA that had zero homicides in 2020: Asotin, Columbia, Douglas, Ferry, Garfield, Island, Klickitat, Lincoln, Pacific, San Juan, Skamania, Wahkiakum & Whitman.
Of WA’s 39 counties (13) 33.33% had zero homicides in 2020. They had 3.95% (304,691) of the state’s population.
Donald Trump won 6 of those 13 (46.15%) counties in the 2020 election w/ ≥60% of the vote.
How about California? https://oag.ca.gov/crime https://data-openjustice.doj.ca.gov/sites/default/files/2022-08/Homicide%20In%20CA%202021.pdf (See “Understanding the Data” notes)
Counties in CA that had zero homicides in 2021: Alpine, Colusa, Glenn, Inyo, Lassen, Modoc, Napa, Plumas, Shasta & Sierra.
10 of CA’s 58 counties (17.241%) had zero homicides in 2021. They had 1.15% (454,291) of the state population.
Donald Trump won 4 of those 10 (40%) counties in the 2020 election w/ ≥60% of the vote.
Counties in CA that had zero homicides in 2020: Alpine, Calaveras, El Dorado, Lassen, Mariposa & Sierra.
6 of CA’s 58 counties (10.34%) had zero homicides in 2020.
How about Illinois? https://isp.illinois.gov/CrimeReporting/CrimeInIllinoisReports https://isp.illinois.gov/StaticFiles/docs/CrimeReporting/cii/cii20/Index%20Crime.pdf
Illinois counties w/ no homicides 2020: Adams, Alexander, Bond, Boone, Brown, Carroll, Cass, Christian, Clay, Clinton, Coles, Crawford, Cumberland, DeWitt, Douglas, Edgar, Edwards, Effingham, Fayette, Ford, Franklin, Gallatin, Greene, Hamilton, Henderson, Henry, Iroquois, Jasper, Jefferson, Jersey, Jo Daviess, Johnson, LaSalle, Lawrence, Lee, Livingston, Logan, Macoupin, Marion, Marshall, Mason, Massac, McDonough, Menard, Monroe, Morgan, Moultrie, Perry, Piatt, Pike, Putnam, Randolph, Richland, Saline, Schuyler, Scott, Shelby, Stark, Union, Warren, Washington, Wayne, White & Woodford.
64 of IL’s 102 counties (62.74%) had ZERO homicides in 2020. They had 11.41% (1,461,995) of the state’s population.
Donald Trump won 58 of those 64 (90.62%) counties in the 2020 election w/ ≥60% of the vote.
Illinois counties w/ no homicides in 2019: Alexander, Boone, Brown, Carroll, Cass, Clark, Clay, Clinton, Crawford, Cumberland, DeWitt, Douglas, Edgar, Edwards, Effingham, Fayette, Ford, Franklin, Fulton, Gallatin, Greene, Hamilton, Hancock, Hardin, Henderson, Jasper, Jersey, Jo Daviess, Johnson, Knox, Lawrence, Livingston, Logan, Macoupin, Marshall, Mason, Massac, McDonough, Menard, Mercer, Moultrie, Perry, Piatt, Putnam, Randolph, Richland, Schuyler, Scott, Shelby, Stark, Union, Wabash, Warren, Washington, Wayne & White.
56 of IL’s 102 counties (54.9%) had ZERO homicides in 2019.
[NOTE: Calhoun County, Pulaski County & Pope County, while very small did not report any data 2020-2017, so I am not going to include them. Hardin had no data 2020 & 2019 but had data the previous two years & one homicide. I will include them in 2019, but not 2020]
Let’s keep this train rolling, how about South Carolina? https://www.sled.sc.gov/crimestatistics https://www.sled.sc.gov/forms/statistics/2020%20Crime%20in%20South%20Carolina.pdf
Counties in SC that had ZERO homicides (2020): Abbeville, Edgefield, Hampton & McCormick.
Of SC’s 46 counties, only 8.69% (4) had zero homicides. Those counties had 78,392 people & were 1.53% of SC’s population.
Donald Trump won 2 of those 4 (50%) counties in the 2020 election w/ ≥60% of the vote.
Counties in SC that had ZERO homicides (2019): Calhoun, Edgefield, McCormick & Saluda.
Of SC’s 46 counties, only 8.69% (4) had zero homicides.
How about New Hampshire? https://crimestats.dos.nh.gov/public/View/dispview.aspx?ReportId=2
Counties in NH that had zero homicides (2021): Belknap, Carroll, Coos, Strafford & Sullivan.
Of NH’s 10 counties, (5) 50% had zero homicides in 2021. Those counties had a population of 323,198 & that was 23.26% of the population.
Donald Trump won 0 of those 5 (0%) counties in the 2020 election w/ ≥60% of the vote.
Counties in NH that had zero homicides (2020): Coos, Grafton, Merrimack & Sullivan.
Of NH’s 10 counties, (4) 40% had zero homicides in 2020.
How about Iowa? https://icrime.dps.state.ia.us/CrimeInIowa/Report/CrimeDensityReports
In 2021, here are the counties in Iowa that ZERO occurrences of “Murder and Nonnegligent Manslaughter” (make sure you select that): Adams, Allamakee, Appanoose, Audubon, Boone, Bremer, Buchanan, Buena Vista, Butler, Calhoun, Carroll, Cass, Cedar, Cherokee, Chickasaw, Clarke, Clay, Clayton, Crawford, Dallas, Davis, Decatur, Dickinson, Fayette, Franklin, Freemont, Greene, Guthrie, Hamilton, Hancock, Harrison, Henry, Howard, Humboldt, Ida, Iowa, Jackson, Keokuk, Louisa, Lucas, Lyon, Madison, Mahaska, Marion, Mills, Mitchell, Monona, Monroe, Muscatine, O'Brien, Osceola, Page, Palo Alto, Plymouth, Pocahontas, Poweshiek, Ringgold, Sac, Shelby, Sioux, Taylor, Union, Van Buren, Warren, Washington, Wayne, Winnebago, Winneshiek & Worth.
69.69% (69) of Iowa’s 99 counties had ZERO homicides in 2021. What is this “we are not safe anywhere” crap? Sounds like someone has brain damage. Quit projecting the behavior of your fatherless, hood rat voters onto the entire nation.
In 2020, these Iowa counties had ZERO cases of “Murder and Nonnegligent Manslaughter”: Adair, Adams, Allamakee, Appanoose, Audubon, Benton, Boone, Bremer, Buchanan, Buena Vista, Butler, Calhoun, Carroll, Cass, Cerro Gordo, Cherokee, Chickasaw, Clarke, Clay, Clayton, Crawford, Davis, Decatur, Delaware, Dickinson, Emmet, Fayette, Floyd, Franklin, Fremont, Greene, Grundy, Guthrie, Hamilton, Hancock, Hardin, Henry, Howard, Humboldt, Ida, Iowa, Jackson, Jasper, Jefferson, Jones, Keokuk, Kossuth, Lee, Louisa, Lucas, Lyon, Mills, Mitchell, Monona, Monroe, Montgomery, Muscatine, O'Brien, Osceola, Page, Pocahontas, Pottawattamie, Ringgold, Sac, Shelby, Tama, Union, Van Buren, Wapello, Washington, Wayne, Winnebago, Winneshiek, Worth & Wright.
That’s (75) 75.75% of Iowa’s 99 counties with ZERO Murders in 2020. Those counties had a collective population of 1,296,281 & that was 40.63% of the entire IA population.
Donald Trump won 61 of those 75 (81.33%) of those counties in the 2020 election w/ ≥60% of the vote.
How about Massachusetts? https://masscrime.chs.state.ma.us/public/View/dispview.aspx?ReportId=678 (Select all 14 counties in “Jurisdiction by Geography” & then “Summary Date” select your years (in this case, 2021 & 2020) & lastly “Summary Offense” should include “Murder and Nonnegligent Homicide” under the “Criminal Homicide” dropdown menu. DO NOT include “Manslaughter by Negligence”)
Counties in MA that had zero homicides in 2021: Dukes, Franklin & Nantucket.
Counties in MA that had zero homicides in 2020: Dukes, Franklin & Nantucket.
For 2021 & 2020, MA had 3 of its 14 counties (21.42%) w/ ZERO homicides. Those counties were (106,603) 1.52% of the MA population in 2021.
Donald Trump won NONE of those (0%) counties in the 2020 election w/ ≥60% of the vote.
How about Maryland? https://mdsp.maryland.gov/Document%20Downloads/Crime%20In%20Maryland%202020%20Uniform%20Crime%20Report.pdf
Counties in MD that had zero homicides 2020: Caroline, Kent, Queen Anne’s, Somerset & Talbot.
5 of MD’s 24 counties (20.83%) had zero homicides in 2020.
Counties in MD that had zero homicides 2019: Allegany, Calvert, Garrett, Kent, Queen Anne’s & Worchester.
25% (6 of 24) of MD’s counties had zero homicides in 2019. Those entities were (314,034) 5.19 % of the MD population.
Donald Trump won 3 (50%) of those 6 counties in the 2020 election w/ ≥60% of the vote.
[NOTE: Baltimore City is an Independent City, a separate entity from Baltimore County]
Let’s look at New Jersey https://www.nj.gov/njsp/ucr/uniform-crime-reports.shtml https://www.nj.gov/njsp/ucr/pdf/current/2020_Uniform_Crime_Report.xlsx https://www.nj.gov/njsp/ucr/pdf/2019_Uniform_Crime_Report.xlsx
Counties in NJ that had zero homicides 2020: Cape May & Warren.
9.52% (2 of 21) of NJ’s counties had no homicides 2020
Counties in NJ that had no murders in 2019: Cape May & Sussex.
9.52% (2 of 21) of NJ’s counties had no homicides 2019. Those counties were (232,527) 2.61% of the entire NJ population.
Donald Trump won ZERO of those 2 counties (0%) in the 2020 election w/ ≥60% of the vote.
Since TX has SO MANY counties, I will only be covering 2020. https://www.dps.texas.gov/sites/default/files/documents/crimereports/20/2020chapter10b.xlsx
https://www.dps.texas.gov/section/crime-records/crime-texas
Counties in TX with ZERO murders 2020: Zapata, Yoakum, Winkler, Wilbarger, Wheeler, Ward, Uvalde, Upton, Tyler, Titus, Throckmorton, Terry, Terrell, Swisher, Sutton, Stonewall, Sterling, Stephens, Somervell, Sherman, Shackelford, Schleicher, San Jacinto, San Augustine, Rockwall, Roberts, Refugio, Real, Reagan, Rains, Presidio, Pecos, Parmer, Panola, Oldham, Ochiltree, Nolan, Motley, Morris, Moore, Montague, Mitchell, Mills, Milam, Menard, Mason, Martin, Marion, Madison, McMullen, McCulloch, Lynn, Loving, Llano, Live Oak, Lipscomb, Limestone, Leon, Lavaca, La Salle, Lampasas, Knox, Kinney, King, Kent, Kenedy, Kendall, Karnes, Jim Hogg, Jeff Davis, Jackson, Jack, Irion, Hutchinson, Hudspeth, Houston, Hemphill, Haskell, Hartley, Hardeman, Hansford, Hamilton, Hall, Guadalupe, Grimes, Gray, Goliad, Glasscock, Gillespie, Garza, Gaines, Freestone, Franklin, Foard, Floyd, Fisher, Fayette, Fannin, Falls, Erath, Edwards, Duval, Donley, Dimmit, Dickens, DeWitt, Delta, Deaf Smith, Dawson, Culberson, Crosby, Crane, Cottle (did not report data, but including them), Concho, Collingsworth, Coleman, Coke, Cochran, Clay, Childress, Castro, Carson, Camp, Callahan, Burleson, Brown, Brooks, Briscoe, Brewster, Borden, Bee, Baylor, Bandera, Bailey, Armstrong & Archer.
Of TX’s 254 counties, (136) 53.54% of them had ZERO murders in 2020. Those counties were (1,644,368) 5.64% of the entire TX population.
Donald Trump won 129 of those 136 counties (94.85%) in the 2020 election w/ ≥60% of the vote.
How about Idaho? https://nibrs.isp.idaho.gov/CrimeInIdaho/Report/CrimeDensityReports (Select “Year” & then “Murder and Nonnegligent Manslaughter”)
Counties in ID that had ZERO homicides in 2021: Adams, Bear Lake, Benewah, Bingham, Blaine, Boise, Boundary, Butte, Camas, Caribou, Cassia, Clark, Custer, Elmore, Franklin, Gooding, Idaho, Jerome, Latah, Lemhi, Lincoln, Minidoka, Oneida, Owyhee, Payette, Power, Shoshone, Teton & Valley.
29 of ID’s 44 counties (65.9%) had zero homicides.
Counties in ID that had ZERO homicides in 2020: Bannock, Benewah, Boise, Butte, Camas, Caribou, Cassia, Clark, Clearwater, Custer, Franklin, Fremont, Gem, Gooding, Latah, Lemhi, Lewis, Lincoln, Madison, Minidoka, Oneida, Payette, Power, Shoshone, Teton, Valley & Washington.
27 of ID’s 44 counties (61.36%) had zero homicides. Those counties were (431,143) 23.44% of the entire ID population.
Donald Trump won 23 of those 27 (85.18%) counties in the 2020 election w/ ≥60% of the vote.
How about Arizona? https://www.azdps.gov/about/reports/crime http://www.azdps.gov/sites/default/files/media/FINAL_Crime%20in%20Arizona%202020.pdf http://www.azdps.gov/sites/default/files/media/FINAL_Crime%20in%20Arizona%202019.pdf
Counties in AZ that had ZERO homicides (2020): Apache, Graham, La Paz & Santa Cruz. 4 of AZ’s 15 counties (26.66%) had no homicides in 2020. Those counties had 2.36% (168,780) of AZ’s population.
Donald Trump won 2 (50%) of those 4 counties in 2020 w/ ≥60% of the vote.
Counties in AZ that had ZERO homicides (2019): Greenlee & Santa Cruz.
Combining all the above data (I did two years, depending on if they had 2021 reports out I did 2020 each time & either 2019 or 2021) & the year I selected from the two I examined we have (PA, MN, MI, WI, OK, MT, UT, NY, OR, ME, FL, AR, MO, WA, CA, IL, SC, NH, IA, MA, MD, NJ, TX, ID & AZ) 1,568 COUNTIES. That’s a pretty good sample size.
Some of these states are high homicide (IL, AR, MO, OK) & some are low homicide (IA, OR, ME, NH). Some vote Republican consistently & some vote Democrat. Some states are highly populated, some are not – some are densely populated (and even that varies a LOT by county, especially in TX) & some are not. This is a good sample size kids.
Of those 1,568 COUNTIES, 704 (44.89%) of them had ZERO occurrences of Murder/Nonnegligent Manslaughter. Donald Trump won 79.97% (563) of those counties w/ ZERO homicides in the 2020 election where he received ≥60% of the vote.
Extrapolating that out – there are 3,143 COUNTIES or county equivalents in these United States (St. Louis City & Philadelphia City are “independent cities” & thus considered a “County” for Census purposes, as are a number of “independent cities” in VA), that would mean in a given year in recent history, 1,411 (44.89%) of U.S. Counties have zero homicides.
Those 704 counties had a cumulative population of 15,860,621 for the years I selected (again, depending on if their 2021 report was done, it was 2019 & 2020 or 2020 & 2021). The states I selected (PA, MN, MI, WI, OK, MT, UT, NY, OR, ME, FL, AR, MO, WA, CA, IL, SC, NH, IA, MA, MD, NJ, TX, ID & AZ) had a collective population of (2020) 228,635,731 – that was 68.98% of the entire U.S. population.
6.93% of the fine folks living in those states lived in counties w/ no homicides. That means in any given year, almost 23 million people live in U.S. counties (44.89% of all counties) where there are no homicides.
I could’ve gone further & included counties w/ one homicide as there are numerous rural counties in America that have no homicides most years, but the occasional heinous crime is committed. All those counties would add cumulatively, millions & millions more to the grand total.
If I did that, the data would look much better, but I set a high bar.
Kind of blows up the “we are not safe anywhere” talking point, eh? Only some who is borderline retarded and/or trying to push a narrative would make up such a thing. You may be projecting the violent perpetrated by fatherless hood rats in your own county upon everyone else & I hate to tell you, but rural Iowa doesn’t have piles of dead bodies, replete w/ knife wounds & gunshots.
We leave that to places like Waterloo, Cedar Rapids, Des Moines & Davenport.
These totals https://crimeresearch.org/2017/04/number-murders-county-54-us-counties-2014-zero-murders-69-1-murder/ are much lower than in previous decades where ~70% of U.S. counties had zero murders in any given year & murders were even more concentrated & the homicide rate was much, much higher.
From 1987-2000, the U.S. homicide rate was much higher than 2001-2019 & in the former time frame fewer counties had homicides when compared to my recent data (the homicide rate 2018-2020 was much lower than 1987-2000). I am not saying America is doing great, we have seen massive homicide increases the last 3 years, but it’s not as bad as it has been.
The main reason (I concur w/ John Lott on this) homicides are creeping into less dense, more rural counties is drug abuse & a lack of fathers. Lott did not mention the latter, I did.
As I proved in my essays on homicide https://www.facebook.com/permalink.php?story_fbid=2909861932583537&id=1400591836843895 http://freewebs.com/professor_enigma/sam-seder-ilhan-omar-racism3 (and John Lott covers this too) the counties & cities in the U.S. that are doing the lion’s share of the homicide are a small portion of the entire U.S. population.
It’s ~10% of U.S. counties & cities where danger is around every corner, not rural, white counties won overwhelmingly by Republican candidates. These dangerous counties & cities are overwhelmingly won by the Dumocrat Party.
Some food for thought the next time you hear a mouth-breathing, overweight Democrat suggest that “we are not safe anywhere.” Speak for yourself fat boy!
BONUS ROUND: In 2016, 73 of Iowa’s 99 counties (73.73%) had zero homicides. The site does NOT make it easy to find out which counties had just one homicide, ergo – I did not add the counties w/ one homicide.
Of Utah’s 29 counties, 17 of them (58.62%) had no homicides in 2016. And additional 5 counties had ONE HOMICIDE in 2016.
In 2016, only 6 of California’s 58 counties (10.34%) had zero homicides. An additional 7 counties had one homicide.
39 of Michigan’s 83 counties (46.98%) had zero homicides in 2016. An additional 20 counties had ONE homicide.
https://isp.illinois.gov/StaticFiles/docs/CrimeReporting/cii/cii16/cii16_SectionI_Pg11_to_246.pdf Of Illinois’ 102 counties, 64 of them (62.74%) had zero homicides in 2016. An additional 17 counties had ONE HOMICIDE.
https://dps.mn.gov/divisions/bca/bca-divisions/mnjis/Documents/2016UCR-county_all_offense_data.pdf Of Minnesota’s 87 counties, 62 of them (71.26%) had ZERO homicides (2016). An additional 14 counties had ONE HOMICIDE.
Of Wisconsin’s 72 counties, 48 of them (66.66%) of them had ZERO homicides in 2017. An additional 13 counties had one homicide.
Of New York’s 62 counties, 14 (22.58%) of them had ZERO homicides in 2017. An additional 15 counties had one homicide in 2017.
Of Idaho’s 44 counties, 28 of them (63.63%) of them had ZERO homicides in 2016.
In Missouri, 51.3% (59 of 115) of its counties had ZERO homicides (2016). An additional 25 counties had one homicide.
In Montana, (41 of 56) 73.21% of its counties had ZERO murders (2016). As an aside, an additional 5 counties had one case of murder/nonnegligent manslaughter.
In Oklahoma, 41 of their 77 counties (53.24%) had ZERO murders in 2016. An additional 15 counties had ONE MURDER.
South Carolina has 46 counties, only 2 of them (4.34%) of them had ZERO homicides in 2016. As an aside, 7 counties had only one homicide.
https://www.nj.gov/njsp/ucr/2016/pdf/2016_sect_7.pdf New Jersey has 21 counties, 4 of them (19.04%) had ZERO homicides in 2016. One additional county had 1 homicide.
In New Hampshire (2016), one of their ten counties (10%) had zero homicides. An additional 5 counties had one homicide.
In Maine, 56.25% (9 of 16) of its counties had no homicides in 2016. One additional county had one homicide.
https://www.dps.texas.gov/crimereports/16/citCh10b.xlsx In Texas, 138 of its 254 counties (54.33%) had ZERO homicides (2016). 44 additional counties had ONE homicide.
The states above in the BONUS ROUND had collectively 1,231 COUNTIES & in the year I selected (some states did not have good data going back to 2016, so I chose 2017), 646 (52.47%) of those counties had ZERO homicides.
The states where I was able to find counties w/ one homicide had 1,088 COUNTIES collectively. 739 of those counties (67.92%) had fewer than two homicides.
The reason I bring that up again is because there are boatloads of rural counties in these United States <50,000 people & in a 5-year block of crime data they could have one homicide in two of those years & the other three have none.
When I was looking through TX’s 2016 data, one of their podunk counties had a homicide rate in the hundreds because they had 2 homicides that year. Most years they have zero.
There are a lot of those counties in these United States & it further demonstrates that the “We are not safe anywhere” talking point is only excreted by people who are trying to push a false narrative (crime is out of control) & using that narrative to try & take away firearms from rural areas (and everyone else for that matter) so the next time their lunatics riot (defunding the police or instituting a Ferguson Effect is also part of the Democrat #INSURRECTION) there is nobody around to stop them.
Letting lunatics loose from prison is also a Democrat priority – it is imperative that citizens be able to defend themselves from lunatics before the police arrive to whisk them away to the County Hilton.
The other reason an idiot might say, “Uh duh, we are not safe anywhere” is because they watch MSLSD or the local news too much & they’re a malleable idiot.
In any given year over half of counties (this has closed a bit in the last few years) in these United States have zero homicides & >2/3 of counties in these United States have fewer than two homicides.
The fact remains: The most dangerous counties & cities in America can be drilled down to 10% of the remaining counties (after omitting all those w/ fewer than two homicides), it’s not “everywhere.”
As John Lott did, the most dangerous counties usually have just one city that is doing most of the damage & you can narrow that down to a few districts or neighborhoods in that city. It’s not “everywhere.” I know this essay completely demolishes that talking point.
Missouri, Tennessee, Illinois & Delaware have high homicide rates, but it’s a few cities in those states perpetrating most of the violence, in >90% of the counties in those states you are as safe as a baby in its mother’s arms.
Yes, lightning can strike anywhere once, but how about year after year after year (Kansas City, Chicago, Baltimore, Wilmington, Detroit, Houston, Flint, Gary, Newark, Memphis, St. Louis, Jackson, Birmingham, Petersburg, Richmond, Compton, Albuquerque, Atlanta, Buffalo, Rochester) & over & over again?
It’s not uber-white rural counties won overwhelmingly by Donald Trump all over this great nation causing the (Democrat) crime wave.
If you find this information above worthy, pass it on & vote the Democrat bums out! Mr. Chairman, I Yield Back!
422
views

Divorcee Sam Seder parrots fallacious arguments (Oklahoma, California homicide)
Recently, the divorcee Sam Seder parroted on oft-repeated talking point concerning red state & blue state homicide rates. I've already ran those talking points through a wood chipper. Enjoy!
https://rumble.com/v1q2eez-joe-scarborough-joy-hofmeister-and-the-democrat-crime-wave.html http://freewebs.com/professor_enigma/covid-increase-homicides Read all my essays on the Democrat Crime Wave https://www.facebook.com/permalink.php?story_fbid=2909861932583537&id=1400591836843895
#samseder #majorityreport
Sam Seder #samsederwontdebateJPH is afraid to debate my friend James Patrick Holding on The Impossible Faith https://tektonics.org/lp/nowayjose.php Not sure if he has any confidence in that religion degree from a diploma mill
Brian Tyler Cohen & his blue state/red state homicide pap gets nuked https://rumble.com/v19hafa-brian-tyler-cohen-is-not-very-bright.html
The REAL #INSURRECTION is a Democrat #INSURRECTION
44
views
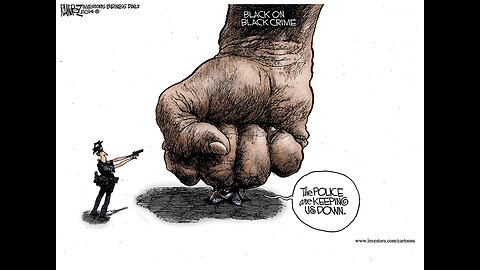
Joe Scarborough, Joy Hofmeister & The Democrat Crime Wave
My video debunking Brian Tyler Cohen’s red state blue state homicide pap https://rumble.com/v19hafa-brian-tyler-cohen-is-not-very-bright.html
https://osbi.ok.gov/publications/crime-statistics https://osbi.ok.gov/file/10091/download?token=8SuW41G8 https://osbi.ok.gov/file/4866/download?token=RE8dxp31
Oklahoma homicides 2018-2020 (Oklahoma State Bureau of Investigation) = 746
Oklahoma homicides 2015-17 (Oklahoma State Bureau of Investigation) = 726
Oklahoma homicides 2018-2020 (FBI) = 768 (6.433 per 100,000)
Oklahoma homicides 2015-17 (FBI) = 721 (6.133 per 100,000)
https://www.census.gov/quickfacts/fact/table/OK,oklahomacountyoklahoma,tulsacountyoklahoma/PST045221 According to the 2020 census, Tulsa County & Oklahoma County were 37% of the entire population of Oklahoma. Those 2 counties were 35.24% of the OK population according to the 2010 Census.
Tulsa County (72, 80, 65) & Oklahoma County (94, 84, 83) homicides 2015-17 = 478. Those counties had (using state data) 65.84% of all OK homicides. Those counties had a cumulative population of 4,280,910 (2015-17) & a homicide rate of 11.165 per 100,000.
Tulsa County (78, 63, 70) & Oklahoma County (90, 87, 60) homicides 2018-20 = 448. Those counties had (using state data) 60% of all OK homicides. Those counties had a cumulative population of 4,352,833 (2018-20) & a homicide rate of 10.292 per 100,000. Both time they were well above the state average.
I would ask Joy Hofmeister to look at this data, but she would have to pull her head out of her butt to do that.
https://uselectionatlas.org/RESULTS/ Donald Trump won Tulsa County comfortably in 2016 & 2020 but failed to hit 60%. Oklahoma County was much closer, Trump won both times, but in 2020 he did not even get 50%.
https://www.census.gov/quickfacts/fact/table/tulsacityoklahoma,oklahomacitycityoklahoma,OK/PST045221
Now let us look at data for Tulsa City & Oklahoma City. In 2020 those cities had 27.43% of the entire OK population, in 2010 it was 25.9%.
Tulsa City (72, 55, 60) & Oklahoma City (64, 72, 52) homicides 2018-20 = 375. Those cities had 50.26% of all OK homicides. Their homicide rate was (population 2018-2020 = 3,202,148) 11.710 per 100,000.
Tulsa City (70, 72, 56) & Oklahoma City (81, 70, 73) homicides 2015-17 = 422. Those cities had 58.12% of all OK homicides. Their homicide rate was (population 2015-17 = 3,128,777) 13.487 per 100,000. I used Census Bureau data for population totals.
Do you realize that from 2018-2020, OUTSIDE of Tulsa County & Oklahoma County, the state of Oklahoma had a homicide rate of 4.942 per 100,000. Granted, that is high, but still about 10% lower than the national average for those years.
You can see the problem areas in OK & it is largely 2 counties & 2 big cities inside those counties.
Here is some more uncomfortable data from Oklahoma in one of my previous essays http://freewebs.com/professor_enigma/covid-increase-homicides
From 2018-2020, Blacks were 34.3% of homicide victims in OK. From 2015-17 Blacks were victims of homicide 36.766% of the time. From 2018-2020, 39.3% of all those arrested in Oklahoma for murder were Black. For 2015-17 Blacks were 46.433% of those arrested for murder. Oklahoma is only 7.8% Black. Look up “disproportionate” in the dictionary kids.
Joy Hofmeister’s simplistic plea about homicide rates in Oklahoma is just that, simplistic idiocy that appeals to the basement-dwelling, I don’t have a job crowd. The devil is always in the details & I would accuse Joy of lying, but she’s running for Governor & she literally doesn’t know this.
These Dumocrats who just vomit forth homicide rates by state would not accept this argument: Nations that vote for Joe Biden have higher homicide rates than nations that vote for Donald Trump.
The homicide rates in the U.S. for 2021 & 2022 will undoubtedly be higher than when Donald Trump was in the White House 2017-2020. The Ritalin-addled Democrat will say, “Uh duh, you have to look at state data, because states are different, uh duh.”
What about counties, let’s look at county-level data instead & when you start to delve into county data you see (and this is the case in TN, MO, IL, KS, etc.) that there are a few bad apples in the bunch.
In TN, Shelby & Davidson counties are doing the lion’s share of the crime, outside those places there is a massive disparity in homicide. In KS it is two counties that typically vote Dumocrat. In Illinois it’s you guessed it, Chicago & East St. Louis. The very pro-Trump counties in IL have very low homicide rates.
In Missouri, it’s Kansas City & St. Louis City, which are full of black on black homicide. The very pro-Trump counties in MO have very low homicide rates.
You can look at county data & then drill down to city data as I have & then you can dowhat John Lott did, start drilling down to neighborhood data. Here is a small sample of what he said.
http://freewebs.com/professor_enigma/sam-seder-ilhan-omar-racism https://crimeresearch.org/2017/04/number-murders-county-54-us-counties-2014-zero-murders-69-1-murder/
https://www.facebook.com/permalink.php?story_fbid=2909861932583537&id=1400591836843895
“Murders actually used to be even more concentrated. From 1977 to 2000, on average 73 percent of counties in any given year had zero murders. Possibly, this change is a result of the opioid epidemic’s spread to more rural areas. But that question is beyond the scope of this study.”
“In 2014, the murder rate was 4.4 per 100,000 people. If the 1% of the counties with the worst number of murders somehow were to become a separate country, the murder rate in the rest of the US would have been only 3.4 in 2014. Removing the worst 2% or 5% would have reduced the US rate to just 3.06 or 2.56 per 100,000, respectively.”
So, even in today’s landscape where the homicide rate has spiked the last 3 years, the lion’s share of the homicide problem is still among a tenth of U.S. counties. It’s not white rural Iowa, Wyoming, Montana, most of NY state, most of Texas, most of Missouri, most of Illinois, Utah, etc.
It’s the Dumocrat enclaves that I have examined in my essays that collectively have homicide rates ~4X the national average. Continuing…
“When you look at individual counties with a high number of murders, you find large areas with few murders. Take Los Angeles County, with 526 murders in 2014, the most of any county in the US. The county has virtually no murders in the northwestern part of the county. There was only one murder each in Beverly Hills, Hawthorne, and Van Nuys. Clearly, different parts of the county face very different risks of murder.”
“The map [in Lott’s article] shows the distribution of murders in Indianapolis, with 135 murders. Although the city extends well beyond the 465 Highway that encircles downtown Indianapolis, there are only four murders outside of that loop. The northern half of the city within 465 also has relatively few murders.”
“Here are Chicago’s murders through the first 4.5 months of 2017 (there were 222 homicides by that point). One small neighborhood, Austin, accounts over 25 murders. But 23 of the 77 neighborhoods in the city have zero murders, and most of the 40 neighborhoods in orange have only one murder. Twelve of the neighborhoods have 10 or more murders.”
And the beat goes on. And in closing, the next time you hear Byron Taylor Cornhole, the divorcee Sam Seder, Joe Scarborough, Joe Biden or any idiot Democrat start flapping their teeth about “homicide rates in red states” you can rest assured, they have not a clue.
The board has received Joe Scarborough & Brian Tyler Cohen’s concession & I graciously accept it.
*** I have not published this data yet but will soon. Here is a snippet of it pertaining to Oklahoma (it focuses on counties w/ ZERO homicides):
How about Oklahoma? https://osbi.ok.gov/publications/crime-statistics https://osbi.ok.gov/file/10091/download?token=8SuW41G8
Counties in Oklahoma that had ZERO homicides in 2020: Alfalfa, Atoka, Beaver, Blaine, Caddo, Carter, Cimarron, Coal, Cotton, Craig, Ellis, Grant, Greer, Harmon, Harper, Haskell, Hughes, Jefferson, Kingfisher, Kiowa, Latimer, Love, Major, Marshall, Mayes, Murray, Noble, Pawnee, Payne, Pushmataha, Roger Mills, Sequoyah, Tillman, Woods & Washita.
35 of OK’s 77 counties (45.45%) had zero homicides in 2020.
Counties in Oklahoma that had ZERO homicides in 2019: Alfalfa, Atoka, Beaver, Beckham, Blaine, Caddo, Cimarron, Coal, Cotton, Craig, Delaware, Dewey, Ellis, Garvin, Grant, Greer, Harmon, Harper, Haskell, Hughes, Jefferson, Kay, Kingfisher, Kiowa, Latimer, LeFlore, Love, McIntosh, Major, Nowata, Ottawa, Pawnee, Pushmataha, Roger Mills, Texas, Tillman, Woods, Woodward & Washita.
39 of OK’s 77 counties (50.64%) had zero homicides in 2019. ***
361
views