

From boomers to Gen Z, women of all generations feel this subject is still stigmatized
Thirty-eight percent of women feel like society has a negative stigma about women discussing their bodies — especially Gen Z (55%), according to new research.
A survey of 2,000 women evenly split by generation looked at the stigma around menstruation, finding that this hasn’t changed much for the three in five who said they experienced this stigma when they were growing up.
Growing up, Gen Z women (34%) had nearly as hard of a time talking about their period as baby boomers did (38%).
A third of women also said that conversations about menstruating were tougher than those about finances (25%) or politics (22%) when they were growing up.
Even today, women are more comfortable talking with their loved ones about their mental health (55%) and finances (43%) than menstruation (39%).
Conducted by OnePoll in partnership with Intimina, the survey found that more than three-quarters of women surveyed agree that it’s important to create a social environment for future women to feel comfortable discussing their bodies (78%).
More than a fifth of all respondents believe that younger generations face more challenges when discussing menstruation openly, compared to older generations (22%).
Nearly a third of Gen Z respondents agree that younger generations have to overcome more hurdles in this area (28%).
"Empowering women across every generation involves more than just acknowledging the challenges they face,” said Dunja Kokotovic, global brand manager at Intimina. “It requires a commitment to breaking down barriers, fostering education, and dismantling stigmas. We recognize that each era brings its unique set of obstacles for women. By creating safe spaces, advocating for comprehensive education, and challenging taboos surrounding topics like menstruation, we pave the way for future generations to navigate their journeys with confidence and pride. Let us embrace the responsibility to uplift and support, ensuring that every woman, regardless of age, can lead a life free from judgment and full of empowerment."
Forty-three percent of all women surveyed said that there are more inspirational women today compared to when they were growing up. Gen Z was the most likely to say this (52%) while millennials was the least (38%).
A majority of women surveyed feel inspired by women they know (79%), with Gen Z finding the most inspiration (87%) through figures like their moms, friends and grandmothers.
Half of respondents also feel inspired by celebrity women (52%).
According to respondents, the most inspirational famous women are Rosa Parks (41%), Princess Diana (36%) and Michelle Obama (34%).
Gen Z was the only generation to rank Beyoncé (39%) and Selena Gomez (38%) in their top three famous inspirational women.
Over the past year, women have sought inspiration from other women for fashion and beauty (42%), health (40%) and food (40%).
Lifestyle inspiration has also been helpful for Gen Z respondents (52%) and millennials (41%), while baby boomers have sought fitness and wellness tips from other women (26%).
Yet, a third believe there aren’t enough famous inspirational women today to inspire the next generation (32%), especially millennials (37%).
"We believe our joint mission as a society is to inspire future generations to embrace and be proud of their bodies,” said Kokotovic. “Open conversations about natural processes, such as menstruation, are crucial for fostering a sense of comfort and empowerment. By breaking down the barriers of stigma and encouraging open dialogue, we pave the way for a world where individuals feel confident in their own skin. Our commitment lies in creating a culture where discussing bodily functions is normalized, ensuring that the coming generations grow up with a positive and empowered attitude towards their bodies and the natural processes that shape them."
MOST INSPIRATIONAL FAMOUS WOMEN
1. Rosa Parks — 41%
2. Princess Diana — 36%
3. Michelle Obama — 34%
4. Oprah Winfrey — 26%
5. Maya Angelou — 25%
6. Beyoncé — 21%
7. Queen Elizabeth II — 21%
8. Serena Williams — 18%
9. Selena Gomez — 18%
10. Taylor Swift — 18%
Survey methodology:
This random double-opt-in survey of 2,000 women evenly split by generation was commissioned by Intimina between Jan. 15 and Jan. 21, 2024. It was conducted by market research company OnePoll, whose team members are members of the Market Research Society and have corporate membership to the American Association for Public Opinion Research (AAPOR) and the European Society for Opinion and Marketing Research (ESOMAR).
46
views

Study finds the top ‘good luck’ game day foods
Burgers, chicken wings, and hot dogs are considered the ‘good luck’ game day foods – while deviled eggs and garlic bread are deemed bad omens.
A poll of 2,000 sports fans found 44% have food-focused superstitions when it comes to a big game, with 85% of those only ever eating or serving certain dishes on game day.
Pizza, popcorn, and chips are also considered to bring positive energy, but mozzarella sticks, salsa and queso dip seem to have the opposite effect.
The study, commissioned by brioche brand St Pierre and conducted by OnePoll, found that when it comes to wider superstitions, 79% will carry out strict rituals ahead of a game to help improve for the chances of a good result.
Of these, 34% must sit on the same part of the sofa for any game when watching at home, while 40% will wear a ‘lucky outfit’.
And to avoid cursing their favorite team, 32% will refuse to watch a match with specific people they deem ‘unlucky’.
“It seems people take sport and their superstitions very seriously – so much so that almost three-quarters of fans believe the final outcome of the game could depend on it,” a spokesperson for St Pierre said.
“We are big believers that food is more than a meal on your plate – it helps make memories, bring people together – and – judging by the results of this research, it helps sports teams win titles!”
More than seven in 10 (71%) of those who are religious with their rituals have gone as far as refusing to watch the game until they have been performed.
What’s more, 74% believe the outcome of a previous sporting event was determined by whether they took part in their pre-event ritual, or not.
Of the 58% who label themselves superstitious when watching their favorite team play, half are this way because of their parents, while 43% developed it themselves.
As 38% will eat a specific type of food as part of their own sporting ritual, 32% of those who have ever hosted a Super Bowl party say serving the correct food was their highest priority.
While 69% agree the snacks are almost as important as the event itself.
Making sure the game was displayed properly and having a good mix of friends round was also on the list of must-haves for a successful gathering.
It also emerged that almost half - 48% - admit they have attended a Super Bowl party for the food and drink only – while having no particular interest in the game itself.
A further 37% prefer to socialize rather than watch the teams play, and exactly three in 10 only take an interest in it because of the famed halftime show.
Kayleigh Swift, US Brand Manager for St Pierre, added, “With Super Bowl just round the corner, it’s been great to get an insight into what people think about the build-up and the social gatherings which take place all over the country.”
TOP 20 ‘GOOD LUCK’ GAME DAY FOODS
1. Pizza
2. Hot dogs
3. Burgers
4. Chips
5. Popcorn
6. Chicken Wings
7. Ice cream
8. Chicken sliders
9. Cupcakes
10. Cookies
11. Tacos
12. Potato skins
13. Assorted cheeses with crackers and fruits
14. Nachos
15. Salsa and queso dip
16. Chicken tenders
17. Trail mix with nuts, pretzels, and dried fruit
18. Mozzarella sticks
19. Chili
20. Vegetable platter
TOP 20 ‘BAD LUCK’ GAME DAY FOODS
1. Deviled eggs
2. Garlic bread
3. Salsa and queso dip
4. Ice cream
5. Chicken Wings
6. Mozzarella sticks
7. Mini burgers with various toppings
8. Trail mix with nuts, pretzels, and dried fruit
9. Pretzels
10. Pasties
11. Pulled pork sliders
12. Jalapeño poppers
13. Chicken tenders
14. Chicken sliders
15. Tacos
16. Popcorn
17. Vegetable platter
18. Hot dogs
19. Assorted cheeses with crackers and fruits
20. Potato skins
72
views

Top relationship goals Americans have for 2024
One in seven Americans in serious relationships said their partner doesn’t do enough to show that they desire them, according to new research.
A survey of 2,000 sexually active U.S. adults in committed relationships found that nearly 100% of respondents said that they believe it’s important to show your partner that you love them (97%) and want to be intimate with them (96%).
However, nearly one in five people admit that being physically intimate with their partner has been a low or non-existent priority over the past year (18%).
The survey conducted by OnePoll for K-Y’s launch of the K-Y Desire Darkroom experience found that consequently, a quarter of those surveyed don’t think that they spend enough time being intimate with their partner.
And these feelings don’t always go away with time: 29% of respondents, who have been with their partner for at least five years, think they could use more intimacy in their relationship.
What’s the hold-back? On average, respondents said that the stress of life has a negative impact on their relationship three days a week.
Thirty-five percent are affected even more often, citing that life’s stressors get in the way most of the week.
To address this, a majority of those surveyed said spending time being intimate with their partner is a high priority in 2024 (55%).
"Keeping the spark alive in a relationship is rooted in showing that ‘I want you’ is just as powerful as saying ‘I love you,’” said Mariia Tarakanova, marketing director for intimate wellness at Reckitt. “Despite hectic schedules and life getting in the way, couples need to show their desire for each other.”
For the past year, saying “I love you” (51%), being positive to one another (50%), and spending more time together (46%) have been the top priorities for respondents. However, this year, goals look a bit different.
In 2024, some of the top relationship goals are being positive with one another (37%), improving communication (34%) and being physically intimate more regularly (29%).
Currently, just 28% of respondents in serious relationships are intimate with their partner at least once a day.
Results showed that those who have been in a relationship for under five years are more likely to be intimate with their partner daily (39%) compared to those who have been in a relationship for over five years (23%).
This may be because respondents feel some aspects of their relationship are repetitive and could use a refresh, especially when it comes to the activities they do together (26%) and their time in the bedroom (23%).
Even those who have been together for a long time aren’t exempt, with 23% saying they’re a bit bored in the bedroom.
Compared to the beginning of their relationship, 55% of respondents and their partners incorporate more new elements in the bedroom today, like personal lubricant.
But one in seven struggles with finding new ways to show their partner that they desire them in an intimate way.
With Valentine’s Day typically being the catalyst for romance, 65% of couples who spend the holiday together shared that they wish they were just as intimate year-round.
To mimic this, respondents would enjoy having their partner arrange dinner together at a favorite restaurant (53%), a romantic setting in the bedroom (47%) or a couple’s spa day (32%).
To get creative, respondents recall feeling wanted when their partner “surprised me with a new wedding ring,” “leave me sweet notes,” “get me roses just because” and even got a little risqué when they “send me naughty pictures.”
These moments may be just what couples need to reignite the flame, as 68% already find their partner more desirable today than when they first met.
Similarly, 63% feel stronger passion for their partner today than when first meeting them, with men more likely to feel this way than women (73% vs. 55%).
“As evident through this study, we know the passion and desire is there and only grows throughout their relationships,” said Tarakanova. “This year, we’re encouraging couples to make time for these small intimate moments to show each other their “want” instead of assuming their partner knows.”
RELATIONSHIP GOALS FOR 2024
Be positive to one another — 37%
Improve communication — 34%
Spend more time together — 34%
Say “I love you” more — 34%
Plan for the future — 31%
Learn/grow together — 30%
Be intimate more regularly — 29%
Build trust — 28%
Focus on new adventures — 27%
Find new ways to be intimate — 26%
Survey methodology:
This random double-opt-in survey of 2,000 sexually active Americans who are in a committed relationship was commissioned by K-Y between Jan. 5 and Jan. 13, 2024. It was conducted by market research company OnePoll, whose research team are members of the Market Research Society, the American Association for Public Opinion Research (AAPOR) and the European Society for Opinion and Marketing Research (ESOMAR).
24
views

Study finds the best part of the Super Bowl is not the actual game
Almost two in five Americans (17%) plan to watch 20 minutes or less of the actual game during the Super Bowl this year.
According to a survey of 2,000 U.S. adults who watch the Super Bowl, 40% look forward to attending or hosting a party for the big game, but they barely spend any time in front of the TV.
Respondents average viewing only 29 minutes of game play and 9% admit they are unlikely to know which teams are playing before they turn it on.
And when asked who won last year’s Super Bowl, only one-third were able to correctly identify the Kansas City Chief as the reigning champions.
This may be because 29% spend more time in front of the snacks and food than anywhere else.
Conducted by OnePoll on behalf of Char-Broil, results revealed that the half-time show (55%), commercials (45%) and the drinks (40%) all outweigh the competition on the field (38%).
And though they may disagree on the best parts, more than three-quarters (77%) can agree that it’s rude to stand and talk in the same room that people are watching the game.
When hosting a viewing party, respondents typically spend about eight days planning the menu, inviting guests and preparing.
And it seems Americans take their Super Bowl parties seriously as 31% are likely to spend more time planning for that than for a holiday celebration (24%) or a graduation party (8%).
In fact, many respondents have gone so far as to purchase a grill or outdoor cooking appliance (57%), nearly twice the amount of those who’ve purchased a TV (32%), in order to prepare for the big game.
Others bought serving bowls and dishes (52%) and a couch (46%).
“Super Bowl gatherings are about celebrating the highs and lows of the big game with good friends and great food,” said Tom Penner, CEO, Char-Broil. “Think of your grill as your game day MVP — making the food prep easy so you can focus on the fun. There are many quick, tasty recipes to help you plan a winning menu with ease.”
More than three-quarters (77%) believe that the food and snacks are imperative to the overall Super Bowl experience.
The best game-time party foods include chips (55%), dips (50%), hot dogs (42%), pizza (39%), hamburgers (37%) and even grilled veggies (15%).
In order to cook these foods to perfection, respondents use a pizza oven (54%), a smoker (48%), a griddle (41%) and gas (39%) or electric (20%) grills.
And for all that goes into this feast, the average respondent will start cooking five hours before game time and ideally, needs three people helping them out.
But what elements specifically make up the perfect Super Bowl snack? For most (64%), that means something relevant to the game, such as Philly cheesesteaks if the Eagles are playing or barbeque in support of Kansas City.
“Super Bowl snacking is all about that unique twist, and 43% of fans are craving something out of the ordinary this year,” said Penner. “Versatile, multi-functional grills are perfect for those looking to experiment — from classics like wings, to on-trend smash burgers — without extra clutter or cost. We invite everyone to explore new flavors and make this Super Bowl spread one to remember.”
Survey methodology:
This random double-opt-in survey of 2,000 American adults who watch the Super Bowl was commissioned by Char-Broil between Dec. 8 and Dec. 12, 2023. It was conducted by market research company OnePoll, whose team members are members of the Market Research Society and have corporate membership to the American Association for Public Opinion Research (AAPOR) and the European Society for Opinion and Marketing Research (ESOMAR).
203
views

2 in 5 have ended a relationship over a poor financial decision
Your money mistakes may just cost your relationship, according to new research.
A survey of 2,000 Americans looked at the importance of decision-making and found that 40% have ended a relationship over a poor financial choice.
Overall, nearly three-quarters of respondents feel sure about their decision-making ability, describing themselves as decisive (74%). Just one in six admit to being indecisive.
Those who are sure about their choices chalk it up to good judgment skills (68%), confidence (63%) and strong intuition (62%). They also pride themselves on their ability to think quickly (58%) and gauge others’ behaviors like tone or body language (54%).
On the other hand, those who are indecisive fear making the wrong decision (55%) and seek to understand as much information as possible (56%).
For nearly half of these respondents, opposites attract, as they look for someone more decisive when considering a relationship (46%). This holds true except in the Midwest, where only one in five seek someone more decisive.
While most Americans believe they’re decisive, many seek advice from someone at work (35%) or the news (29%) — above their partner’s advice (18%) — when considering money-related decisions.
Conducted by OnePoll in partnership with SurePayroll By Paychex, the survey also found that some of the daily decisions people struggle with regularly are what to eat for different meals (44%), what to watch on TV (40%) and hobby-related decisions like what book to read or what to create (39%).
Respondents are most open to negotiation when it comes to household debates about meal choices (47%) or chores (37%), but less so about work-related decisions like switching areas with a colleague (4%) or adjusting their pay (2%).
When it comes to big decisions, survey-takers put more faith in research (55%) and make pro- and-con lists (55%) to help them out.
Most respondents indicate they would want to be 100% sure before making a significant purchase, like a house (60%). This requires more certainty than the decision to get married or divorced (57%), start a family (44%), change jobs (48%) or move (40%).
Surprisingly, 40% said they would leave a major decision up to random choice.
On average, Americans would do six hours of research before making a big decision. One in nine said they would need to mull it over for at least 10 hours before deciding.
Some of these major decisions people have committed to are related to time or money, like moving somewhere new (41%) or investing a large sum of money (15%).
Others have made career-changing moves like starting a new job or career path (52%) or becoming a business owner (13%).
Of the major decisions to consider, respondents agree that starting a business (21%) and investing a large sum of money (22%) would take the longest deliberation.
“Whether making large or small decisions, the survey clearly shows people want to be sure about their decisions. The results highlight ways small business owners can help customers and prospects simplify and validate their decision-making process,” said Melissa Smiley, associated head of brand and content at SurePayroll By Paychex.
“With the faith people put in reviews and research, small business owners can boost customer confidence by adding a link to independent review sites to their home page, posting testimonials on social media, or providing a comparison against leading competitors.”
Just 21% are more concerned about how their decisions affect them in the long run than in the present (16%); more than half fall somewhere in the middle (58%).
Those surveyed admit to having regrets about decisions they made when they were young (27%) and about their career (27%).
Interestingly, 23% have misgivings about their partner and another 22% regret certain parenting decisions they made.
Respondents even feel contrite when it comes to choices like shopping; 43% are remorseful about purchases at a big box store because of quality concerns (63%), cost (53%) and worry about the business’s practices (60%).
Instead, 23% believe spending more shopping with a local business is a better use of their money compared to saving at a large chain.
“Americans feel sure about shopping at small businesses. The level of personalized service they receive from a local business serves to validate their purchase decision better than a purchase from a chain,” said Smiley. “Americans clearly appreciate the vibrancy and support local businesses — owned and operated by those active in the community — bring to their economy and the communities in which they operate.”
DAILY DECISIONS AMERICANS STRUGGLE TO FEEL SURE ABOUT
1. What to eat for different meals — 44%
2. What to watch on TV — 40%
3. Hobby-related decisions — 39%
4. What to wear for the day — 37%
5. What to purchase at the grocery store — 36%
6. Order of getting ready — 32%
7. How much/little of their money to spend — 31%
8. Breakdown of the day — 25%
9. When to take care of their personal hygiene — 18% [TIED]
10. Social-related decisions — 18% [TIED]
Survey methodology:
This random double-opt-in survey of 2,000 general population Americans was commissioned by SurePayroll By Paychex between Sept. 13 and Sept. 14, 2023. It was conducted by market research company OnePoll, whose team members are members of the Market Research Society and have corporate membership to the American Association for Public Opinion Research (AAPOR) and the European Society for Opinion and Marketing Research (ESOMAR).
83
views

These things are the top dining out dealbreakers for Americans
The number one deal breaker when it comes to eating out isn't expensive prices or rude wait staff — it's cleanliness, according to 44% of Americans.
A survey of 1,000 Americans and 1,000 small business owners and hospitality workers found that when it comes to restaurants, cleanliness ranked higher in importance than having a variety of menu options (35%) or the affordability of the restaurant (33%).
The survey looked at how cleanliness plays a role in the decision to visit a business and how businesses handle cleaning.
When dining, customers are keeping their eyes out for cleanliness — or lack thereof. They’re surveying the tables (56%), plates/bowls (56%) and cutlery (49%).
Conducted by OnePoll on behalf of P&G Professional, the survey found that Americans value tidiness so much that three in five said that uncleanliness would be a dealbreaker when it comes to both restaurants (61%) and hotels (62%).
Respondents also ranked cleanliness as the top factor they consider when choosing somewhere to stay on vacation (39%).
Lack of cleanliness is also the top reason that respondents wouldn’t return to a business, followed by quality concerns (38%) and poor customer service (35%).
More than half of those surveyed would become repeat customers if a business was always clean (52%) — more so than if it offered discounts or perks (42%) or was within walking distance (31%).
To ensure they’re making the right decisions, most Americans “always” or “often” research reviews of restaurants (64%) or vacation rentals (62%) before choosing “the one.”
At vacation rentals, respondents are scoping out the bathroom or shower (55%), linen/sheets (49%) and flooring (48%) the most.
Overall, 64% of Americans have a great appreciation for businesses that keep their establishments clean, and those in the industry are aware of this.
“Keeping restaurants and hotels clean is the obvious choice for business owners,” said Dr. Juan Goncalves, leader of scientific communications for P&G Professional in North America. “Patrons value cleanliness when it comes to deciding what businesses they support. So cleaning is not just a chore. It’s a competitive advantage. It’s our mission to provide small business owners with products and resources needed to clean as simple, safe and effective as possible.”
Small business owners recognize that cleanliness is important to visitors, which is why they spend an average of 167 hours a year just cleaning their establishment.
Similarly, more than half of hospitality workers noted cleaning as their most time-consuming task (53%).
While helping customers (44%) and cleaning (41%) are the most time-consuming parts of their job, professionals have an affinity for the former.
Meeting new people (44%) and helping customers (40%) ranked among the top three favorite things about SBOs and hospitality workers’ jobs.
It’s a good thing they enjoy caring for their customers since the average small business owner and hospitality worker spends about half their day doing so.
In fact, these professionals would like it if they had even more time in their day doing what they love — interacting with customers (37%).
Fifty-six percent wish they could get some of the time spent cleaning back on their side and find inspiration for time-saving cleaning tricks on social media (46%) and from others in their industry (43%).
“We seek to equip business owners with cleaning products to meet the needs of their business and help them put their best foot forward for their customers,” said Bryan Smith, Vice President North America for P&G Professional. “We combine our knowledge of the industry and our expertise in cleaning to offer businesses products that get the job done as quickly and effectively as possible. We understand the critical role quality products play for businesses, and we provide products that help with the cleaning and sanitization process so that consumers can trust that their preferences when it comes to the cleanliness of establishments are heard.”
Survey methodology:
This random double-opt-in survey of 1,000 general population Americans, 500 small business owners and 500 hospitality workers was commissioned by P&G Professional between Nov. 8 and Nov. 14, 2023. It was conducted by market research company OnePoll, whose team members are members of the Market Research Society and have corporate membership to the American Association for Public Opinion Research (AAPOR) and the European Society for Opinion and Marketing Research (ESOMAR).
21
views

Looking for a good night’s rest? You should head to this state
Those looking for a good night’s rest should head to the Golden State: new research found that Californians get the best sleep.
The survey of 5,000 Americans, split evenly by state, asked respondents about the average quality of their sleep, how many high-quality nights of sleep they receive in a week and the number of hours they average per night.
Looking at an average of those three numbers, respondents in California were found to receive the best sleep — but despite California coming in first, the rest of the top five was dominated by East Coast states.
South Carolina and New York came in second and third, respectively, with Maryland and New Jersey tied for fourth and North Carolina taking fifth.
Commissioned by Herbalife and conducted by OnePoll, the survey revealed there’s still a lot left to desire when it comes to respondents’ sleep.
Despite coming in first place overall, Californians said their sleep only averaged six and a half for quality (out of 10) — and they spend just over half the week (four nights) receiving high-quality nights of sleep.
And even though experts recommend that adults sleep between seven and nine hours a night, those in California receive just over six and a half hours of sleep per night.
Regardless of where they live, 55% of respondents can’t remember the last time they had a “perfect night” of sleep — and 78% can’t recall when they last had a “perfect week” of sleep.
While “perfect” sleep might not be attainable, the survey also asked respondents if they know how to get a good night’s sleep: something less than half (48%) said yes to.
Even then, respondents admit to watching TV (66%) or scrolling through their phone for an extended period of time — either on social media (38%) or otherwise (29%) — in the two hours before bed, activities which aren’t recommended ahead of sleeping.
Californians were slightly better than average, which might be why their state came out as No. 1 for overall sleep. Only 54% watch TV before bed, while 32% scroll through social media and a quarter (25%) do something else on their phone before falling asleep.
“The unfortunate truth is the blue light from TVs, phones and digital devices unequivocally impairs sleep quality. Even if you’re able to fall asleep, the quality of sleep is reduced and your brain biology is disrupted,” said John Heiss, Ph.D., vice president of Global Product Innovation at Herbalife. “The additional problem with blue light is that it disrupts your circadian rhythm, which controls mood, organ function and metabolism. If you’re experiencing food cravings, blue light may be the culprit.”
Seventy-eight percent of respondents said they’re trying to improve their sleep in 2024.
This involves making their bedtime and morning routines more consistent (44%), taking time away from screens before bed (39%) and eating less in the evening before bed (30%).
Forty-four percent of respondents also said that improving the quality of their sleep is their No. 1 priority in life right now.
Getting better sleep is key, as 74% of respondents agreed that when they receive poor-quality sleep, their overall health is negatively impacted.
This was true across generations, but Gen Zers were the least likely to agree: 67% of Gen Z said poor-quality sleep impacts their health, compared to 78% of millennials surveyed.
Regardless of their age, respondents said poor-quality sleep leads to a lack of energy (67%) and feelings of anxiety or depression (41%) — it also makes them short-tempered with loved ones (38%) and less motivated at work (33%).
Bad sleep can also be a cycle: those surveyed said when they sleep poorly, they sleep less well the following night(s) (21%).
The effects of poor-quality sleep varied by generation, too: baby boomers were most likely to report a lack of energy (71%, versus 63% of millennials), while millennials were the most likely to become short-tempered (45%, versus 25% of baby boomers).
The survey also revealed some interesting differences between how men and women sleep. Thirty-seven percent of men said they “often” or “always” feel sleep deprived — compared to half of women.
And while 52% of men remember the last time they got a “perfect night” of sleep, only 42% of women said the same — with a similar pattern emerging when respondents were asked about a “perfect week” of sleep.
Twenty-seven percent of men were able to recall the last time they had a week of flawless sleep, compared to 19% of women surveyed.
“Getting enough quality sleep is essential to our well-being. In fact, sleep supports a variety of important functions including our metabolism, brain health and can have an impact on certain health conditions like heart disease, obesity and depression,” said Dr. Heiss. “A New Year resolution to improve your sleep quality will undoubtedly have many health benefits. Specific actions you can take are limiting screen time an hour before bed, keeping a consistent sleep schedule — especially on weekends, regular exercise, limiting food within three hours of sleep and relaxation techniques such as reading, breathwork or meditation before bed.”
WHAT STEPS ARE RESPONDENTS TAKING TO IMPROVE THEIR SLEEP IN THE NEW YEAR?
● Making my bedtime and/or morning routine more consistent — 44%
● Taking time away from screens before bed — 39%
● Eating less in the evening/before I go to bed — 30%
● Making time for quiet hobbies before bed (reading, yoga, etc.) — 30%
● Changing my diet — 23%
STATE “SLEEP SCORES,” FROM BEST SLEEP TO WORST
1. California
2. South Carolina
3. New York
4. Maryland (tied for fourth)
5. New Jersey (tied for fourth)
6. North Carolina
7. Pennsylvania
8. Ohio (tied for eighth)
9. Arizona (tied for eighth)
10. Washington (tied for eighth)
11. Michigan (tied for 11th)
12. Colorado (tied for 11th)
13. Georgia (tied for 13th)
14. Texas (tied for 13th)
15. Virginia
16. Illinois (tied for 16th)
17. Rhode Island (tied for 16th)
18. Wisconsin
19. Arkansas (tied for 19th)
20. Tennessee (tied for 19th)
21. Alabama
22. Florida (tied for 22nd)
23. Missouri (tied for 22nd)
24. Mississippi (tied for 22nd)
25. Alaska
26. Delaware (tied for 26th)
27. Indiana (tied for 26th)
28. Nevada (tied for 26th)
29. New Hampshire (tied for 26th)
30. Louisiana (tied for 30th)
31. South Dakota (tied for 30th)
32. Kentucky
33. Utah (tied for 33rd)
34. North Dakota (tied for 33rd)
35. Vermont (tied for 33rd)
36. Oregon
37. Idaho (tied for 37th)
38. Iowa (tied for 37th)
39. Nebraska (tied for 37th)
40. Massachusetts (tied for 37th)
41. New Mexico (tied for 37th)
42. Connecticut
43. Kansas (tied for 43rd)
44. Oklahoma (tied for 43rd)
45. Minnesota (tied for 43rd)
46. Hawaii (tied for 46th)
47. Wyoming (tied for 46th)
48. Maine
49. West Virginia
50. Montana
Survey methodology:
This random double-opt-in survey of 5,000 Americans, split evenly by state (with quotas for age) was commissioned by Herbalife between Oct. 20 and Nov. 6, 2023. It was conducted by market research company OnePoll, whose team members are members of the Market Research Society and have corporate membership to the American Association for Public Opinion Research (AAPOR) and the European Society for Opinion and Marketing Research (ESOMAR).
84
views
2
comments

This is how Americans define financial independence
The average American says financial independence is making upwards of $94,000 per year and 60% feel optimistic they can reach this money milestone.
In a recent poll of 2,000 U.S. adults, spenders and savers say financial freedom is synonymous with resilience and independence: not needing money from family and friends (47%), reaching a certain net worth (44%) and contributing to a 401(k) (42%).
The new study by financial services company Empower, conducted by OnePoll, reveals that more than 2 in 5 define “making it” as reaching financial independence (44%).
Doing so is important to 67% of Americans, though nearly a quarter (24%) say they haven’t yet achieved it. Definitions of success extend beyond Americans’ wallets to the workplace by moving up in their career (39%) and having a job they love (37%).
Despite having financial aspirations for the future, a majority of people (72%) admit they currently stress over their finances at least once per month and nearly 1 in 5 (17%) say they worry about money daily.
Over half (57%) of Americans say they still rely on their family and friends for financial support, especially for help paying their rent (62%), internet and streaming services (56%) and their phone bill (54%).
Of those who don’t feel financially independent, 3 in 10 (31%) are optimistic they will be in the future, while 54% don’t think they’ll ever be able to pay their bills without help.
The majority (92%) of financially independent Americans say they only started to feel that way once they reached the age of 36.
“No matter your age, financial independence starts with clarity,” says Keith Jones, senior financial professional with Empower. “Ask yourself what you want and why you want it. Establishing clear financial goals provides both direction and purpose, motivating you to work towards a more secure and satisfying financial future.”
The poll found many parents believe their kids should be able to pay their own bills and expenses by the time they reach age 23.
Of those with adult children aged 20 or older, 2 in 5 (40%) parents surveyed currently support them financially, and more than half (53%) are dipping into their retirement savings to do so, and 49% say they live with their children to help manage expenses.
More than half of parents regret not having more money conversations with their children while they were growing up (57%). If they could turn back the clock and do things differently, 60% would have made financial literacy (60%) a priority.
TOP 10 SIGNS YOU’VE FINANCIALLY “MADE IT” IN LIFE
Being financially independent/not relying on anyone else for money - 44%
Moving up in my career/getting promoted - 39%
Having a job I love - 37%
Making a certain amount of money - 25%
Not having to work at all - 25%
Being able to spend money without worrying - 22%
Being able to pay my bills on time - 9%
Buying luxury items I want - 7%
Being able to retire comfortably - 7%
Buying a home - 6%
Survey methodology:
This random double-opt-in survey of 2,000 general population Americans was commissioned by Empower and fielded by market research company OnePoll between December 11 and December 12, 2023. OnePoll team members are part of the Market Research Society and have corporate membership to the American Association for Public Opinion Research (AAPOR) and the European Society for Opinion and Marketing Research (ESOMAR).
82
views

Research reveals what your favorite literary genre says about you
People who like to read action/adventure books are the most generous tippers, according to new research.
A survey of 2,000 Americans who read frequently looked at the personality differences between lovers of different genres and found that adventure readers are the likeliest to tip over 20%.
Unsurprisingly, romance readers “always” or “often” daydream the most (37%), but are also the likeliest to say they worry often (52%).
Those who enjoy reading biographies, on the other hand, are the least likely to have worries regularly (49%).
Of all of the genres, fiction (37%), mystery or crime (35%) and romance (26%) are some of the most well-loved books.
On average, respondents spend 10 hours a week reading — although 45% admit they have their head in a book for longer than this — with those who prefer historical fiction or thriller books the likeliest to have the highest average time spent reading.
Conducted by OnePoll for Apple Vacations, the survey found that while most read from the comfort of their home like their bed (59%) or couch (51%), another 40% read while traveling and on vacation (31%).
Seven in 10 book lovers said they’re fascinated by stories because they’re a daily vacation away from life.
In fact, 47% say books are just as effective as vacations to “escape from real life for a while.”
Respondents love their books so much that 71% make reading a priority compared to other chores.
Three in four carve out time for reading at home (78%) and 66% also make time for reading while on vacation.
Those who enjoy romance books (82%) and adventure books (79%) especially prioritize time for reading on vacation.
They’re not the only ones: half of all book lovers said that books are an “essential” to bring while traveling (51%).
What makes the best vacation read? Respondents said mystery or crime books (38%), fiction (25%) or thriller books (25%) are the best for traveling.
Other criteria for the perfect vacation book are taking place at a similar location as the trip (45%), being a classic or old favorite (43%) or being outside of your comfort zone (31%).
According to respondents, the best places to read on vacation are by calming waters like the pool (38%) or the beach (32%).
“Whether they're downloading a new novel to their tablet or throwing a few paperbacks into their beach bag, reading continues to remain a popular travel pastime. Even when you're not able to get away, books can help provide an escape or inspire a new adventure!" said Dana Studebaker, vice president of marketing, consumer brands at Apple Leisure Group.
More than a third of those surveyed have also been inspired to travel somewhere because of a book (38%) and 77% of these respondents have followed through on these travels to places like Wordsworth’s home, the Great Wall of China and Peru.
And a majority of those who have found travel inspiration in books are currently planning that trip (71%) to destinations like South Africa, Costa Rica and New York.
Vacation spots vary by what book you enjoy, too. Romance readers enjoy family-friendly vacation spots the most (51%), while tropical getaways are favored alike by respondents who read fiction (39%) and non-fiction books (38%).
Interestingly, horror lovers are the only group to have a preference for small towns (44%).
“There are so many beautiful places in this world and sometimes that can make it hard to decide on where to plan a vacation. Reading about the many adventures of the characters in books often inspires me to get out and create my own exciting experience whether it means talking to a stranger in a coffee shop or planning the trip of a lifetime,” said Mike Lowery, head of global consumer business at Apple Leisure Group Vacations.
Survey methodology:
This random double-opt-in survey of 2,000 Americans who read regularly was commissioned by Apple Vacations between Dec. 1 and Dec. 4, 2023. It was conducted by market research company OnePoll, whose team members are members of the Market Research Society and have corporate membership to the American Association for Public Opinion Research (AAPOR) and the European Society for Opinion and Marketing Research (ESOMAR).
57
views

How many months out of the year do Americans feel their best?
Over the last year, Americans have lost 26 hours with loved ones, missed eight social events and canceled nine dates due to not feeling their best.
A survey of 2,000 U.S. adults split evenly by generation revealed that the average American is only on their “A game”, or feeling their best, about 15 days each month, or six months out of the year.
Results also revealed that the top three reasons Americans tend to feel badly are not getting enough sleep (43%), stress (43%) and being sick (22%).
Almost three in five (57%) Gen Xers are likely to be brought down by stress, more than any other generation.
Employed respondents (62%) estimate that they’ve missed four days of work and spent another four whole days in bed over the last year simply due to being sick.
In that same timeframe, the average respondent lost more than $350 ($361.90), by way of either missing work, going to the doctor or purchasing medications.
Interestingly, millennials forked over more than $500 ($507.90) on those expenses, nearly three times what baby boomers spent ($185.90).
But that isn’t what’s keeping Americans up at night — 46% admit that they’re more concerned about missing out on experiences with loved ones than their 9-5.
Conducted by OnePoll on behalf of Mucinex, the survey also looked at Americans’ habits when they are feeling at their best and found they’re likely to spend time with family (42%), clean (27%), read (26%), hang out with friends (26%) and their pets (26%) in the evenings.
Millennials are the most likely generation to spend their healthy hours getting creative (24%), while baby boomers are most likely to go out to eat (32%).
If more hours in a day were readily available, many respondents would double down on socializing by visiting family and friends (25%), volunteering (9%) and even dating (9%).
Spending time with family and friends is especially important to Gen X (30%) and baby boomers (33%), while 15% of millennials would look for love.
On the flip side, respondents would also enjoy their peace and quiet and indulge in “me time” (27%), take a nap (25%), learn a new skill (16%) and catch up on work (16%).
But if given the choice, Americans are more likely to opt for some R&R if an extra 12 hours were added to their day, rather than be productive (47% vs 39%).
And though they may not be considered the hardest working generation by many, Gen Zers are the only age group that’s more likely to be productive with their additional 12 hours than they are to rest and relax (48% vs 38%).
“These days, our schedules are busier than ever, and time is a precious commodity,” said Jeffrey Kozlowski, Brand Manager on Mucinex 12-Hour. “Wouldn’t it be great if we could seize every moment and make the most of our days from sunrise to sunset? During cold and flu season especially, it’s so important to take good care of ourselves so we can spend our time doing what we love – not suffering from a cough or cold.”
The average American feels productive only about seven hours each day, though 13% of baby boomers are in their groove between 11 and 12 hours a day.
Results also revealed that three in five (60%) respondents agree that even when they are healthy, there aren’t enough hours in the day to get everything they want done.
This may be why half tend to try and carry on as usual when they’re sick.
Respondents also react to being sick by immediately reaching for over-the-counter medications (38%), drop everything and go back to bed (26%) or call up their doctor (17%).
Millennials, on the other hand, are most likely to head straight to the doctor (28%) or expect their partner to give them the prince/princess treatment (28%).
But at the end of the day, 70% of Americans agree that it’s difficult to make up for lost time when you’re sick.
“Everyone responds differently to being sick, but it’s a universal feeling to want to get back to feeling like yourself again, doing what you love — and with the people you love. This is why finding long lasting relief is key for allowing you to make the most of your day,” said Kozlowski.
Survey methodology:
This random double-opt-in survey of 2,000 Americans split evenly by generation (500 Gen Z, 500 millennials, 500 Gen X and 500 baby boomers) was commissioned by Mucinex between Dec. 1 and Dec. 5, 2023. It was conducted by market research company OnePoll, whose team members are members of the Market Research Society and have corporate membership to the American Association for Public Opinion Research (AAPOR) and the European Society for Opinion and Marketing Research (ESOMAR).
86
views

Survey reveals most Americans feel a physical impact from their diet
You feel what you eat — a new survey has found 93% of Americans feel a “physical impact” from what they eat, and many are being left feeling tired.
The poll of 2,000 US adults found many feel either tired (54%), frustrated (22%) or even sad (17%) by the time their day is done, and many credit their diet to the cause.
Overall, 20% reported their diets were “very healthy”, while 16% were willing to admit it was unhealthy. Nineteen percent even felt like their diet failed to meet all of their nutritional needs.
Nearly one in four women (23%) were especially concerned that their diet didn’t meet their needs, compared to just 13% of men who felt the same way.
One in five Americans said they don’t even have the slightest idea where their food comes from.
Commissioned by Daily Harvest and conducted by OnePoll, the study found 18% are unaware of the origins of their weekly groceries and a quarter (24%) “rarely” or “never” inspect the nutritional labels of the groceries they purchase.
Only 18% will always examine the nutritional labels of what foods they buy and 47% have come across ingredients they didn’t recognize on their favorite foods.
Gen Z was found to be the most savvy when it came to examining the labels of their favorite foods (75%), while seniors over the age of 78 and millennials were the least likely to look before they eat (27% and 23%, respectively).
Many admitted they would feel more motivated to purchase sustainably sourced food more often if it’s healthier for them to eat (48%), can improve their heart health (32%) or help them manage their weight (26%).
“By examining this data, we can tell that there’s a persistent problem where people are coming across foods that involve ingredients or origins that aren’t familiar to them, which is then impacting how they feel at the end of the day,” said Carolina Schneider, MS, RD, Daily Harvest's nutrition advisor. “That’s something no one should have to worry about when their health is on the line.”
The survey also took a look at how many are receiving their health and wellness information. While 42% still rely on their doctor as their primary source of health trends, a third instead turn their sights to either social media (35%) or their family and friends (33%).
Those who use social media for their health info claim the best platforms to use are Facebook (71%), Instagram (44%), and of course, TikTok (41%).
Only a third believe social media has had a positive impact on how they view their health.
More than a quarter (28%) also credit social media for having the biggest impact on the popularity of GLP-1 medications — drugs intended for use in diabetes patients, but have found a new off-label use for weight loss.
Over one-third (37%) said they’d be willing to try a GLP-1 medication to lose weight, with millennials as the most likely to try the new medications to lose weight (48%) and seniors over the age of 59 the least likely (66%).
Gen Z also seemed to be in favor of the new medications (44%), but were willing to do more research on the meds beforehand than millennials (78%, compared to 75%).
The new medications were also found to be more appealing to those with self-described “very healthy” diets than those who didn’t (53%, compared to 37% who admit to not having healthy diets).
A larger percentage said they’d stay away from it (45%), citing their hesitations as being unsure about the long-term effects of GLP-1s (42%), not having a medical need for them (35%) or not being able to afford them (23%).
“It’s clear that people have a healthy amount of caution around these new medications,” continued Carolina. “It’s all about taking the appropriate steps and understanding whether this is the best course of action for a person. People want to know what these medications are, what they can offer them, and — most importantly — the necessity of having a healthy diet to accompany their use.”
TOP 5 MOTIVATORS TO BUY SUSTAINABLY SOURCED FOODS
To eat healthier overall - 48%
Improve my heart health - 32%
Weight management - 26%
In order boost my energy - 25%
Manage my stress levels - 20%
Survey methodology:
This random double-opt-in survey of 2,000 general population Americans was commissioned by Daily Harvest between Jan 2 and Jan 4, 2024. It was conducted by market research company OnePoll, whose team members are members of the Market Research Society and have corporate membership to the American Association for Public Opinion Research (AAPOR) and the European Society for Opinion and Marketing Research (ESOMAR).
73
views
6 in 10 millennials treating themselves at home more now due to inflation
Millennials are embracing the comforts of home — one in five would rather enjoy a special meal at home than go to a restaurant, according to new research.
A recent survey of 2,000 U.S. adults saw 20% of millennials polled say they’d much rather have a night in with a bit of pampering than a night out.
The rising cost of living obviously plays a big part in the increasing trend of making nights in a little more special — six in 10 millennials (63%) said they’re turning to treating themselves at home more now due to inflation.
But for special nights at home, people will still do things in style. The average respondent polled said they’d be prepared to pay around $160 ($157.60) for a two-person, special meal at home.
The research, conducted by OnePoll on behalf of Cabot Creamery, saw seafood, stuffed olives and a box of chocolates named as the most common “little luxuries” people treat themselves to on special occasions.
Woodfired pizzas, premium ice cream, charcuterie boards and spreadable cheese also featured among the top 10 indulgences people consider for a real treat at home.
While luxurious meals for two may not always be in the cards, little treats are important too - the average respondent said they treat themselves in some way close to three times (2.8) times a month.
Results also revealed that 21% would rather have an indulgent appetizer over breakfast (15%) or even dessert (4%).
“We’re seeing millennial consumers really embracing experiential eating at home; and looking for ways to make meals special and interactive,” said Sarah Healy, Cabot Creamery’s Senior Vice President of Marketing. “It speaks to the rise of social-spurred food trends, like charcuterie and snacking boards. Delicious food is a universal indulgence, and inflation is causing a shift in how consumers approach treating themselves.”
And while everyone likes to be able to treat themselves, we’re a generous bunch at heart — respondents were three times more likely to want to treat their partner or spouse to a dinner at home than to simply treat themselves (35% vs. 10%).
The generosity doesn’t stop there. When hosting or attending a game night, big game party or night with friends, Americans said their go-to food item to bring is a cheeseboard. A quesadilla ring and chile con queso were the second and third most popular social night mainstays.
In fact, in order to make themselves feel more pampered, many respondents noted they will snack on artisan cheese (32%) or eat from a charcuterie board (24%).
But despite a devotion to the cheeseboard, it seems certain cheese knowledge is lacking for some. When shown pictures of cheese, just 9% correctly identified brie (mistaking it for mozzarella) and 28% could accurately name cheddar.
And a little more than two in five (42%) didn’t know that some types of cheeses are lactose-free, while 19% didn’t realize that cheese is a good source of protein.
“I’ve seen so many faces light up when I tell them that cheddar cheese naturally has zero grams of lactose per serving and is a great source of protein for any diet,” said Sara Wing, Registered Dietitian for Cabot Creamery Cooperative. "As a dietitian, understanding nutrition is key to staying healthy without sacrificing flavor. Whether you are lactose intolerant or simply looking to increase your daily protein intake, cheese is a great nutrient-dense snack.”
TOP 10 FOODIE TREATS
1. Seafood
2. Box of chocolates
3. Stuffed olives
4. Sushi
5. Homemade baked goods
6. Charcuterie board
7. Premium ice cream
8. Specialty jam
9. Spreadable cheese
10. Nuts and dried fruits
Survey methodology:
This random double-opt-in survey of 2,000 general population Americans was commissioned by Cabot Creamery between Dec. 5 and Dec. 6, 2023. It was conducted by market research company OnePoll, whose team members are members of the Market Research Society and have corporate membership to the American Association for Public Opinion Research (AAPOR) and the European Society for Opinion and Marketing Research (ESOMAR).
36
views
Study finds what defines an ‘unhealthy’ health-related resolution
The average active American would quit on their health-related resolutions about seven weeks into the new year, according to new research.
A survey of 2,000 Americans who work out at least once a week examined how closely people stick to health-related resolutions and found that 29% confess they’d last less than a month.
The average person surveyed reports they would miss their favorite “unhealthy” food just 14 days into giving it up.
But are respondents defining “unhealthy” too harshly? One in six mistakenly believe that all foods high in calories are “unhealthy” and another 32% said eating “healthy” means committing to select foods or cutting out certain foods completely (31%).
Similarly, others believe that carbs should be avoided (24%) and that healthy nutrition means sacrificing food that tastes good (18%). On the other hand, 36% believe it is important to prioritize protein.
Conducted by OnePoll for egglife for Quitter’s Day on Jan. 12, the survey found that when it comes to healthy eating, the same percentage of respondents consider it a chore as those who say it’s an easy part of their lifestyle (34%, each).
More than a quarter of those surveyed shared that the foods they want to eat often don’t align with what they consider to be “healthy” (28%).
The takeaway? Health and nutrition look different for everyone, which makes a cluttered landscape even more difficult to navigate when aiming to make lifestyle changes in the new year.
“Without a formal definition for ‘healthy,’ it’s no wonder you’ll find countless opinions on what constitutes a healthy food,” said Melissa Rifkin, RD, nutrition expert for egglife. “This word can be used to describe a food that possesses certain nutrients, the absence of some ingredients, how a food impacts one’s health or the way in which someone feels after eating the food. A healthy food can be all of these things, and more.
“Most importantly, healthy food isn’t about eating a restrictive diet or low calorie count. Rather, eating healthy food means choosing nourishing options that provide an array of nutrients known to benefit the body while working within one’s specific dietary needs, restrictions and preferences. The good news is when it comes to choosing healthier foods, taste and nutrition don’t have to be mutually exclusive.”
This may make it difficult for the 57% who often don’t know where to start with achieving their health-related goals.
For many, the challenges come more frequently when setting goals that are difficult to achieve.
The average person surveyed said that over the past year, a third of their health goals ended up being too extreme (34%).
Some of these “extreme” goals were found to be cutting a food group they enjoyed out of their diet (40%), reducing their calorie intake (39%) and drinking at least 70 ounces of water a day (36%).
The goals that they’ve had a particularly hard time achieving were trying to go to the gym every day (18%), cutting out a food group they enjoy (26%) and following a restrictive diet (17%).
For many, success is measured by how long the goal lasts, as four times as many respondents prefer health goals that help them in the long term (78%) as opposed to the short term (18%).
Thinking back to the “extreme” goals they’ve attempted, those surveyed learned that huge leaps don’t create lasting change, like cutting food groups out completely (23%) or losing weight too quickly (18%).
When reflecting on their previous health goals, nearly half realized that smaller goals that change things incrementally have been easier to achieve (47%) and led to more lasting lifestyle changes (42%).
Similarly, 41% said these kinds of goals have made them feel more accomplished on their health journey.
This lines up with the 24% of respondents who said that if there was a need to remove a food from their diet, it would be easier to cut down on eating it over time and one in six said it would be most helpful if they had a convenient replacement for it.
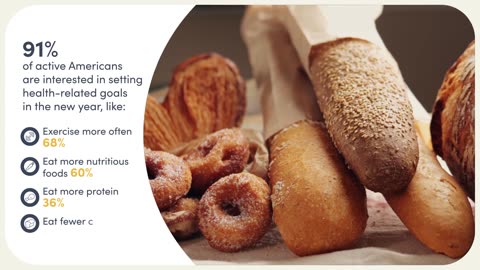
And they aren’t letting their past experiences with “extreme” goals deter them — 91% of Americans who exercise regularly are interested in setting health-related goals in 2024.
In the new year, these respondents want to exercise more often (68%), eat more nutritious foods (60%), eat more protein (36%) and fewer carbs (31%).
When asked about their specific health-related goals, respondents shared their desire to “have more energy,” “balance my overall health” and “tone up my body.”
“Attainable goals help build a sense of success that encourages continued behavior,” said Rifkin. “What makes a goal attainable is specific to your lifestyle and desire to change, and should allow you to make progress toward your long-term goals. Small, attainable goals can serve as stepping stones, allowing you to work toward your long-term objective, building your confidence along the way. We all feel more accomplished when we meet a goal, which is why small, attainable goals are more beneficial than extreme changes that aren’t maintainable.
Sure, these drastic changes can lead to faster results, but they are often harder to maintain and could actually make it harder for you to achieve your goals. Choosing a long-term goal that is specific, measurable, and attainable within a given time frame allows you to achieve smaller goals that make progress against your larger goal over time.”
Survey methodology:
This random double-opt-in survey of 2,000 Americans who exercise at least once a week was commissioned by egglife between Dec. 21 and 26, 2023. It was conducted by market research company OnePoll, whose team members are members of the Market Research Society and have corporate membership to the American Association for Public Opinion Research (AAPOR) and the European Society for Opinion and Marketing Research (ESOMAR).
61
views

How many times per year do Americans get the perfect night’s sleep?
The average American gets the “perfect” night’s sleep only 132 times per year, according to new research.
And while perfection may not always be attainable, a survey of 2,000 U.S. adults revealed that Americans average 120 “good” sleeps per year.
This means the remaining 113 nights are lost to “bad” sleep or ones that resulted in staying awake all night.
This may be because the average American goes to sleep feeling stressed or anxious three days each week.
In fact, this stress is so all-consuming that it keeps respondents awake for an additional three hours after their intended bedtime. Unfortunately, staying awake three hours after their bedtime is also the cut-off for when they know their next day will be negatively impacted.
To that same tune, almost two-thirds (65%) agree that a bad night’s sleep is enough to ruin the following day.
Conducted by OnePoll on behalf of Cornbread Hemp, results revealed that anxiety forces respondents to look at their phone (59%), eat snacks (49%) and stare at the ceiling (39%) instead of sleeping.
But what exactly are they stressing so much about? Almost three in five (58%) are plagued by concerns about their physical health, followed by the tasks they have to do the next day (56%) and mental health concerns (51%).
Regardless of specific stressors, 48% are equally likely to stress about situations that are already happening as much as they are to stress about hypothetical ones.
Respondents have tried reading (44%), warm milk (42%), CBD (37%) and melatonin (29%) to try and help themselves fall asleep and only 28% found the method they used most often to be “very effective”.
“Americans are waking up stressed three times a week on average, which is why it is so important to find natural, healthy ways to cope and feel better”, says Eric Zipperle, CEO of Cornbread Hemp. “Plant-based alternatives made from cannabis, with up to 2 mg of THC per serving, can offer relief and a goodnight’s rest.”
Results also revealed that the average American experiences four panic attacks each year.
Stress has also forced them to miss work (43%), meals with family and friends (41%), weddings (40%) and birthday parties (39%).
Others missed holiday gatherings (31%), concerts (20%) and even their child’s events like a recital or game (11%).
In 2023 alone, Americans missed an average of nine different events due to stress and anxiety.
In order to deal with their stress, respondents mediate (50%), meet with a therapist or counselor (43%) or take CBD (40%).
Some engage in retail therapy and shop online (32%) or in stores (22%), while others are productive and exercise (31%) or even clean (17%).
But if given the opportunity to get a “perfect” night’s sleep, free of stress every single day for a year, respondents would be willing to give up their WiFi (48%), their bed (43%) and indoor plumbing (41%).
“Melatonin and other sleep aids can come with many negative side effects, including morning grogginess,” added Zipperle. “The data from our study further confirms that melatonin may not be the most effective form of sleep support for most consumers”.
Survey methodology:
This random double-opt-in survey of 2,000 general population Americans was commissioned by Cornbread Hemp between Dec. 7 and Dec. 8, 2023. It was conducted by market research company OnePoll, whose team members are members of the Market Research Society and have corporate membership to the American Association for Public Opinion Research (AAPOR) and the European Society for Opinion and Marketing Research (ESOMAR).
65
views

More than 2 in 3 pet owners believe they adopted themself in pet form
Two-thirds of Americans say their pet is the four-legged version of themselves, according to new research.
The survey of 2,000 dog and cat owners revealed that 65% believe they adopted themself in pet form due to the overwhelming number of similarities.
Four in 10 (38%) said they share personality traits or hobbies — this includes enjoying long walks (67%) and car rides (57%) to sharing a love of peanut butter (50%).
Respondents and their pets also both dislike mornings (32%) and spend their time taking naps in patches of sunlight (24%).
A third (34%) believe they share physical characteristics with their pet — whether that’s the same eye color (61%), a similar overall size (54%) or the same hair and fur style (54%).
Cat owners were slightly more likely to say they “adopted themselves in pet form,” compared to dog owners (70% vs. 63%).
Despite that, dog owners felt there were more noticeable similarities between them and their pets — both in terms of physical characteristics (36% vs. 29% for cat owners) and personality (42% vs. 35% for cat owners).
Conducted by OnePoll and commissioned by Basepaws, the survey found respondents and their pets are so similar, they have the same New Year’s resolutions for 2024.
Almost half have created a resolution for themselves (44%) or their pets (46%) — of those with both (32%), the vast majority (90%) said it’ll be the same resolution for them and their furry friend.
Respondents and their pets will be focused on exercising more (71%), cutting back on treats (71%) and eating healthier (64%) in 2024.
They’ll also work to spend more time outside (59%) and take better care of their health (58%) throughout this upcoming year.
“As we enter 2024, many people are thinking of ways to get healthier — so why shouldn't we have the same goals for our four-legged friends?” said Anna Skaya, the CEO of Basepaws. “Nutrition and exercise are just as important to a pet's health as they are to your own, and they should be an area of focus well beyond Jan. 1. Resolutions are a great way to set some initial goals, but it’s important to stay on top of them throughout the year.”
When it comes to their health, 58% worry as much about their own health as they do their pet’s health — and 25% admitted they worry more about their pet’s health.
This worry is because respondents know less about their pet’s family history than they do their own (63%), and they don’t know what diseases their pet might be susceptible to (62%).
Not only that, but half of pet owners surveyed don’t know what preventative care they should be giving their pet, while others know less about their pet’s health history than their own (39%).
And 26% don’t know how to spot early signs of different diseases in their four-legged friend.
That said, 72% wish there was more they could do to ensure their pet is living a healthy life — with cat owners slightly more likely to agree (77% vs. 70% of dog owners).
“This research further emphasizes the unbreakable bond between pets and their people. Humans are able to predict and prepare for certain health issues by understanding their DNA and the same goes for those with four legs,” said Skaya. “Understanding your pet's unique DNA is more than knowing what breed they are — it can give you insight into predispositions for certain health issues and help you to better care for them.”
WHAT PERSONALITY TRAITS DO PEOPLE SHARE WITH THEIR PETS?
● Taking long walks — 67%
● Going on hikes — 57%
● Going on car rides — 57%
● Spending time at the beach — 51%
● A love of peanut butter — 50%
● A dislike of mornings — 32%
● A dislike of changes to the routine — 30%
● Enjoying treats — 28%
● Taking naps in patches of sunlight — 24%
● A dislike of new people or animals in my space — 23%
WHAT RESOLUTIONS DO PEOPLE AND THEIR PETS HAVE IN COMMON FOR 2024?
● Exercising more — 71%
● Cutting back on treats — 71%
● Eating healthier — 64%
● Spending more time outside — 59%
● Taking better care of our health — 58%
Survey methodology:
This random double-opt-in survey of 2,000 American dog and cat owners was commissioned by Basepaws between Dec. 5 and Dec. 6, 2023. It was conducted by market research company OnePoll, whose team members are members of the Market Research Society and have corporate membership to the American Association for Public Opinion Research (AAPOR) and the European Society for Opinion and Marketing Research (ESOMAR).
51
views

Millennials most likely to feel economically empowered than baby boomers
Younger Americans are more likely to feel “economically empowered” than older Americans, according to new, international research.
When looking at the 2,000 Americans surveyed, data revealed Gen Z and millennials were the most likely to currently feel economically empowered (66% and 70%, respectively).
This was compared to 51% of Gen X and 52% of American baby boomers.
33
views

Is it harder to commit to a fitness routine than a partner?
One in five Americans find it harder to commit to a fitness routine than a partner.
That’s according to a survey of 2,000 Americans who work out at least once a week.
Results revealed that over the last 10 years, Americans tried about five different workout regimens and had four different, serious partners.
In fact, more than two-thirds (68%) are likely to stick with a workout routine that doesn’t necessarily work for them simply because it’s comfortable.
Similarly, more than half (53%) of respondents are likely to stay with the wrong partner for the same reason.
Conducted by OnePoll on behalf of Freeletics, the survey dug into the idea of what makes a “perfect match.”
The results revealed that it’s most closely defined as something or someone that helps them reach their goals (66%).
Others say it’s something or someone that gives them warm, fuzzy feelings (61%) or someone or something that pushes them to be the best version of themselves (47%).
The average American has already found four perfect matches and those include their best friend (46%), therapist or psychiatrist (41%), partner (41%), doctor (40%) and even a gym (32%).
While 45% have already found their perfect workout, 24% are still searching for it.
The survey also uncovered the biggest deterrents when it comes to both relationships and workout routines. When starting a new romantic relationship, top deal-breakers include the amount of money they’d have to spend on their partner (52%), where they live (52%) and how much time they’d need to dedicate to them (40%).
Interestingly, those same three factors are the top deal-breakers when starting a new fitness routine.
Beyond that, respondents also consider if they actually enjoy doing the routine (27%).
When combining those two aspects of life, a little more than one-third (35%) believe that working out with a partner would help them achieve their fitness goals.
"The data shows that balancing fitness and romantic relationships often involves navigating the same waters – time investment, cost considerations, and finding joy in the process," said Confidence F. Udegbue, Member of the executive team and Director of Product and UX at Freeletics. "This common ground highlights how intertwined our personal well-being and relationships can be, influencing our decisions in health and love. In the new year, we’ll be looking to further emphasize the parallel between fitness and dating, and a perfect match for each.”
Though 20% of respondents struggle more with the initial commitment to a fitness routine, a similar number (22%) find it more difficult to let it go when it’s time to change their routine.
When it comes time to leave a workout regimen in the past, respondents experience a multitude of emotions including relief (42%), sadness (41%), anxiety (38%) and even happiness (29%).
This may be why Americans have faced barriers such as time constraints (51%), lack of customizable options (45%) and high costs (44%) when it comes to finding the “perfect” workout.
Beyond that, 44% admit they simply have a fear of commitment.
But at the end of the day, 78% of respondents would commit to a workout routine for longer if they knew they’d get the results they’re looking for.
"Not every match is a 'perfect match,' and the search can be challenging.” said Daniel Sobhani, CEO of Freeletics. “It’s important to find ways to simplify the fitness journey, such as personalized, adaptive workout plans built by human augmented AI technology. Finding an approach that meets you where you are and that evolves with your needs makes it easier to build and maintain a fitness habit that fits your life for life.”
Survey methodology:
This random double-opt-in survey of 2,000 Americans who work out at least once a week was commissioned by Freeletics between Nov. 27 and Nov. 29, 2023. It was conducted by market research company OnePoll, whose team members are members of the Market Research Society and have corporate membership to the American Association for Public Opinion Research (AAPOR) and the European Society for Opinion and Marketing Research (ESOMAR).
57
views

Feeling burnt out? Survey reveals how Americans increase their energy levels
Thirty-eight percent of Americans feel like they’re running on empty most of the week, according to new research.
A survey of 2,000 adults looked at the average person’s energy levels throughout the day and found that 38% feel low on energy at least four days a week.
The same percentage said these low energy levels spiraled into feelings of burnout in 2023.
Conducted by OnePoll on behalf of electrolyte drink mix, Liquid I.V., the survey found that respondents are keen to find a solution for burnout, highlighting the link between drink choices and managing energy levels.
When they’re in a slump, respondents shared that they increase their energy by drinking a caffeinated beverage (63%), a glass of water (47%) or something with sugar (46%).
Half of those surveyed rely on energy drinks to get themselves through bad days (50%), with one in five sharing that they consume energy drinks daily.
However, just 39% said they’re likely to have water near them throughout the day, ranking below coffee (44%), juice (41%) and soda (39%).
More so, 44% admit that they’re “multi-beverage goblins” who have at least three drinks on their desk at any given moment.
“Consumers, when feeling low energy or burnt out, often resort to drinking multiple caffeinated beverages with high sugar content, and little to no added benefits. While these drinks might provide a quick boost, over consumption of caffeine and sugar can exacerbate the very fatigue they are trying to overcome,” said Sai Chaluvadi, Ph.D., vice president of research and development of scientific affairs at Liquid I.V.
The survey also found that energy levels are important to keep an eye on since low energy impacts respondents more mentally (23%) than physically (17%) or emotionally (16%).
Thirty-eight percent said it affects them in all three ways.
In and outside of what they drink, respondents recognize their role in maintaining their energy, as 78% admit they could do a better job of keeping their energy up throughout the day.
On average, respondents notice themselves powering down by 2:44 p.m.
Missing out on the proper hydration can impact energy in the long term, too. Americans who experienced burnout said it set in within the first half of the year (71%) and for 28%, lasted longer than a week.
Reflecting on their experience, most of these respondents said their burnout was caused by family-related stress (50%) and work-related stress (45%).
Improper hydration that may have led to low energy has also impacted the 38% who turned down an outing or event within the past month because they couldn’t keep up.
And nearly eight in 10 of these respondents admitted to feeling FOMO in these instances (79%).
The holidays don’t make it easier, either. One in five said they have little or no energy at the end of the year after the holiday festivities.
A staggering 85% of Americans feel like they’ll need some mental or physical recovery time at the end of 2023 after the indulgent holiday food and drinks, with 29% of these respondents saying they’ll need at least a few weeks to recuperate.
Looking ahead, the majority of respondents are keen on avoiding burnout as much as possible in 2024 (79%) and 74% are interested in improving their energy levels in the new year.
Three in four want more out of their day than “just making it through” (78%) and to get there, they’re willing to commit to eating nutritious foods (57%), getting more sleep (54%) and drinking more water to stay hydrated (46%).
“Electrolyte enhanced functional hydration products are designed to deliver superior hydration and can provide benefits beyond just alleviating symptoms associated with dehydration. This can be a better proposition to consumers who are seeking healthier alternatives to current energy drink offerings,” said Chaluvadi.
“While still a developing area of research, numerous observational and clinical studies conducted over the past two decades consistently underscore the profound impact of staying hydrated on factors such as fatigue, mood, mental alertness, cognition and working memory. Our choices matter, and by incorporating beverages that provide both energy and hydration, we can cultivate habits that support long-term vitality and resilience."
Survey methodology:
This random double-opt-in survey of 2,000 general population Americans was commissioned by Liquid IV between Nov. 28 and Nov. 29, 2023. It was conducted by market research company OnePoll, whose team members are members of the Market Research Society and have corporate membership to the American Association for Public Opinion Research (AAPOR) and the European Society for Opinion and Marketing Research (ESOMAR).
23
views

More than two-thirds use their parents’ wellness remedies
More than two-thirds of Americans share their parents’ approach to wellness, new research suggests.
A survey of 2,000 U.S. adults revealed that when they were growing up, their parents used traditional approaches (39%), more so than alternative ones (13%).
These remedies weren’t just decided overnight, as most respondents (55%) say their parents got their approach to wellness from their own parents.
Sixty-one percent believe that their family set a good example of health and wellness when they were growing up.
Today, 52% tend to prefer a mix of both traditional, like taking medicine or going to the doctor, and alternative remedies, like eating certain foods, respondents were much more divided when asked to choose one over the other.
Three in five (63%) are likely to opt for traditional approaches such as getting plenty of sleep (63%) or over-the-counter medications (56%). Others increase their vitamin C intake (49%) and take supplements (35%).
On the other hand, 37% tend to prefer alternative remedies such as honey (62%) or lemon (62%).
Conducted by OnePoll on behalf of KAL Vitamins, the survey aimed to uncover how Americans approach their health.
Interestingly, almost one in five (16%) think modern medicine is untrustworthy.
This may be why the average respondent will ensure nearly four days (3.7) of symptoms before going to the doctor.
However, those who prefer traditional approaches will suffer for only two days (2.3) before taking over-the-counter medications, whereas those who prefer non-traditional remedies will wait three whole days.
But that doesn’t mean Americans aren’t taking matters into their own hands. Growing up, proactive approaches like drinking water (54%), eating healthy foods (48%), going to their doctor for physicals and wellness exams (45%) and taking vitamins and supplements (42%) were top of mind.
In fact, 52% say they take a proactive approach to their health today rather than a reactive one (20%).
“Regardless of what your parents taught you, keeping yourself healthy isn’t just visiting your doctor when you’re feeling sick. Taking a proactive approach to your health means having a yearly physical and regularly taking vitamins and supplements,” said a KAL Vitamins spokesperson.
When respondents were growing up, 31% say their parents prioritized their physical health more so than their mental (9%) and emotional health (8%).
Today, physical health still ranks as the top priority, though mental health has increased to a close second (15%).
Three-quarters (76%) of respondents are already parents or plan to be one someday and 81% of those respondents plan to use the same approach they take to being sick with their child.
In fact, 64% of respondents believe that today’s generation of children have the best health and wellness options and education opportunities.
And at the end of the day, respondents are more likely to trust their own parents when it comes to health and wellness advice (46%), much more than that of their best friend (15%) or social media (13%).
“It’s no secret that we all learn from our parents and health routines are no exception. While following their advice may help, it’s important to note that new advances in wellness are always being made,” said a KAL Vitamins spokesperson. “There are gaps that nutrition alone cannot fill and with generations or care and expertise, it’s important to take supplements for every life stage and need.”
Survey methodology:
This random double-opt-in survey of 2,000 general population Amercians was commissioned by KAL Vitamins between Oct. 31 and Nov. 6, 2023. It was conducted by market research company OnePoll, whose team members are members of the Market Research Society and have corporate membership to the American Association for Public Opinion Research (AAPOR) and the European Society for Opinion and Marketing Research (ESOMAR).
43
views

Study finds why majority of Gen Z embrace their rebellious spirit
The spirit of rebellion for good is thriving — especially among younger Americans, according to new research.
The survey of 2,000 Americans aged 21+ revealed that Gen Zers are the most likely to live their life in a “rebellious fashion.”
That’s more than any other generation: 74% of Gen Z (aged 21–26) embrace their rebellious spirit, compared to about half of millennials (52%), 63% of Gen X and only 39% of baby boomers.
Far from being a negative trait, the survey revealed people attest that rebellious behavior has had a positive impact on their lives.
Commissioned by Rebellious Wines and conducted by OnePoll, the survey delved deeper into this impact, looking at the realms of respondents’ personal and professional lives.
Gen Zers said engaging in behavior like breaking “standard” rules and conventions has led to positive changes in their self-confidence (70%) and their convictions (57%).
For millennials, embracing this behavior has most greatly affected how they feel part of something greater than themselves (54%).
This trend extends beyond personal growth to societal norms. The survey asked about various forms of rebellion and what rules and conventions respondents believe are worth breaking.
It looked at everything from pursuing unconventional jobs (58%) to breaking stereotypical norms with career paths (55%) or product purchases (42%).
The survey delved into food and drink preferences, and it found that four in 10 (39%) plan to break “foodie rules” in 2024 — and 42% currently challenge the standard rules and conventions when it comes to drinking wine.
This includes drinking from an unconventional cup (46%), drinking chilled red wine (45%) and putting ice cubes in wine (42%).
Respondents also break the standard rules by incorporating wine into cocktails (40%) and drinking red wine in the summer (33%).
“The responses reveal a comprehensive picture of rebellion: it's about breaking free from societal expectations, whether it's leaving a party without saying goodbye, drinking wine out of a coffee cup or wearing socks with sandals,” said Jennifer Fritz, Brand Director at Rebellious Wines. “We celebrate this growing trend of challenging the status quo and the burgeoning desire among younger generations to live fearlessly and break from conventional norms.”
Outside of how it has personally impacted them, respondents were also asked about the wider effect they believe it can have.
Results uncovered that half of Americans surveyed (52%) see professional growth stemming from taking chances, along with interpersonal relationships (50%) and societal progress (46%).
Interestingly, rebellion is now seen as more than an attitude: it's a skill.
Over half of Americans surveyed (57%) — including 74% of Gen Z and 55% of millennials — consider being rebellious a skill, suggesting a shift in societal perspectives.
The future generations look to continue to be disrupters, with 57% of respondents planning to embrace their rebellious spirit more in 2024.
Among these are 71% of Gen Zers and 56% of millennials, indicating a potential trend toward more unconventional life choices in the coming years.
“Being rebellious as defined today is not just about defiance; it's about creating a new identity and a sense of empowerment — it’s about carving your own path,” said Fritz. “This is a clear indication that traditional career paths and workplace norms are being challenged and reshaped, especially by a new generation of Americans.”
“Here's to the rebels, the innovators, the trailblazers — may they continue to inspire and redefine the boundaries of our world.”
EMBRACING REBELLIOUS BEHAVIORS CAN HAVE A POSITIVE EFFECT ON . .
Professional growth — 52%
Interpersonal relationships — 50%
Societal progress — 46%
Artistic expression — 42%
Personal growth — 38%
WHAT ARE SOME OF THE TOP RULES AND CONVENTIONS WORTH BREAKING?
Having an unconventional job (ex. YouTuber, tattoo artist, etc.) — 58%
Breaking stereotypical norms with my career path (ex. being a woman in a male-dominated field, etc.) — 55%
Dress codes for social events (ex. wearing heels or a tie, etc.) — 33%
The idea that you should go to a four-year university right out of high school (instead of taking a gap year, going to community college, etc.) — 23%
Social expectations at gatherings (ex. leaving without saying goodbye first) — 23%
Having a 9-to-5, five-day workweek — 15%
Having social media accounts (ex. not having social media accounts on popular or trending platforms, etc.) — 14%
Standard meals at designated times (ex. breakfast for dinner) — 12%
Dressing “business casual” for work — 11%
WHAT DO RESPONDENTS REGULARLY DO WHEN DRINKING WINE?
Drink from an unconventional cup (ex. a coffee mug, thermos, etc.) — 46%
Drink chilled red wine — 45%
Put ice cubes in wine — 42%
Incorporate wine into cocktails — 40%
Drink red wine in the summer — 33%
Survey methodology:
This random double-opt-in survey of 2,000 Americans — aged 21+, with 100 Gen Zers of legal drinking age — was commissioned by Rebellious Wines between Dec. 1 and Dec. 4, 2023. It was conducted by market research company OnePoll, whose team members are members of the Market Research Society and have corporate membership to the American Association for Public Opinion Research (AAPOR) and the European Society for Opinion and Marketing Research (ESOMAR).
34
views

Survey reveals parents’ top comfort foods
It takes less than 30 minutes for Americans to start to feel relief after indulging in their favorite sick-day foods.
That’s according to a survey of 2,000 millennial parents of school-aged children. Results revealed that soup (65%), broth (42%), crackers (35%) and popsicles (35%) topped the list of parent’s favorite comfort foods.
Other less common but still favorite comfort foods include stew (21%) and pasta (14%).
While the top sick-day foods list came out similarly for children, they are more likely to prefer mac and cheese (23%), toast (21%), pudding (20%) and oatmeal (14%) than their parents.
When parents were asked their least favorite sick-time meal, spicy foods (37%), chili (21%) and ginger (16%) came out on top. Interestingly, parents don’t share the same love of mac and cheese with their kids, as 12% admit it is their least favorite comfort food.
Conducted by OnePoll on behalf of Delsym, results also revealed that the average parent has been enjoying their favorite comfort foods, like honey (27%) or toast (21%), for 13 years.
Sickness strikes an average of three times per year, according to respondents. And from when the first person starts feeling bad, 60% have 48 hours or less before the rest of the house becomes symptomatic.
In fact, most respondents (68%) admit their child is usually patient zero, more so than themselves (18%) or their partner (11%).
Household responsibilities such as chores and cleaning (62%), running errands (61%) and hobbies (53%) get pushed by the wayside until they’ve recovered.
More than one-third (36%) also admit that cooking tends to also be brushed off.
This may have something to do with the fact that 83% of respondents believe they can recover faster if they’re able to properly take a break and rest.
But that doesn’t mean parents aren’t indulging in their necessary R&R with their kids. When the whole household is sick, families come together and watch TV (71%), take a nap (69%), sip hot beverages (50%) and cook comfort meals (40%).
“When sickness strikes, it’s no secret that it can bring a functioning household to a complete stop,” said Albert So, Marketing Director, Upper Respiratory Brands at Reckitt. “Not only is it important to let your body recover, indulging in favorite feel-better foods can bring not only symptom relief but bring the whole family together.”
To prepare for sick days, most parents purchase over-the-counter medications (70%), monitor the rest of the household for symptoms (56%) and contact work or school (51%).
Others jump straight into changing the bedding (41%) and stocking up on favorite drinks (38%) and meals (28%).
Symptoms that typically keep respondents out of work or school include headaches or migraines (62%), congestion (57%) and a sore throat (55%).
While 34% try to power through a dry cough, a similar number (32%) would want someone else with that symptom to stay home.
Respondents also feel that if someone else has symptoms like a juicy cough (52%), sore throat (51%) and a stomachache (49%), it’s best to stay away from school or work.
“There is never a “perfect” time to be sick. But the survey revealed that small things like having a clean house (58%) or ready to make comfort meals (55%) can make things much easier,” said So. “In fact, respondents shared that many of them (43%) relieve their symptoms by eating soothing or comforting meals. When the whole family is down for the count, spending time with one another can lead to feeling better together.”
TOP 5 MOST IMPORTANT ASPECTS OF A COMFORT MEAL
● Relief from symptoms - 62%
● The ingredients - 44%
● The temperature - 41%
● Who made it - 22%
● If it’s reheatable - 22%
PARENTS’ FAVORITE FEEL BETTER FOODS
● Soup - 65%
● Broth (chicken, vegetable, bone, etc.) - 42%
● Crackers - 35%
● Popsicles - 29%
● Honey - 27%
● Toast - 21%
● Stew - 21%
● Ginger - 18%
● Applesauce - 16%
● Rice - 14%
● Pasta - 14%
● Oatmeal - 13%
● Chili - 13%
● Spicy foods - 12%
● Mac and cheese - 12%
● Roasted chicken - 11%
● Pudding - 10%
Survey methodology:
This random double-opt-in survey of 2,000 millennial parents of school-aged kids was commissioned by Delsym between Oct. 11 and Oct. 17, 2023. It was conducted by market research company OnePoll, whose team members are members of the Market Research Society and have corporate membership to the American Association for Public Opinion Research (AAPOR) and the European Society for Opinion and Marketing Research (ESOMAR).
58
views

Majority of Americans are future-proofing their homes against severe weather
A new study has identified a growing concern compelling American homeowners to take action for their homes and families: over the next five years, a third of Americans believe severe weather events will leave their homes without power more often.
The poll of 2,000 US homeowners found three in four have made improvements to their homes to address severe weather concerns, 73% of whom made modifications proactively to prevent future damage to the home.
Homeowners stated they’re the most concerned about tornadoes (44%), hurricanes (30%) and thunder and lightning storms (30%), and that their top concerns as a result of severe weather are structural damage to their home (65%), power loss (58%), and the health and safety of their family/friends (57%).
Sixty-four percent were concerned about power loss in their home — so much so that 59% would prioritize buying a portable power supply over other essentials like extra food (54%) and water (53%).
To address concerns about their homes, the survey, commissioned by Generac and conducted by OnePoll, found homeowners implemented improvements including repairing or replacing the roof (34%), getting a power generator (32%) and improving the drainage system (24%).
If they were to lose power today, nearly half (45%) said that compared to options like relying on an existing backup power source they already have at home (27%) or depending on a home solar system (7%), they would be stuck simply waiting for the utility to restore power.
Over one in four (29%) said they “don’t feel confident” their local power provider can keep the power going during severe weather events.
“As evolving climate patterns cause more extreme weather events, homeowners are assessing how power loss may affect their homes, and how they can plan ahead before it does,” said Kyle Raabe, president of Consumer Power for Generac Power Systems. “Millions of Americans are left in stressful, potentially dangerous situations amidst severe weather while they wait for power to be restored. No one should ever have to feel powerless at home.”
The new data indicated homeowners’ concerns while simultaneously demonstrating a knowledge gap in home power. Half reported they understand how their home is powered only somewhat, a little, or not at all.
The survey also looked into the awareness Americans have and lack when it comes to energy use habits and how electricity works within their home.
Only 32% somewhat understand how their home consumes electricity, while 30% somewhat understand how their home is powered and 28% somewhat understand how their home is connected to the larger electrical grid.
Only two in five (45%) believe their homes need the most power in the evenings, from 6 p.m. to midnight. Likewise, 34% believe their homes consume more than the standard average of 886kWh per month.
However, the lack of knowledge isn’t for naught: many respondents monitor and attempt to manage energy consumption within their homes.
They do so by checking their energy provider’s statement on a regular basis (50%), estimating energy use based on personal observations (29%), or by using smart energy devices (28%).
TOP 9 CONCERNS AMERICANS HAVE OVER SEVERE WEATHER
Structural damage to the home - 65%
Losing power/electricity in the home - 58%
The health and safety of family/friends - 57%
Their own health and safety - 49%
Damage to personal belongings - 40%
Damage to their vehicle - 36%
Their pet(s) experiencing discomfort or danger - 32%
The home flooding - 31%
Mold growth - 23%
Survey methodology:
This random double-opt-in survey of 2,000 American homeowners was commissioned by Generac between October 11 and October 16, 2023. It was conducted by market research company OnePoll, whose team members are members of the Market Research Society and have corporate membership to the American Association for Public Opinion Research (AAPOR) and the European Society for Opinion and Marketing Research (ESOMAR).
64
views
Top dietary changes Americans will make in 2024
With New Year’s resolutions top of mind for many, over a third (34%) of people think their diet will be the most challenging to improve this year, more so than their romantic relationship (22%) and even their career (9%), new research suggests.
A survey of 2,000 participants found dietary changes are front and center for 2024 — making more ethical food choices is the biggest goal of the year for nearly six in 10 (57%) respondents, followed by developing more eco-friendly daily habits (56%) and limiting red meat consumption (37%).
And 63% will likely swap what they’re currently consuming for healthier alternatives, with 67% planning to make at least three healthy swaps.
Those swaps include eating more turkey instead of pork (31%), drinking more water in place of sugary beverages (62%), making homemade salad dressing instead of store-bought (59%), eating fruits instead of candy (34%).
Half will also reexamine their breakfast choices, with 85% of those making healthy swaps next year opting for turkey over pork in their choice of bacon.
Conducted by OnePoll on behalf of Godshall’s Quality Meats, the survey also found people’s biggest motivator is being healthy for their partner, more so than for themselves (28% vs. 19%).
But they also anticipate some roadblocks ahead. More than seven in 10 (73%) think it’ll be difficult to learn how to cook or prepare healthier alternatives for the swaps they’re making.
Others believe getting their household to enjoy these options (59%) and finding new favorites for go-to foods (51%) won’t be so easy.
“For anyone who is eating a high protein diet or looking to reduce their fat consumption, swapping turkey bacon for pork bacon is a simple, healthy change to make,” said Parker Wallace, owner of Parker’s Plate. “All-natural turkey bacon has less total fat and half the saturated fat compared to pork bacon, plus it tastes delicious!”
When it comes to making healthier choices, nearly eight in 10 (78%) said it’s easier to start with small swaps than to change their entire diet.
And they’re letting their experience do the talking — six in 10 (60%) have previously made some of the healthy swaps they plan to make next year in prior years.
“With eco-friendly habits becoming more of a priority for consumers in 2024, it's important to look for brands that take sustainable actions to create an environmental impact," said Ron Godshall, President of Godshall's Quality Meats. "We've made a commitment to going green by using solar energy and clean burning natural gas in addition to reducing our carbon footprint."
MOST CHALLENGING AREAS OF LIFE TO IMPROVE IN 2024
Personal hobbies and interests - 49%
Fitness - 43%
Diet - 34%
Family and friendships - 27%
Romantic relationship - 22%
Career - 9%
PEOPLE’S BIGGEST GOALS FOR 2024
Make more ethical food choices - 57%
Develop more eco-friendly daily habits (e.g., conserving water/electricity, using reusable tote bags, etc.) - 56%
Limit red meat consumption - 37%
Eat healthier - 37%
Spend more time with family - 29%
Find a more fulfilling job - 13%
Increase my income - 11%
Survey methodology:
This random double-opt-in survey of 2,000 people who follow an omnivore diet was commissioned by Godshall’s between Nov. 6 and Nov. 7, 2023. It was conducted by market research company OnePoll, whose team members are members of the Market Research Society and have corporate membership to the American Association for Public Opinion Research (AAPOR) and the European Society for Opinion and Marketing Research (ESOMAR).
46
views

Top financial disruptors that stress out Americans
Americans with limited savings stress about their finances for nearly an entire work month (18.63 days) each year, new research suggests.
A survey of 2,000 U.S. adults with less than two months of liquid savings or assets on hand found that while their finances are often top of mind, a third (33%) feel paralyzed to act when a financial disruption occurs.
The most common disruptions that make people feel paralyzed include an unexpected bill or expense (55%), medical emergency (52%), increase in cost of necessities (44%), increase in loan payments (37%), or job loss (36%).
Financial tasks take up a lot of time in an average month, with about a quarter of respondents devoting one full week per month to budgeting, checking their bank account balance and reviewing their credit transactions.
Commissioned by Best Egg and conducted by OnePoll for Financial Wellness Month, the survey also found a whopping 77% of respondents say they carry the mental load of their finances for their household.
Forty-six percent find it difficult to balance their financial wellness and other priorities — especially Gen Z (53%).
Those priorities include spending time with friends (41%) and family (40%), as well as their mental well-being (39%) and day job (39%).
It’s no surprise, then, that people’s hobbies (46%), personal relationships (44%) and sleep patterns (41%) have all been affected by their unique financial situations.
Additionally, the data looked at how people define financial wellness and financial confidence, and what they need to support them in their journey to becoming money confident.
Respondents characterized financial wellness as being able to pay their bills on time (50%), maintaining good credit (47%), and being able to afford necessities (47%).
Other definitions included not having any debt (46%), having an emergency fund (45%), being able to save for retirement (42%) and being able to save for their children’s education (42%).
When it comes to financial confidence, though, most said it’s about feeling prepared for unexpected expenses (54%), knowing how to make the right decision when it comes to money (53%) and understanding their financial situation and goals (52%).
However, only 57% rated their current level of financial confidence as “high.”
“The keys to financial confidence are having knowledge, control and security about your finances so you feel prepared to handle the financial challenges that may come your way,” said Bobby Ritterbeck, President, Best Egg. “When people have the right tools to take control of their finances, their budget gets some room to breathe, empowering them to continue working on their short and long-term financial goals.”
While people are most likely to devote their time to managing their finances after paying their bills (50%), their financial stress typically peaks at the end of the month (24%).
Thankfully, 85% feel they have support from their family to help with financial stress.
However, this sentiment differs by generation, as younger age groups, especially millennials (90%), were far more likely to feel their family has their back compared to baby boomers (60%).
When a financial disruption occurs, nearly a third (32%) will tap into their savings, with 28% asking family for assistance and only 10% considering loan options.
“Everyone’s financial situation is different, which is why we understand the importance of providing flexible, personalized solutions tailored to fit people’s specific needs, whether that be helping them pay rent on time or an unexpected bill. Finding the right product that supports your financial needs will help you make smart financial decisions and be money confident,” said Ritterbeck.
HOW DO PEOPLE DEFINE “FINANCIAL WELLNESS”?
Being able to pay my bills on time - 50%
Maintaining good credit - 47%
Being able to afford necessities - 47%
Not having any debt - 46%
Having an emergency fund - 45%
Being able to save for retirement - 42%
Being able to save for my children’s education - 42%
Being on track for long-term financial goals - 41%
Being able to afford nice-to-haves - 41%
Knowing how to live within my means - 37%
Sticking to a budget - 35%
Being able to invest - 33%
HOW DO PEOPLE DEFINE “FINANCIAL CONFIDENCE”?
Feeling prepared for unexpected expenses - 54%
Knowing to make the right decision when it comes to money - 53%
Understanding my financial situation and goals - 52%
Having control by understanding the full financial picture - 51%
Feeling financially secure - 49%
–
24.5 minutes a day thinking about finances x 365 days a year = 8942.5 minutes / 60 minutes in an hour = 149.041 hours a year / 8 hour work day = 18.63 work days
Survey methodology:
This random double-opt-in survey of 2,000 U.S. adults with limited savings (defined as having less than two months of liquid savings or assets on hand) was commissioned by Best Egg between Nov. 20 and Nov. 23, 2023. It was conducted by market research company OnePoll, whose team members are members of the Market Research Society and have corporate membership to the American Association for Public Opinion Research (AAPOR) and the European Society for Opinion and Marketing Research (ESOMAR).
43
views

Gen Z looks for this when car shopping
Is Gen Z committed to cars more than any other generation? A new poll has revealed a trend about just how serious the nation’s newest set of consumers are about vehicles.
In a poll of 4,000 U.S. adults split evenly by generation, 76% of Gen Z reported purchasing their first vehicle before they were 21 — a stark contrast to 56% of millennials who purchased at the same age.
When starting their vehicle shopping process, 54% of Gen Zers said price plays the biggest factor in their decisions. Other major considerations when looking for a new car include fuel efficiency (42%), longevity and reliability (36%), safety rating (29%) and comfort (28%).
Two-thirds of those in the Gen Z generation said they feel more confident in understanding how cars are priced versus older generations (Gen X: 53% and baby boomers: 37%).
Commissioned by Cars.com, the study found 62% bought their current vehicle from a dealership or pre-ordered their vehicle from a dealer. Eighty-one percent overall agreed it’s important to touch, feel and test drive a car before buying it.
Four in five Gen Zers also said they prefer purchasing their vehicles in person, as opposed to online shopping (9%), in contrast to the tech-focused millennials who prefer online shopping (16%).
“What we’re especially keen on is how Gen Z is going to shape the vehicle purchasing landscape,” says Jenni Newman, editor-in-chief, Cars.com. “What’s most interesting is how Gen Z is bucking the trend set forth by millennials when it comes to car shopping. Though arguably the most tech-savvy generation,
“We're seeing this younger generation care more about talking to people in person when it comes to buying a big purchase like a car — valuing the role local car dealerships have in that last mile of car buying — and taking more time to research what they want before making a major decision.”
Conducted by OnePoll, results found Gen Z is also taking more time when shopping before they pull the trigger — 64% take up to four weeks to do research on vehicles before buying.
Interestingly, it was also found 55% of Gen Z purchased a used car; compared to 55% of Millennials who purchased new.
To make things easier for themselves, respondents said they prefer using car shopping tools that give them history reports (52%), total cost transparency (47%) and vehicle price history (44%).
Research showed a number of financial differences between Gen Z and other generations when car shopping, as well.
Over half (57%) of Gen Z is comfortable with car payments as high as $400, similar to 60% of Gen Xers; although millennials (48%) were the least comfortable with these prices.
While confident in the amount they can spend, Gen Z admitted fears about not getting a fair price (22%) and the financing process and getting approved (16%) as some of their biggest pain points during the car buying process.
Most Gen Zers will shop for vehicles by first consulting friends and family members (60%) then car dealer websites and salespeople (55%).
This differs from their Millennial counterparts who first seek out car dealer websites and sales people (63%) and friends and family second (51%), however the third rank is where all age groups (36%) align: the value of online auto expert review articles, websites or apps.
Testing a vehicle’s capabilities was found to often come in the form of an initial test drive (78%), having a more-knowledgeable friend or family member take a look at it (56%) or taking a look under the hood themselves (42%).
Over half (54%) of Gen Zers would consider buying an electric vehicle (EV) in the future, different from their Gen X parents (41%), due to long-term financial benefits (52%). Additional factors cited include their environmental impact (54%) and not needing to pay for gas (52%).
“For years, we joked about younger generations seemingly prioritizing their personal satisfaction over practicality,” adds Newman. “Now, we’re seeing a blend of both — Gen Z wants to afford a vehicle that’s not going to leave them feeling desperate with their budget, but is willing to do the work to make sure it fits their lifestyle.”
TOP 13 MOST IMPORTANT CAR SHOPPING FACTORS FOR GEN Z
Price - 54%
Fuel efficiency - 42%
Longevity and reliability - 36%
Safety rating - 29%
Comfort - 28%
The brand/manufacturer - 19%
Family/friend recommendations - 15%
The color - 13%
Apple CarPlay/Android Auto - 10%
The dealership/platform I bought the vehicle from - 9%
Cargo space - 9%
Ease of access getting in and out - 7%
Blind spot monitoring - 7%
Survey methodology:
This random double-opt-in survey of 1,000 Gen Z American car owners and drivers was commissioned by Cars.com between August 30 and September 7, 2023. It was conducted by market research company OnePoll, whose team members are members of the Market Research Society and have corporate membership to the American Association for Public Opinion Research (AAPOR) and the European Society for Opinion and Marketing Research (ESOMAR).
239
views